Attached files
| file | filename |
|---|---|
| 8-K - FORM 8-K - Amtrust Financial Services, Inc. | d381083d8k.htm |
 April
2017 AmTrust Financial
Services, Inc. Year End 2016 Investor Presentation CONSISTENT VISION DIFFERENTIATED MODEL SUSTAINABLE GROWTH Exhibit 99.1 |
 2 Forward Looking Statements This supplemental presentation contains certain forward-looking statements that are intended to be covered by the
safe harbors created by the Private Securities Litigation Reform Act of 1995. When we
use words such as “anticipate,” “intend,”
“plan,” “believe,” “estimate,” “expect,” or similar expressions, we do so to identify forward-looking statements. Examples of forward-looking statements include the plans and objectives of management for future operations,
including those relating to future growth of our business activities and availability
of funds, and are based on current expectations that involve assumptions
that are difficult or impossible to predict accurately and many of which are beyond our control. Actual results may differ materially from those expressed or implied in these statements as a
result of significant risks and uncertainties, including, but not limited to,
non-receipt of expected payments from insureds or reinsurers, changes
in interest rates, a downgrade in the financial strength ratings of our insurance subsidiaries, the effect of the performance of financial markets on our investment portfolio, the amounts, timing and
prices of any share repurchases made by us under our share repurchase program,
development of claims and the effect on loss reserves, accuracy in
projecting loss reserves, the cost and availability of reinsurance coverage, the effects of emerging claim and coverage issues, changes in the demand for our products, our degree of success in
integrating acquired businesses, the effect of general economic conditions, state and
federal legislation, regulations and regulatory investigations into
industry practices, our ability to timely and effectively remediate the material weaknesses in our internal control over financial reporting and implement effective internal control over financial
reporting and disclosure controls and procedures in the future, risks associated with
conducting business outside the United States, the impact of Brexit,
developments relating to existing agreements, disruptions to our business
relationships with Maiden Holdings, Ltd. or National General Holdings Corp., breaches
in data security or other disruptions with our technology, heightened
competition, changes in pricing environments, and changes in asset
valuations. Additional information about these risks and uncertainties, as well as
others that may cause actual results to differ materially from those
projected, is contained in our filings with the SEC, including our Annual Report on Form 10-K and our quarterly reports on Form 10-Q. Any projections and statements in this supplemental presentation speak
only as of the date of this supplemental presentation and we undertake no obligation to
update or revise any forward- looking statement, whether as a result
of new information, future developments or otherwise, except as may be
required by law. |
 3 CONSISTENT VISION DIFFERENTIATED MODEL SUSTAINABLE GROWTH |
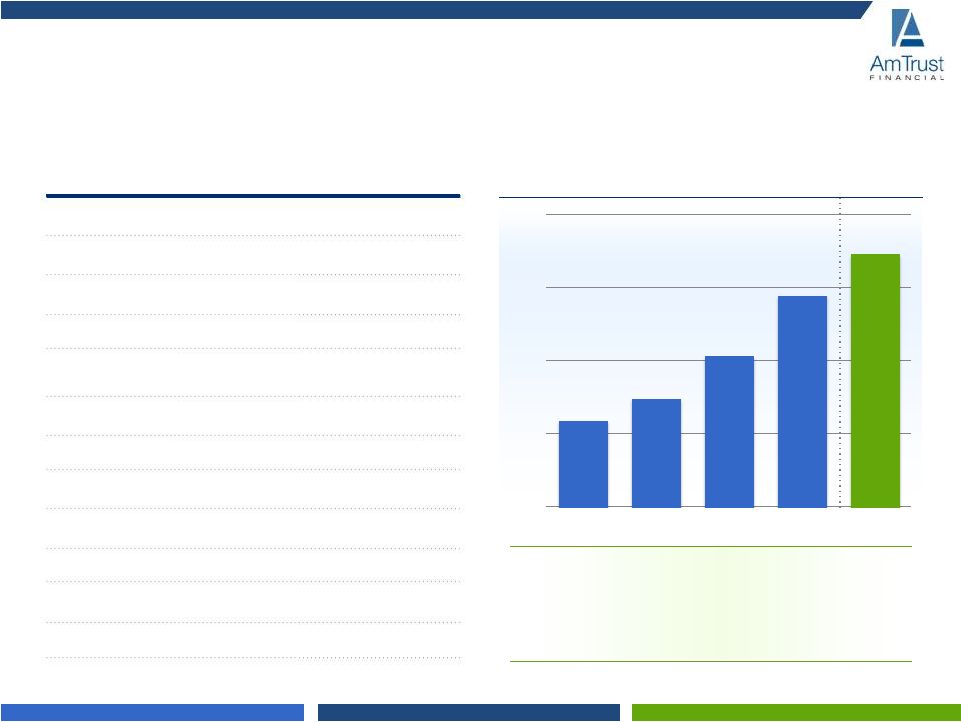
 4 Created Shareholder Value STRONG BOOK VALUE GROWTH (%) BVPS CAGR 19.4% 2.35 2.69 2.70 3.97 4.95 6.10 7.33 8.28 10.37 12.74 13.81 0 4 8 12 16 2006 2007 2008 2009 2010 2011 2012 2013 2014 2015 2016 |
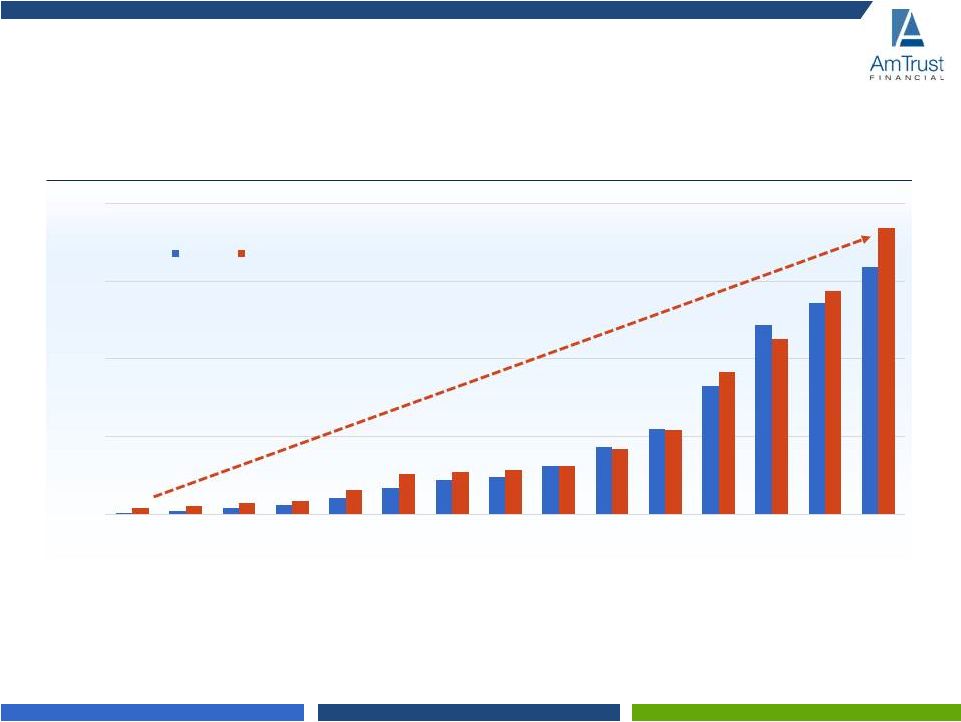 5 Consistent Growth Since the Beginning 0 2,500 5,000 7,500 10,000 2002 2003 2004 2005 2006 2007 2008 2009 2010 2011 2012 2013 2014 2015 2016 GWP AND INVESTED ASSETS ($, Millions) GWP Invested assets |
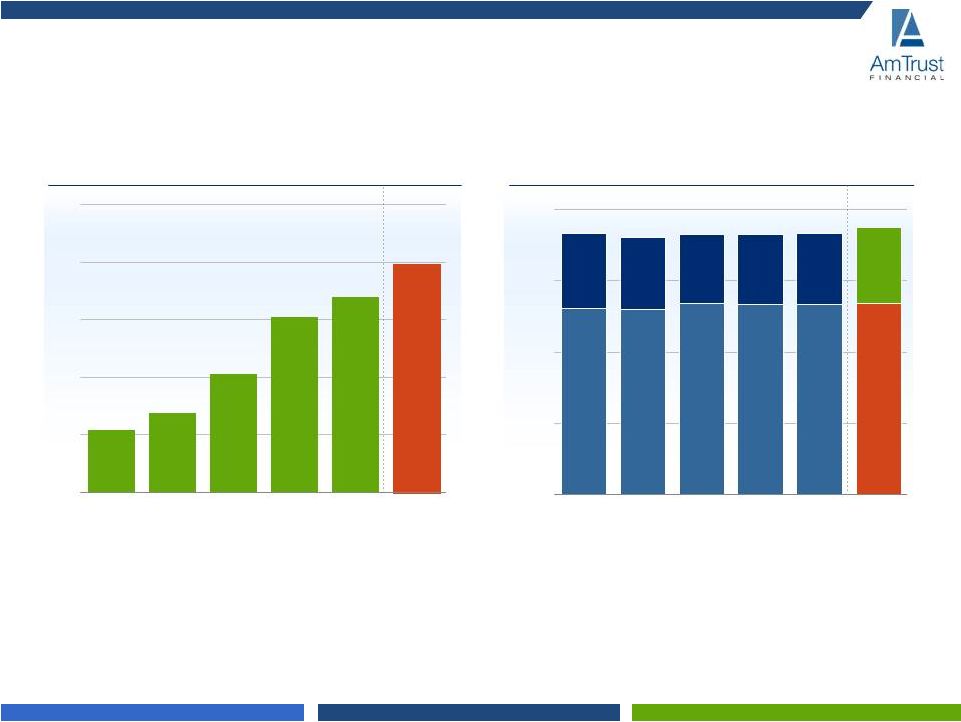 6 History of Strong Underwriting 6 • Granular lower risk portfolio and geographic diversity drive lower loss ratios • Propriety technology drives lower costs, enhanced underwriting, and improved agent and client experience - Results in lower origination costs and improved retention - Enables strong data mining and analysis of enhanced portfolio metrics • Ceding commission further reduces net acquisition costs GROSS WRITTEN PREMIUMS ($, Billions) NET COMBINED RATIO (%) $2.15 $2.75 $4.11 $6.09 $6.80 $7.95 0 2 4 6 8 10 2011 2012 2013 2014 2015 2016 65.4 65.0 67.0 66.4 66.7 67.3 26.2 25.3 24.2 24.7 24.7 26.4 91.6 90.3 91.2 91.1 91.4 93.7 0% 25% 50% 75% 100% 2011 2012 2013 2014 2015 2016 |
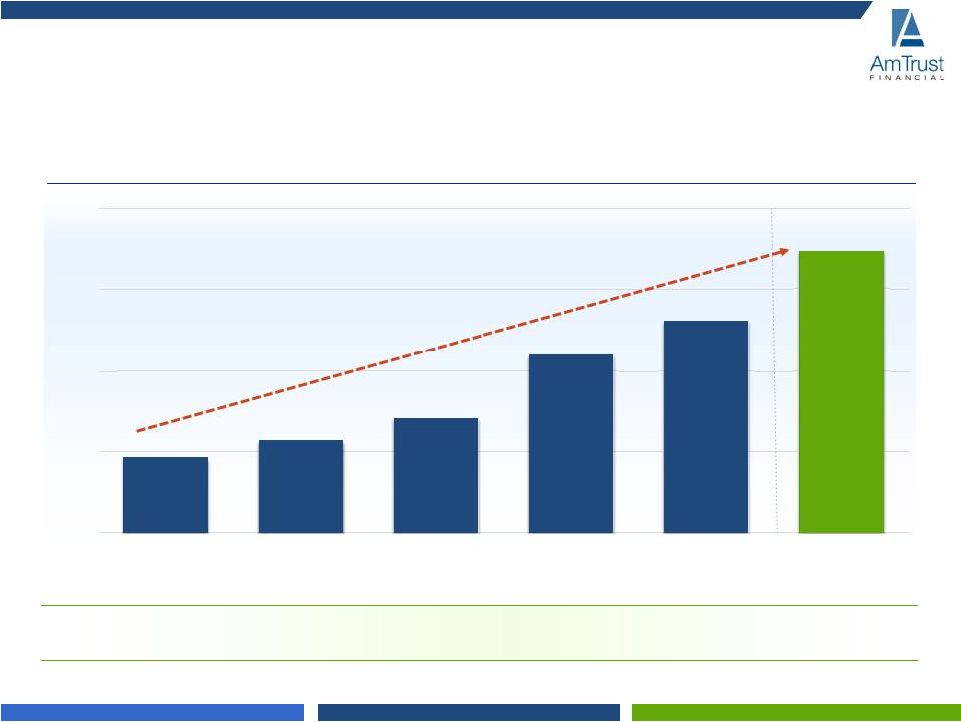 7 Consistent Investment Income Growth INVESTMENT INCOME ($, millions) Conservative, High Quality Investment Strategy 6 Year CAGR 30% $0 $60 $120 $180 $240 2011 2012 2013 2014 2015 2016 |
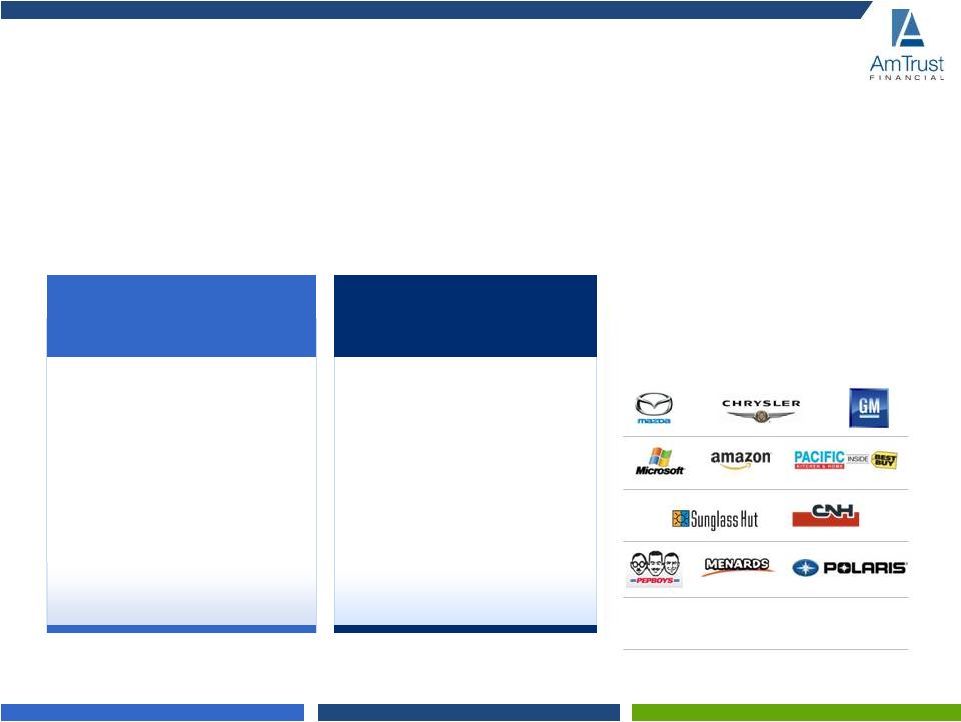
 8 Small Business Focus TARGET lower-risk, underserved businesses • Top 60 classes include restaurants, retailers and professional offices • Average policy premium of $10K LOWER price sensitivity than traditional products • Strong client retention with 84% renewal rates on business written • Innovative technology creates ease-of-use BROAD DISTRIBUTION through 7,500+ retail and wholesale agents • Distribution network across the West, Mid-Atlantic, Southeast and Mid-West regions • Agents highly trained on AmTrust’s preferred industry classes DISCIPLINED and consistent pricing through extensive historical data • Valued by policyholders and distributors Differentiated Approach to Insuring Small Businesses |
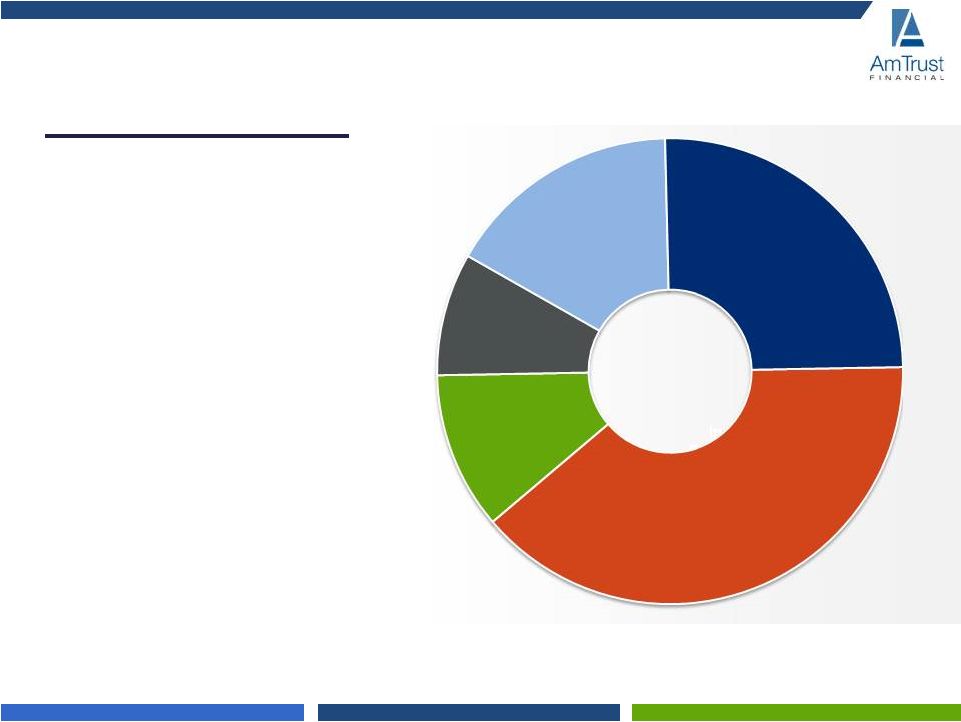
 9 Revenue Contribution by Business Segment Specialty Risk and Extended Warranty United States, UK, Italy, France, Norway • Low hazard and non- catastrophic accidental damage and mechanical breakdown coverage for consumer and commercial goods in U.S. and E.U. • Specialty commercial and consumer coverage internationally Specialty Program California, New York, New Jersey, Florida • Over 186 programs in Workers’ Compensation, general liability, commercial auto and property coverage to specialized niche sectors or geographic regions through risk sharing agreements with 50 MGAs Largest Markets Primary Products 2016 Revenue $5.45 Billion, by Business Segment 40% 28% 5% 17% 10% Small Commercial Business Specialty Risk and Extended Warranty Investment Income Specialty Program Service and Fee Income Small Commercial Business California, New York, Florida, New Jersey • Workers’ Compensation insurance in low and medium hazard classes • 61% of segment’s GWP is Workers’ Compensation • 39% of segment’s GWP is commercial package and other low-hazard P&C products |
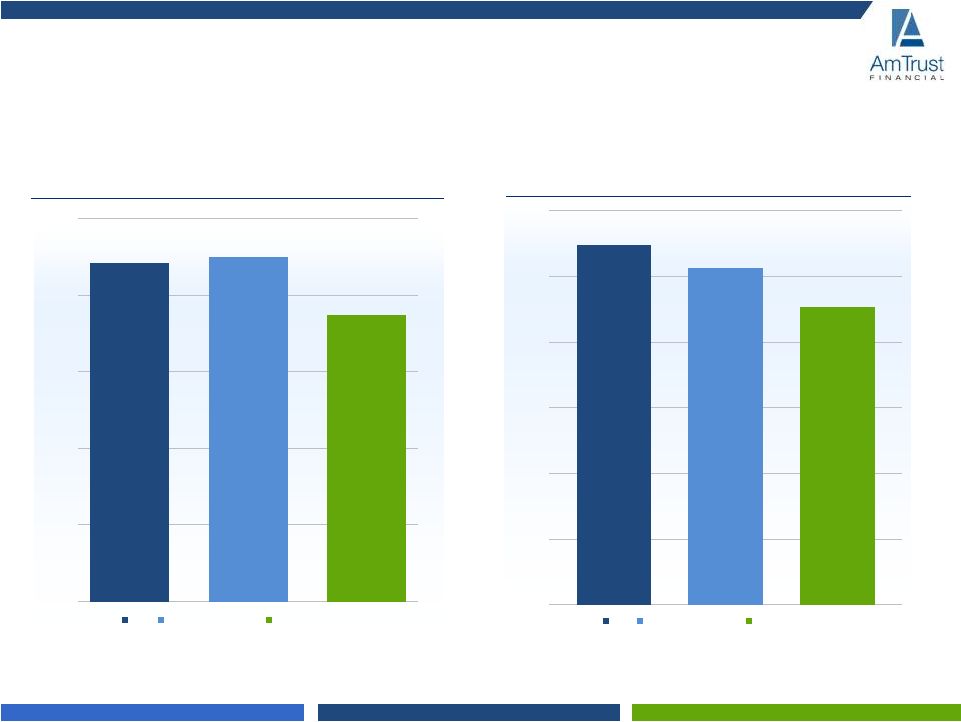
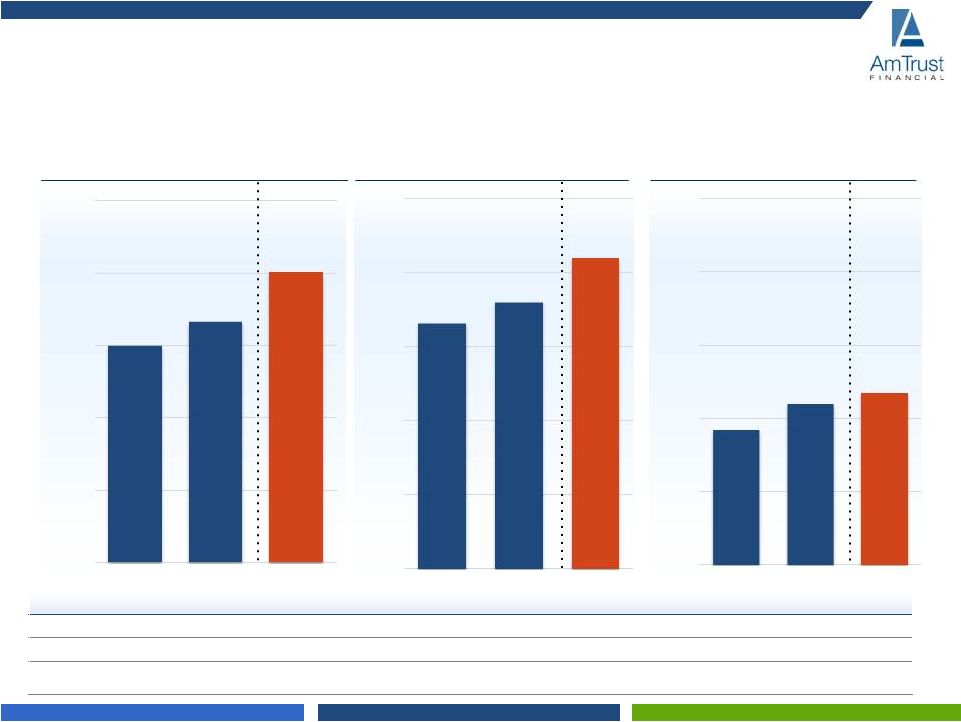 10 Consistent Business Segment Performance SMALL COMMERCIAL BUSINESS (GWP $, millions) SPECIALTY PROGRAM (GWP $, millions) SPECIALTY RISK & EXTENDED WARRANTY (GWP $, millions) % Small Commercial Business Specialty Risk & Extended Warranty Specialty Program 2014 2015 2016 2014 2015 2016 2014 2015 2016 Loss Ratio 65.7 65.4 66.3 66.5 67.6 66.3 67.3 68.9 71.5 Expense Ratio 26.2 25.8 26.9 21.6 21.3 24.1 27.2 27.6 28.8 $0 $1,000 $2,000 $3,000 $4,000 $5,000 2014 2015 2016 $0 $600 $1,200 $1,800 $2,400 $3,000 2014 2015 2016 $0 $600 $1,200 $1,800 $2,400 $3,000 2014 2015 2016 |
 11 Diverse, Lower Volatility Product Mix • Balanced mix of higher frequency and low hazard business lines • Business lines with predictable loss experience • Lower pricing pressures • Higher retention rates • Differentiated workers’ comp franchise in small business market • Attractive warranty insurance franchise OTHER LIABILITY COMMERCIAL AUTO WORKERS’ COMPENSATION OTHER WARRANTY 39% 11% 9% 16% 25% 2016 Gross Written Premiums |
 12 Diversifying Geographic Footprint • Leveraging existing core competencies (people, technology, data, etc.) to act on new opportunities globally • Continue to target lower risk, shorter tail business lines • Increasing global diversification will insulate against country- specific volatility • Growth opportunities in Europe as well as Southeast Asia UNITED KINGDOM OTHER UNITED STATES ITALY 7% 4% 81% 8% 2016 Gross Written Premiums |
 13 Small Low Hazard Workers’ Comp Performs Better Across the Industry 0% 10% 20% 30% 40% 50% All Top 60 All Sizes Top 60 < $25k CALIFORNIA INDUSTRY INCURRED LOSS RATIOS (1) : 4-YEAR AVERAGE (%) (1) Source: WCRB (2) Source: NCCI 0% 10% 20% 30% 40% 50% 60% All Top 60 All Sizes Top 60<$25k FLORIDA INDUSTRY FULLY DEVELOPED LOSS RATIOS (2) : 5-YEAR AVERAGE (%) |
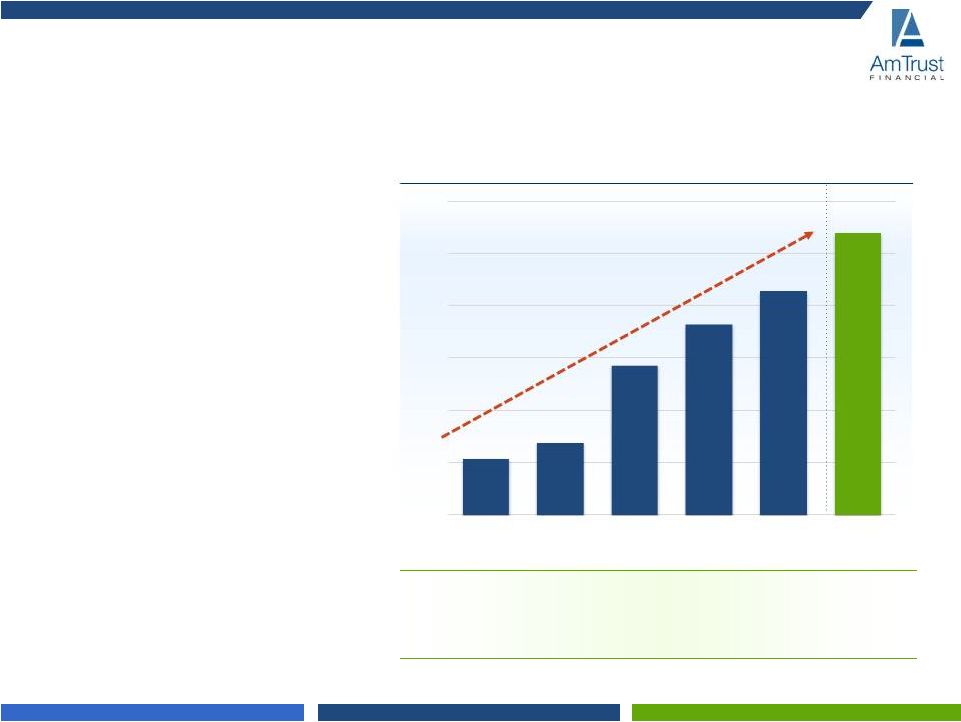 14 Growing High-Margin Service and Fee Revenue SERVICE AND FEE REVENUE ($, millions) High-margin, unencumbered source of cash flow, requiring limited capital 6 Year CAGR 38% • Fees-based business represents approx. 10% of total revenue • Sources of service and fee revenue – Warranty and Consumer Services – Assigned Risk – Policy Issuance Fees – Workers’ Compensation Fund Management – Insurance Brokerage Fees – Unemployment Insurance Services – IT Systems Management and Support – Asset Management • Growth driven organically and through acquisition • Complementary to insurance business • Significant embedded value in the service and fee business $0 $100 $200 $300 $400 $500 $600 2011 2012 2013 2014 2015 2016 |
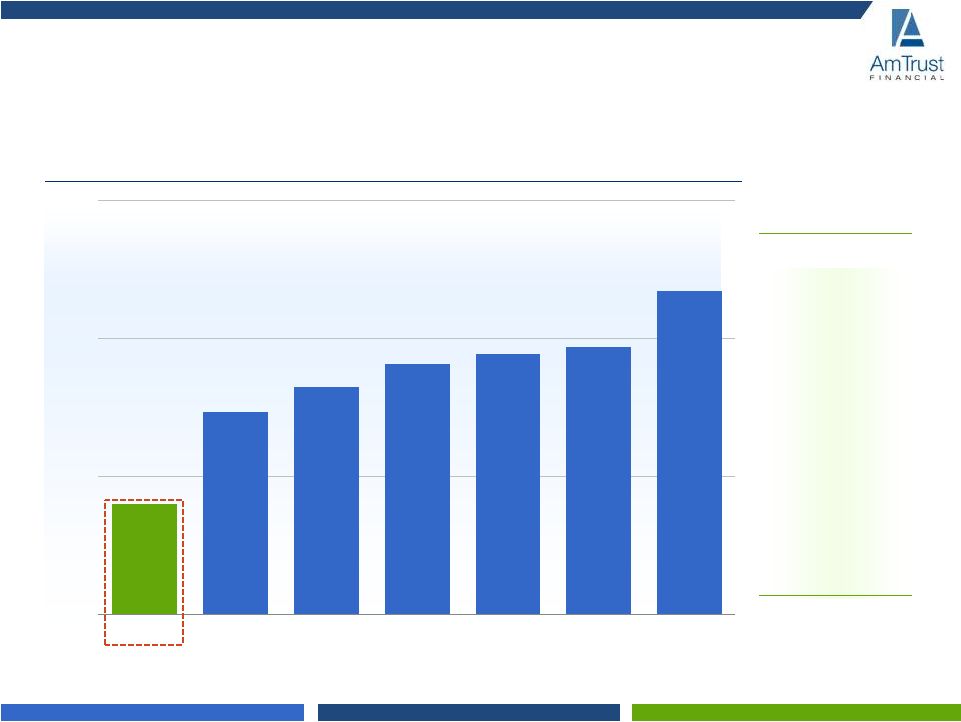 15 26.4% 31.7% 33.2% 34.5% 35.1% 35.5% 38.8% 20% 28% 36% 44% AFSI EIG WRB THG CNA SIGI MKL Q4 2016 EXPENSE RATIOS Technology Innovation Drives Sector’s Lowest Expense Ratio Proprietary technology Economies of scale Efficient use of reinsurance Control of expenses Source: SNL |
 Underwriting Excellence
AmTrust has always been an underwriting
company • Team of experienced underwriters underwrite the policies • Online system declines undesirable risks and underwriting filters predetermine pricing tiers for agent/underwriters • Daily morning reports provided to staff to review prior day’s activities Stable loss ratio and pricing • Disciplined pricing throughout the underwriting cycle • Low hazard risks limit severity risk • Since inception, have remained focused on our small business client base Proprietary technology • Technology enables individual underwriting decisions on over 200,000 risks AMTRUST’S LOSS RATIO (%) 16 65.0 67.0 66.5 66.8 67.3 0 15 30 45 60 75 2012 2013 2014 2015 2016 |
 17 Raised over $2.0 billion in capital (Since December 2013) $115 million 6.75% non-cumulative preferred stock offering, June 2013 $250 million 6.125% private placement of senior notes, August 2013 $105 million 6.75% non-cumulative preferred stock, July 2014 $80 million 7.625% non-cumulative preferred stock offering, September 2014 $76 million 2.75% convertible note in a privately negotiated exchange of the 5.5% convertible note, December 2014 (new money only) $172 million 6.9 million share (1) common equity raise, January 2015 $182 million 7.5% non-cumulative preferred stock offering, March
2015 $150 million 7.25% 40YR subordinate notes, June 2015 $135 million 7.50% 40YR subordinate notes, September 2015 $315 million 10 million
share (1)
common equity raise, November 2015
$143 million 7.75% non-cumulative preferred
stock offering, March 2016 $288 million 6.95% non-cumulative preferred stock, September 2016 (1) Reflects 2 for 1 stock split Thoughtful Capital Management to Sustain Growth SHAREHOLDERS’ EQUITY (GAAP) ($, millions) 0 1,000 2,000 3,000 4,000 2012 2013 2014 2015 2016 Over the last 12 months, AmTrust has raised approximately $750 million of capital and generated $363 million in net income to common, increasing capital by $545 million |
 Commercial Business Overview
18 We are dedicated to small business. AmTrust offers multi-line workers’ compensation and commercial insurance for small businesses across
the U.S. Our focus on small account sizes and lower hazard industry classes, combined
with constant review and analysis resulting in nimble responses to
changing trends, mitigates loss volatility and allows AmTrust to grow
profitably. Small commercial business loss ratio consistently in the 65-66% range. COMMERCIAL PACKAGE & OTHER LOW-HAZARD P&C WORKERS’ COMPENSATION SMALL COMMERCIAL BUSINESS Gross Written Premium MARKET LEADERSHIP AmTrust ranks Top 3 ranked workers’ comp carrier $4.0 Billion Preferred Industry Classes • Restaurants • Hospitality • Offices/Professional • Retail • Community Banks • Auto Service • Service Industries • Light Manufacturing • Not-for-Profits • Artisan contractors • Wholesale operations • Schools Small Business Insurance Coverages • Workers’ Compensation • Businessowners (BOP) • Commercial Package (ezPac) • Commercial Auto (ezAuto) • Contractors GL/IM (ezArtisan) • AmTrust Workplace (EPLI) • Garage (Auto Service Plus) • Directors & Officers • Fiduciary Bonds/Professional • Transportation (Motor Carrier) • Surety (Contractors & License Bonds) • Umbrella 61% 39% |
 19 We provide specialized business and warranty insurance solutions. AmTrust offers a variety of specialty risk products, including payment protection insurance, motor vehicle
service contracts, consumer and commercial product coverage. Extensive new client and
product diligence, and proactive claims management resulting in
real-time pricing adjustments, allows AmTrust to grow profitably.
Specialty risk & warranty loss ratio (global) consistently in the 66-67% range. MARKET LEADERSHIP AmTrust ranks Top 3 warranty provider in the U.S. Specialty Risk & Warranty Overview MANAGE MILLIONS OF ACTIVE CONTRACTS Distribution Channels • Original equipment manufacturers • Retailers • Automotive dealers • Affinity partners • Direct-to-consumer • Brokers, third-party administrators, and MGAs • A variety of channels for product delivery assures flexibility as opportunities develop Specialty Risk Insurance Coverages • Automotive • Consumer electronics and appliances • Commercial equipment • Recreational vehicle and power sports • A large array of products that allows for growth in shifting markets |
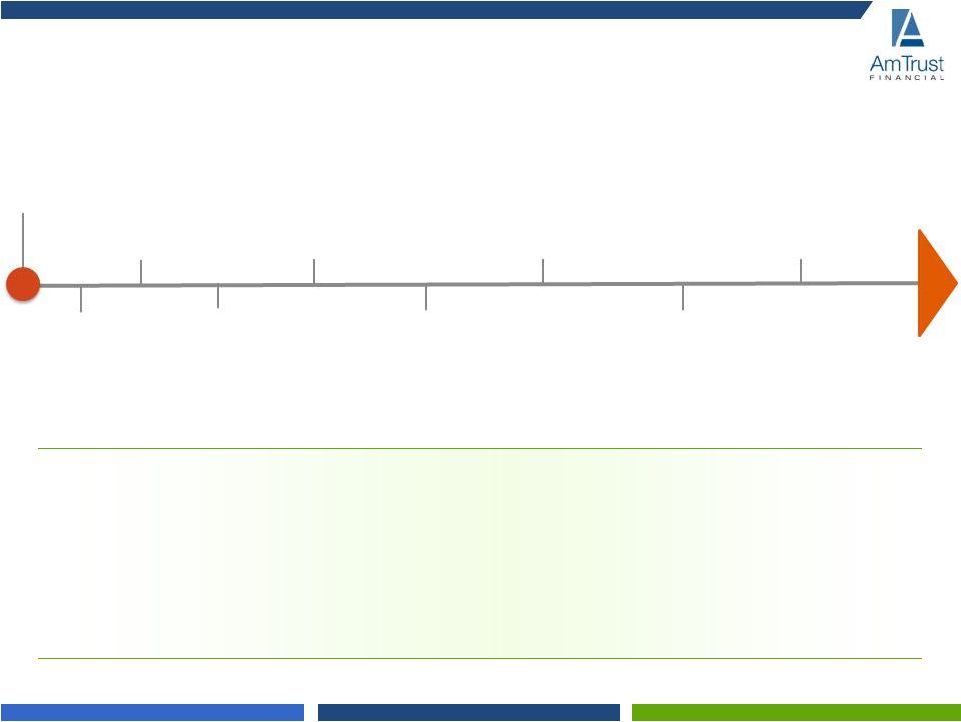 20 A History of International Growth IGI (AmTrust Europe) AmTrust Insurance Spain AmTrust Nordic TecProtec (AmTrust Mobile Solutions) AmTrust Italia Car Care Plan 2007 2005 2011 2013 2014 2010 Sagicor (AmTrust at Lloyd’s) 2015 Genworth (AMT Mortgage Insurance) Composite Legal Expenses AGRM (AmTrust France) 2003 International Operations begin through AIU $1m GWP
2016 ANV Nationale Borg Globally diversified risk portfolio with an attractive business and exposure mix, built to deliver stable
and sustainable returns
Investment in a scalable operating platform and commitment to delivering efficiency
improvements Additional revenue through acquisition of distribution and
servicing businesses Growth of Lloyd’s insurance
business Establishing key building blocks to effectively support future
growth and expansion |
 21 AmTrust International CAPABILITIES Building a multinational company that can serve our clients both locally & globally EXPANSION Target businesses that support our niche insurance focus and can benefit from our creative structures and IT DIVERSIFICATION Offering a range of insurance products and distribution and service capabilities GLOBAL PRESENCE 1,520 employees with offices in 25 countries LEVERAGE Leveraging AmTrust tools and capabilities for operating efficiencies QUALITY Access to Lloyd’s offers “A+” rated (S&P) product and removes barriers to enter into new markets A+ |
 22 AmTrust International Offices and Operations Lima, Peru Santa Cruz, Bolivia Sao Paulo, Brazil Rio de Janerio, Brazil Curaco, Curaco Asuncion, Paraguay New Jersey, USA Dublin, Ireland Paris, France Lyon, France Barcelona, Spain Madrid, Spain London, England Nottingham, England Cardiff, Wales Chiswick, England Leeds, England Colchester, England Stockholm, Sweden Moscow, Russia Frankfurt, Germany Neu-Isenburg, Germany Helsinki, Finland Amsterdam, Netherlands Luxembourg Milan, Italy Genoa, Italy Naples, Italy Antwerp, Belgium Istanbul, Turkey Mumbai, India Kuala Lumpur, Malaysia Selangor, Malaysia Jakarta, Indonesia Shanghai, China Ho Chi Minh City, Vietnam Singapore AmTrust International Underwriters AmTrust Europe AmTrust at Lloyd's Car Care Plan Motors Insurance Company AmTrust Insurance Services AmTrust Insurance Spain AmTrust Mobile Solutions AmTrust Revive Gadget Repair Solutions Composite Legal Expenses Arc Legal AMT Mortgage Insurance Nationale Borg GLOBAL OFFICES OPERATIONS 22 |
 23 Technology is Core PROPRIETARY SYSTEMS offer competitively lower processing costs SIGNIFICANT CAPACITY AmTrust software and compute cloud Multiple data center nodes SINGLE PLATFORM provides timely and granular analysis of business and efficient absorption of acquisitions CUSTOMIZED SYSTEM creates quick response to market opportunities and adaptation faster rate of innovation |
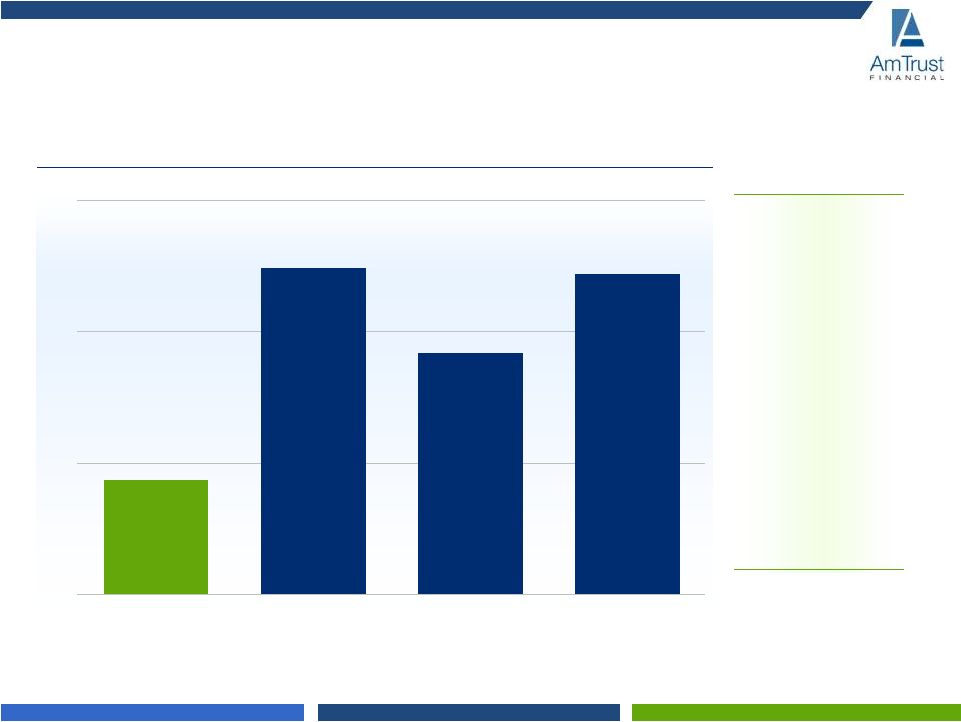 24 2016 GROSS EXPENSE IT RATIOS We build our own We consolidate to common platforms IT costs well below industry average 1.8% 5.0% 3.7% 4.9% 0% 2% 4% 6% AmTrust Industry: Large Industry: High Performer Industry Overall Source: Novarica Note: Industry Large > $1B IT Advantage |
 Improved Operations through Analytics
25 QUANTITATIVE UNDERWRITING Enhance underwriting process by utilizing various predictive models from estimating losses to pricing elasticity CALL CENTER OPTIMIZATION Analyze raw telecom data, model call patterns and create plans for staffing optimization and refine training guidelines FRAUD DETECTION & PREVENTION Utilizing both structured data (claims and
policy data) and textual data (notes, police reports, social medial, speech analytics) to build predictive & behavioral models WORKFLOW TRANSFORMATION Automatic routing based on skills, experience and best fit between customer and employee for optional outcome BUILDING A DATA SCIENCE CENTER OF EXCELLENCE UTILIZING BIG DATA Combine analytical applications (scoring model,
behavioral models) with continuous stream of real-time & third party data (vehicle sensors,
satellite data) 360 DEGREE CUSTOMER PROFILES Using direct and indirect data (social media,
blog comments, website, yelp reviews)
to refine our sales, marketing and existing customer service |
 FINANCIAL INFORMATION |
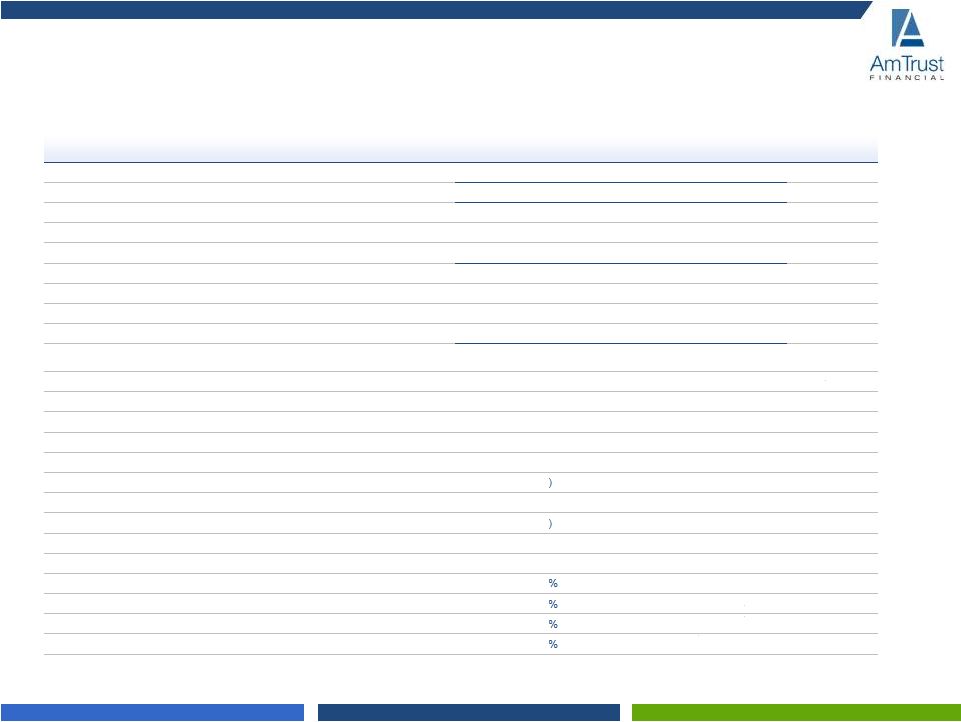 27 ($, millions, except per share amounts) Restated 2014 Restated 2015 2016 % Change Gross Written Premium $ 6,092.4 $ 6,799.5 $ 7,949.3 16.9% Net Written Premium $ 3,941.2 $ 4,261.9 $ 4,851.3 13.8% Net Earned Premium $ 3,506.8 $ 4,021.2 $ 4,668.0 16.1% Service and Fee Income 365.4 428.1 538.0 25.7% Net Investment Income & Realized Gains 148.0 164.4 244.5 48.7% Total Revenues 4,020.2 4,613.8 5,450.5 18.1% Loss and LAE Expense 2,331.3 2,688.1 3,142.3 16.9% Acquisition Cost and Other Underwriting Expense 870.7 993.5 1,230.2 23.8% Other Expense 422.5 473.3 564.1 19.2% Income before Other Income (Expense), Equity Earnings, Interest Expense & Tax $ 395.7 $ 458.8 $ 513.9 12.0% Income Gains from Life Settlements 12.3 19.8 46.1 132.5% Equity In Earnings of Unconsolidated Subsidiary 28.4 25.4 15.6 (38.4)% Non-Controlling Interest 0.4 (6.9) (19.4) NM Foreign Currency Gain (Loss) 56.4 47.3 (29.3) NM Gain on Acquisition/Sale 6.6 5.8 48.8 NM Loss of Extinguishment of Debt (9.8 (5.3) — NM Net Income attributable to AFSI $ 415.7 $ 457.6 $ 430.4 (6.0)% Dividends on Preferred Stock (12.7 (31.6) (47.8) NM Operating Earnings (1) $ 429.8 $ 469.5 $ 408.7 (12.9)% Operating Diluted EPS (1) $ 2.70 $ 2.79 $ 2.34 (16.0)% Operating ROE (1) 30.2 24.4% 17.8% Net Loss Ratio 66.5 66.8% 67.3% Net Expense Ratio 24.8 24.8% 26.4% Net Combined Ratio 91.3 91.6% 93.7% Summary Income Statement (1) Please see the Non-GAAP reconciliation footnote on slide 31 for important information about these Non-GAAP measures. |
 28 ($, millions, except per share amounts) Restated 2014 Restated 2015 2016 % Change Cash and Investments $ 5,648.1 $ 7,211.6 $ 9,235.7 28.1% Reinsurance Recoverable 2,440.7 3,007.4 4,329.5 44.0% Premiums Receivable, Net 1,892.0 2,236.0 2,802.2 25.3% Goodwill and Intangible Assets 667.7 800.0 1,243.1 55.4% Deferred Policy Acquisition Costs 629.3 693.6 928.9 33.9% Other Assets 2.581.0 3,317.5 4,075.3 22.8% Total Assets $ 13.858.8 $ 17,266.1 $ 22,614.7 31.0% Loss and LAE Reserve 5.664.2 7,208.4 10,140.7 40.7% Unearned Premiums 3.449.5 4,014.4 4,880.1 21.6% Debt 746.0 993.1 1,234.9 24.4% Reinsurance Payables, Accrued Expenses and Other Liabilities 1,927.1 2,148.7 2,892.0 34.6% Total Liabilities $ 11,786.8 $ 14,364.6 $ 19,147.7 33.3% Redeemable Non-Controlling Interest 0.6 1.2 1.4 15.9% AmTrust Financial Shareholders' Equity 1,912.2 2,723.8 3,269.1 20.0% Non-Controlling Interest 159.2 176.5 196.5 11.4% Total Shareholders' Equity $ 2,071.4 $ 2,900.2 $ 3,465.6 19.5% Total Liability and Shareholder's Equity $ 13,858.8 $ 17,266.1 $ 22,614.7 31.0% Book Value Per Share $ 10.37 $ 12.74 $ 13.81 8.4% Balance Statement Highlights |
 2016
Quarterly Financial Data 29
2016 ($, millions, except per share amounts) Restated Mar 31, Restated Jun 30, Restated Sept 30, Dec 31, FY2016 Earned Premium $ 1,074.3 $ 1,181.8 $ 1,196.2 $ 1,215.7 $ 4,668.0 Investment Income 49.4 50.7 59.9 48.0 208.0 Service and Fee Income 128.8 124.3 133.9 151.0 538.0 Total Revenue 1,260.5 1,371.9 1,398.2 1,419.8 5,450.5 Loss and LAE Expense 715.1 784.4 811.0 831.8 3,142.3 Acquisition Cost and Other Underwriting Expense 272.5 294.5 304.0 359.2 1,230.2 Other 129.3 134.3 139.3 161.2 564.1 Interest Expense 15.9 17.9 22.1 23.6 79.5 Provision for Income Taxes 19.0 23.8 23.2 19.4 85.3 Net Income 96.8 144.5 95.2 93.8 430.4 Income Attributable to Common Stockholders 84.0 127.2 80.6 71.4 363.1 Basic EPS $ 0.48 $ 0.74 $ 0.47 $ 0.41 $ 2.10 Diluted EPS $ 0.47 $ 0.73 $ 0.47 $ 0.41 $ 2.08 Note: The above is a summary of the unaudited quarterly results of operations. |
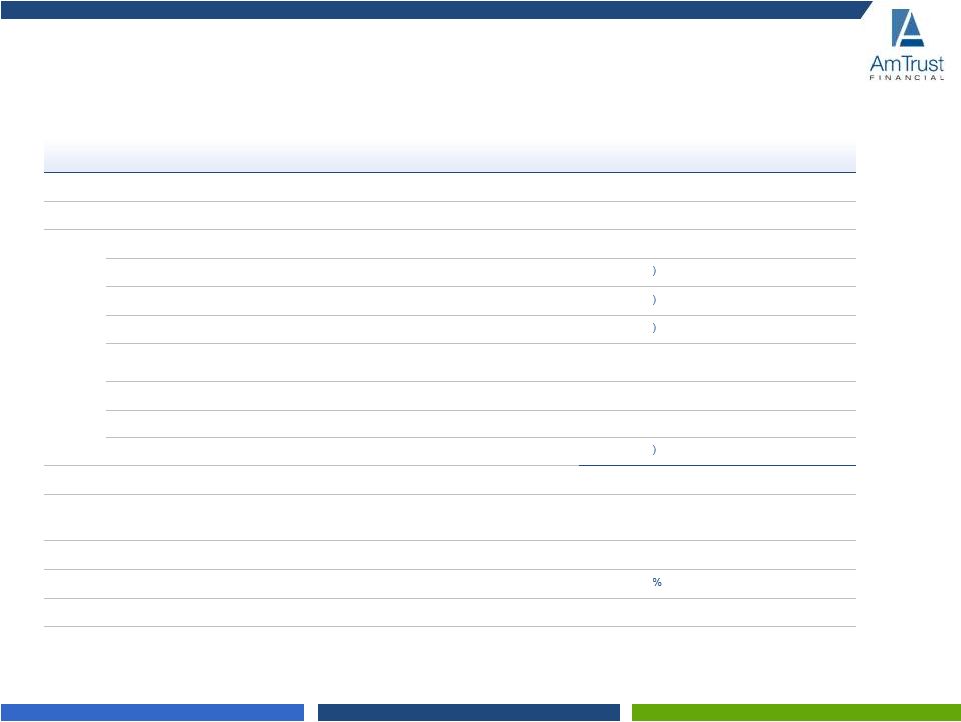 30 ($, millions, except per share amounts) Restated 2014 Restated 2015 2016 Net income to AFSI common stockholders $ 401.8 $ 418.8 $ 363.1 Less Realized gain on securities 16.4 8.1 36.5 Foreign currency transaction gain/(loss) 56.4 47.3 (29.3 ) Non-cash interest on convertible senior notes (2.6 (6.0) (6.3) Loss on extinguishment of debt (9.8 (5.3) — Non-cash amortization of intangible assets (96.4 (101.8) (65.4) Gain resulting from decrease in ownership percentage of equity investment in unconsolidated subsidiary (related party) 14.7 9.3 — Acquisition gain — 5.8 48.8 Gain on Sale 6.6 — — Tax effect of adjustments reflected above (2) (13.2 (8.1) (29.8) Net operating earnings attributable to AmTrust common share (1) $ 429.8 $ 469.5 $ 408.7 Operating diluted earnings per share (1) $ 2.70 $ 2.79 $ 2.34 Average common shares outstanding - diluted 159.0 168.4 174.5 Operating ROE (1) 30.2 24.4% 17.8% Average equity 1,424.9 1,926.7 2,298.3 Non-GAAP Reconciliation (1) Please see the Non-GAAP reconciliation footnote on slide 31 for important information about these Non-GAAP measures. (2) Please see the Non-GAAP reconciliation footnote on slide 31 for important information about these Non-GAAP measures.
|
 31 Non-GAAP Reconciliation Footnote (1) Operating earnings (“Operating Earnings”) is defined by the Company as net income attributable to AmTrust common
stockholders less realized gain (loss) on investments, non-cash amortization of
intangible assets, non-cash interest on convertible senior notes,
loss on extinguishment of debt, foreign currency transaction gain (loss), gain resulting from decrease in ownership percentage of equity investment in unconsolidated subsidiary (related party), acquisition gain, and
gain on sale, and should not be considered an alternative to net income. Operating
diluted earnings per share is defined by the Company as Operating
Earnings divided by the weighted average diluted shares outstanding for the period and should not be considered an alternative to diluted earnings per share. Operating return on common equity is defined by the
Company as Operating Earnings divided by the average common equity for the period and
should not be considered an alternative to return on common equity.
The Company believes Operating Earnings, operating diluted earnings per share and operating return on common equity are more relevant measures of the Company's profitability because Operating
Earnings, operating diluted earnings per share and operating return on common equity
contain the components of net income upon which the Company's management
has the most influence and excludes factors outside management's direct
control and non-recurring items. The Company's measure of Operating Earnings, operating diluted earnings per share and operating return on common equity, may not be comparable to similarly titled measures used by other
companies. (2) The Company calculated the income tax effect of certain adjustments using the U.S. federal statutory income tax rate
of 35%. Specifically, gross realized gain on investments is predominantly U.S. sourced
and, therefore, is subject to tax at 35%. In addition, the gain resulting
from a decrease in ownership percentage of equity investment in unconsolidated subsidiary (related party) is U.S. sourced income subject to tax at 35%. Gain on sale is U.S. sourced income subject to tax
at 35%. Acquisition gain is both U.S. and foreign sourced gain that is ultimately
subject to tax at 35%. The Company does not report non-cash
amortization of intangible assets, non-cash impairment of goodwill, non-cash interest on convertible senior notes, loss on extinguishment of debt, or foreign currency transaction gain/(loss) net of tax. |