Attached files
| file | filename |
|---|---|
| 8-K - 8-K - NACCO INDUSTRIES INC | d269493d8k.htm |
 2016 Investor Presentation Exhibit 99 |
 Safe Harbor Statement & Disclosure 2 This presentation includes forward-looking comments subject to important risks and uncertainties. It may also contain financial measures that are not in conformance with accounting principles generally accepted in the United States of America (GAAP). Refer to NACCO’s reports filed on Forms 8-K (current), 10-Q (quarterly), and 10-K (annual) for information on factors that could cause actual results to differ materially from information in this presentation and for information reconciling financial measures to GAAP. Past performance may not be representative of future results. Guidance noted in the following slides was effective as of the company’s most recent earnings release and conference call (March 2, 2017). Nothing in this presentation should be construed as reaffirming or disaffirming such guidance. This presentation is not an offer to sell or a solicitation of offers to buy any of NACCO’s securities. |
 3 NACCO Industries Overview |
 NACCO Industries at a Glance NACCO Industries, Inc. (NYSE: NC) Operating holding company with subsidiaries in the mining, small appliances and specialty retail industries Headquartered in Cleveland, Ohio Approximately 3,600 employees globally 4 NACCO’s strategy is to increase shareholder value by implementing strategic
initiatives designed to achieve long-term profit growth
_____________________
(1) Adjusted Income is a measure of income that differs from Net Income measured in accordance with GAAP. Adjusted Income is adjusted
to exclude Centennial Natural Resources (“Centennial”) which ceased mining operations in December 2015. Management believes that Adjusted Income assists the investor in understanding the results of operations of NACCO Industries, Inc. and North American
Coal throughout this document and aids in understanding comparability of results. In addition, management evaluates results using this non- GAAP financial measure. (2) Adjusted Income, Adjusted EBITDA and Cash Flow before financing are non-GAAP measures and should not be considered in
isolation or as a substitute for GAAP measures. The discussion of non-GAAP items and the related reconciliations to GAAP measures start on page 48. 2016 full year highlights: Revenue – $856.4 million Net income – $29.6 million Adjusted Income – $46.8 million (1)(2) Cash flow before financing – $84.1 million (2) Adjusted EBITDA – $76.7 million (2) Net debt – $54.1 million |
 NACCO Industries Overview 5 Headquartered in Dallas, Texas 2016 full year highlights: Revenue – $111.1 million Net income – $8.2 million Adjusted Income – $25.4 million (1) Cash flow before financing – $31.0 million (1) Adjusted EBITDA – $34.3 million (1) Employees – 2,000 (2) Headquartered in Richmond, Virginia 2016 full year highlights: Revenue – $605.2 million Net income – $26.6 million Cash flow before financing – $53.9 million (1) EBITDA – $46.9 million (1) Employees – 600 Headquartered in Chillicothe, Ohio 2016 full year highlights: Revenue – $144.4 million Net loss – $0.4 million Cash flow before financing – $2.7 million (1) EBITDA – $1.9 million (1) Employees – 1,000 _____________________ (1) Adjusted Income, Adjusted EBITDA and Cash Flow before financing are non-GAAP measures and should not be considered in
isolation or as a substitute for GAAP measures. The discussion of non-GAAP items and the related reconciliations to GAAP measures start on page 48. (2) Includes employees of the unconsolidated mines |
 NACCO Industries Overview (continued) 6 NACCO has significant strengths in its principal businesses: – Strong collective earnings and cash flow generation capability – Cash flow sustainability and low earnings volatility – Significant management expertise in operating each business across a range of economic
conditions
–
Substantial overall cash generation to support growth strategies and
objectives and cash returns to stockholders
|
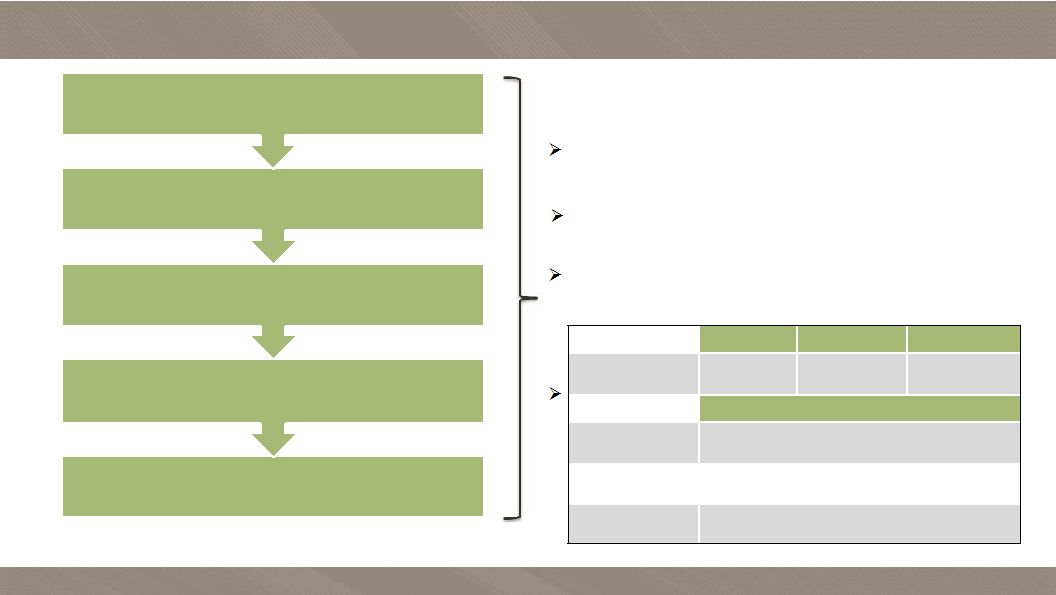 NACCO’s Priorities for Use of Cash Return Cash to Stockholders Prudent Investments in Complementary Ventures Investments in Individual Subsidiary Strategic Initiatives Reduction of Debt Investments in Core Subsidiary Businesses Support strategic initiatives to accelerate growth or enhance margins
Pursue complementary growth opportunities that play to Company
strengths
2014 2015 2016 Annual Dividends $7.8m $1.0225/share $7.3m $1.045/share $7.3m $1.065/share Stock Repurchase Programs (2011 to 2016) 2011 Program $35.6 million – repurchased approximately 624,000 shares of Class A Common Stock 2013 Program $60.0 million – repurchased approximately 1,122,900 shares of Class A Common Stock 2016 Program (1) $6.0 million – repurchased approximately 109,300 shares of Class A Common Stock (1) The 2016 Stock Repurchase Program provides for the purchase of up to $50 million of the Company’s Class A Common Stock
outstanding through December 31, 2017. 7
Ensure subsidiaries are appropriately leveraged
|
 Experienced Management Team 8 Alfred M. Rankin Jr. Chairman, President and Chief Executive Officer of NACCO Chairman, President and CEO of NACCO Industries since 1994 Former Vice Chairman, Chief Operating Officer and Director of Eaton Corporation President and Chief Executive Officer – NACoal since 2015 Joined NACCO in 1995 J.C. Butler, Jr. SVP – Finance, Treasurer and Chief Administrative Officer of NACCO VP, General Counsel and Secretary of NACoal Joined NACCO in 2009 Former Jones Day attorney John Neumann VP, General Counsel and Secretary of NACCO Robert O. Strenski President of Kitchen Collection Elizabeth Loveman VP and Controller Previously Director of Financial Reporting for NACCO Joined NACCO in 2012 Gregory Trepp President and CEO of Hamilton Beach Brands CEO of Kitchen Collection President and CEO of Hamilton Beach Brands since 2010 Previously VP of Global Marketing Joined Hamilton Beach Brands in 1996 President of Kitchen Collection since 2015 Previously General Merchandising Manager of Kitchen Collection since 2013 J.C. Butler, Jr. President and Chief Executive Officer- The North American Coal Corporation Previously SVP- Project Development, Administration and Mississippi Operations |
 The History of NACCO Industries, Inc. and Subsidiaries 9 1913 Cleveland & Western Coal Company is founded 1925 Name changed to The North American Coal Corporation (NACoal) 1956 NACoal stock begins publicly trading over-the-counter 1961 NACoal is listed on NYSE 1985 NACoal buys controlling interest in Yale Materials Handling from Eaton Corporation 1986 NACCO Industries, Inc. is formed as a new public holding company 1988 NACCO purchases Proctor Silex, along with Kitchen Collection chain of company outlet stores
1989 NACCO acquires Hyster Company and, together with Yale, forms NACCO Materials Handling Group 1990 NACCO acquires controlling interest of Hamilton Beach, Inc. and merges with Proctor
Silex 2012 NACCO spins off its materials handling business as Hyster-Yale Materials Handling (NYSE:HY) |
 North American Coal Overview 10 |
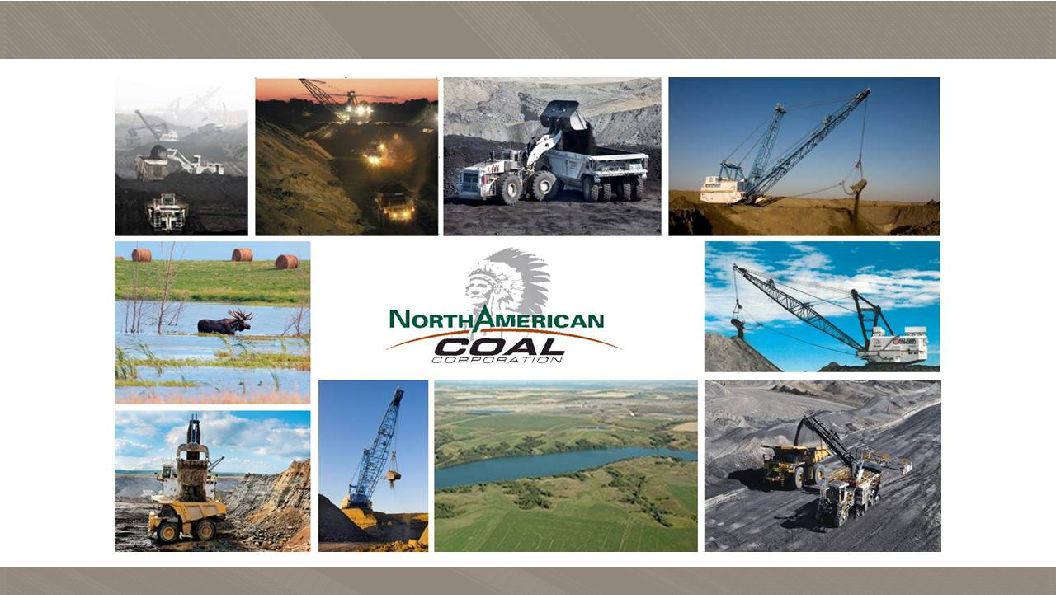
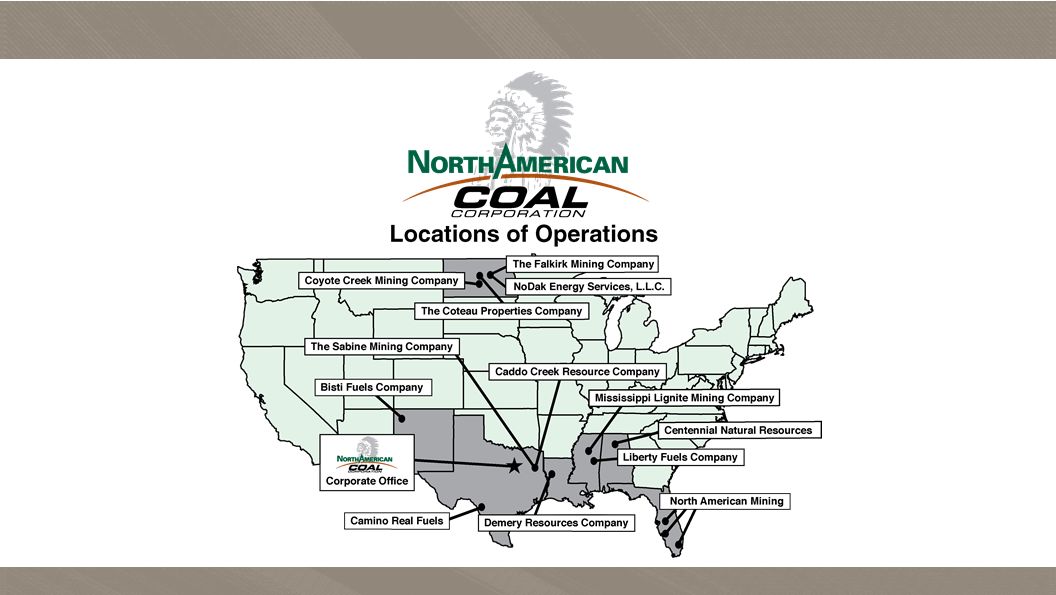
 North American Coal (“NACoal”) Overview Mines coal primarily for use in power generation and provides value-added services for natural resource companies
Mines located in North Dakota, Texas, Mississippi, Louisiana and within
the Navajo Nation in New Mexico One of the largest
producers of lignite coal in the U.S. and among the ten largest coal producers in the U.S. 1.9 billion tons of lignite coal reserves with 1.0 billion tons committed to current customers
Provides value-added services:
Maintains and operates draglines for independently owned
limerock quarries through its North American Mining
division •
Largest producer of limerock
in Florida
Provides ash-hauling services for power plants and other facilities
Provides coal-handling, processing and drying
services Excellent record of employee safety and
environmental responsibility Unique business model with
largely long-term, cost-plus contracts structured to eliminate exposure to market fluctuations of coal prices Provides steady income and cash flow with minimal capital investment Power plants served are generally well positioned to compete within current environmental regulations
11 |
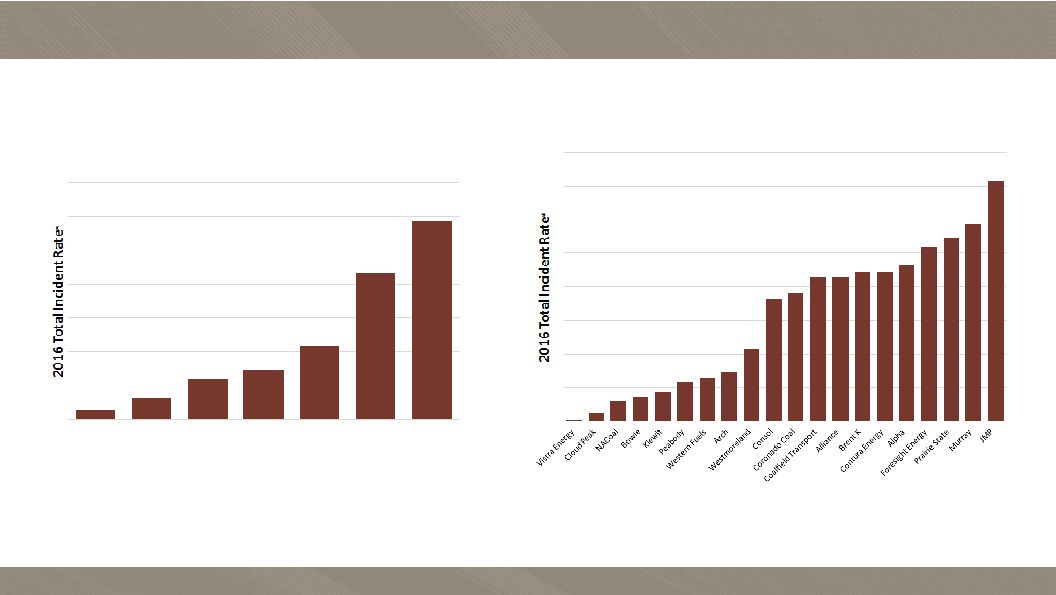 NACoal’s Excellent Safety Record 12 2016 NMA Top 20 Coal Producers Ranked by Incident Rate *OSHA Incident Rate = Total number of injuries and illnesses multiplied by 200,000 divided by number of hours worked by all
employees. The math described can lead to incident rates
below one 2016 National Mining Association (“NMA”)
Top 7 Coal Producers Ranked by Incident
Rate 0.25 0.62 1.18 1.46 2.17 4.31 5.87 Cloud Peak NACoal Peabody Arch Westmoreland Alliance Murray 0.05 0.25 0.62 0.72 0.87 1.18 1.29 2.17 3.64 3.8 4.3 4.31 4.42 4.42 4.64 5.18 5.47 5.87 7.15 1.46 |
 Environmental Responsibility 13 North American Coal has received 80 federal and state awards for
successful and innovative reclamation projects over the last 30
years |
 NACoal Operations 14 |
 Unconsolidated Mines 15 NACoal’s unconsolidated mines operate under long-term cost-plus contracts with
their customers
• Customer pays 100% of cost of operating the mine • Customer provides, or provides support for, all of the capital required – minimal or no NACoal investment • NACoal is paid a modest agreed profit per ton of coal or heating unit (btu) delivered
Each cost-plus contract specifies the indices and mechanics by
which agreed profits change over time, generally in line
with broad measures of U.S. inflation •
Contracts eliminate exposure to spot coal market price
fluctuations These mines produce strong cash flow with minimal
capital requirements |
 Unconsolidated Mines (continued) • Long-term contracts expiring 2018 – 2055 • Pre-tax profits generated from these mines shown separately in the Company’s income
statement as “earnings from unconsolidated
mines” •
Mine-Mouth
operations
–
All of the mines’ production goes to customer power plants or coal processing facilities • 29.5 million tons sold in 2016; up 9.3% from 2015 Full year of deliveries at Camino Real and commencement of production at Coyote Creek in May 2016
16 |
 Consolidated Mine – Mississippi Lignite Mining Company Mississippi Lignite Mining Company’s Red Hills Mine supplies coal under a long-term
contract that extends through 2032
o Delivered 3.0 million tons in 2016 o Coal produced is sold for use in its customer’s power plant, adjacent to mine
o Contractually agreed-upon price adjusts monthly primarily based on changes in the
level of established indices, which reflect general U.S. inflation
rates, including cost components such as labor and diesel
fuel Coal sales price is not subject to spot coal market
fluctuations o
NACoal
pays all operating costs and provides the capital for this
mine o
Periodic capital spending required to replace equipment & secure
land for future mining
17 |
 Value-Added Mining Services and Other Income Sources Maintains and operates draglines for extraction of limerock at independently owned limerock quarries – Customers pay all operating costs plus an agreed profit per cubic yard excavated or limerock
delivered
–
NACoal
employees operate equipment owned by the customers
–
26.1 million cubic yards delivered in 2016
Fee-based arrangement to operate a coal drying facility within a
power plant operated by a major coal
customer Ongoing royalty income from rights to coal, oil
and gas reserves –
Ohio, Pennsylvania, North Dakota, Texas, Alabama, Mississippi and
Louisiana 18
NACoal provides value-added mining services for natural resource companies |
 NACoal Outlook Unconsolidated Operations • January 1, 2017 - Bisti became the contract miner at the Navajo Mine within the Navajo Nation in New Mexico
Target production of ~5-6 million tons annually
• Tons delivered and income before tax expected to increase at unconsolidated operations as newer mines
increase production and Bisti
commences production
• Goal of pretax earnings growth at unconsolidated operations of approximately 50% from 2012 level of $45.2
million by 2020-2021, but timing will depend on future inflation
rates and customer demand •
Stable cash flows from long-term contracts
• Minimal capital investments required • Modest contribution from unconsolidated portion of North American Mining
Consolidated Operations
• Lower, more moderate loss at Centennial • Substantial decrease in Royalty & Other Income • Anticipated modest decline in customer requirements at consolidated portion of North American Mining
• Comparable results at MLMC in 2017 • Strong cash flows and modest capital investments 19 |
 NACoal Key Strategy Overview Using a disciplined approach, and using NACoal’s core cost-plus business model, pursue: Additional opportunities to serve as a contract miner in new or existing
coal mining operations
Opportunities in non-coal mining operations, such as aggregates or
other minerals
Opportunities to expand value-added services
20 Strategic initiatives for growth Seek a minimum return on capital employed of 13%, increase the profitability of all existing mining
operations & achieve income growth from development of new mining and
services ventures |
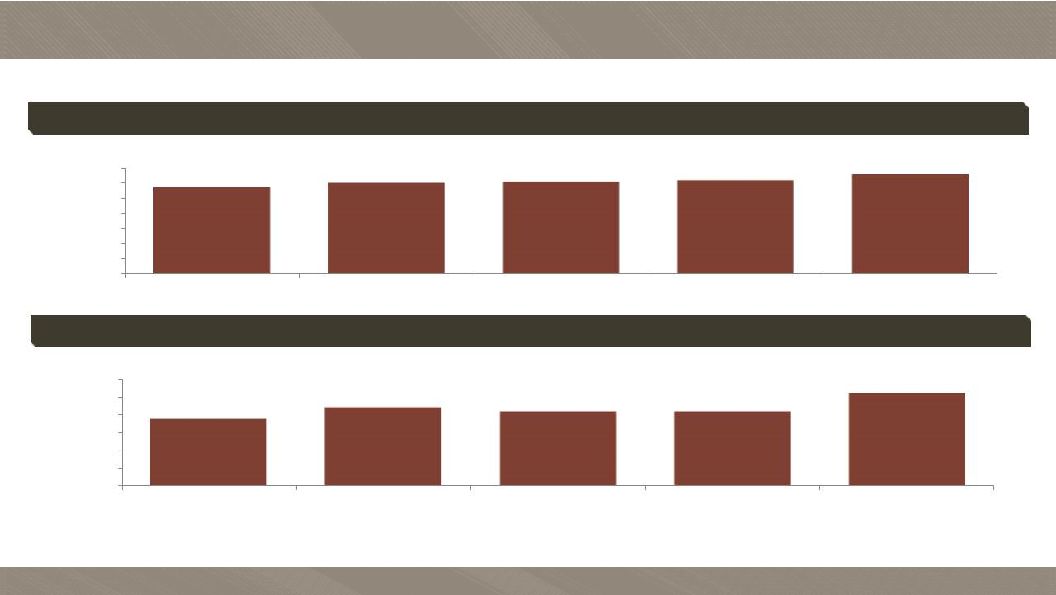 NACoal Operational Highlights 21 (millions of tons) 28.4 29.9 30.2 30.6 32.5 0.0 5.0 10.0 15.0 20.0 25.0 30.0 35.0 2012 2013 2014 2015 2016 Tons of Coal Sold Cubic Yards of Limerock Delivered 18.8 22.1 21.0 20.9 26.1 0.0 5.0 10.0 15.0 20.0 25.0 30.0 2012 2013 2014 2015 2016 (millions of cubic yards) |
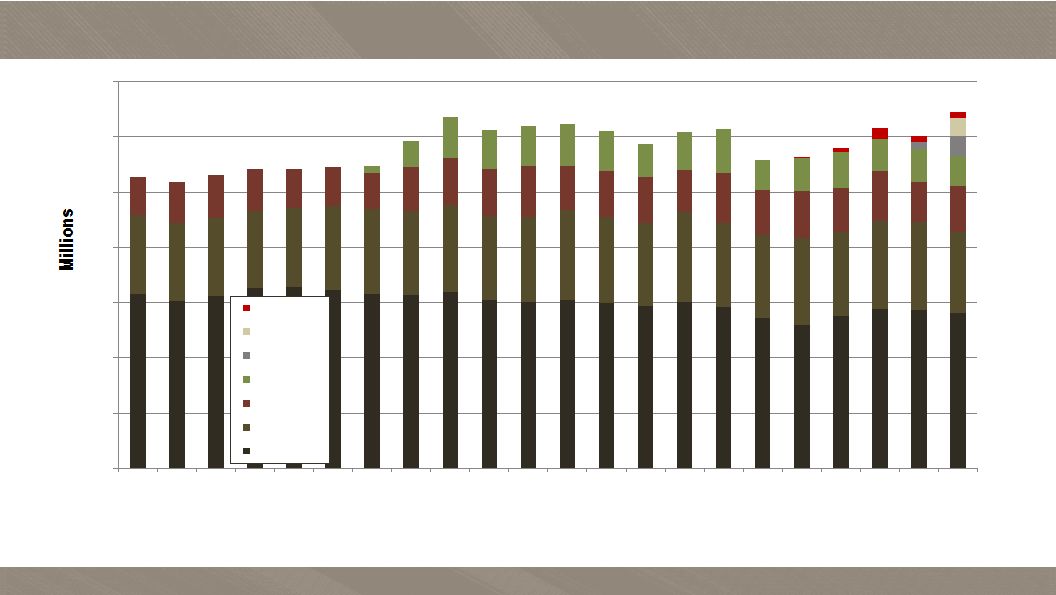 Annual Coal Production from Current Operations 1994 - 2016 22 0 5 10 15 20 25 30 35 1994 1995 1996 1998 1999 2000 2001 2002 2003 2004 2005 2006 2007 2008 2009 2010 2011 2012 2013 2014 2015 2016 Other Coyote Creek Camino Red Hills Sabine Falkirk Coteau Note: the annual coal production of legacy operations (Centennial, San Miguel and Red River) are not included in the chart of
annual coal production from current operations above. |
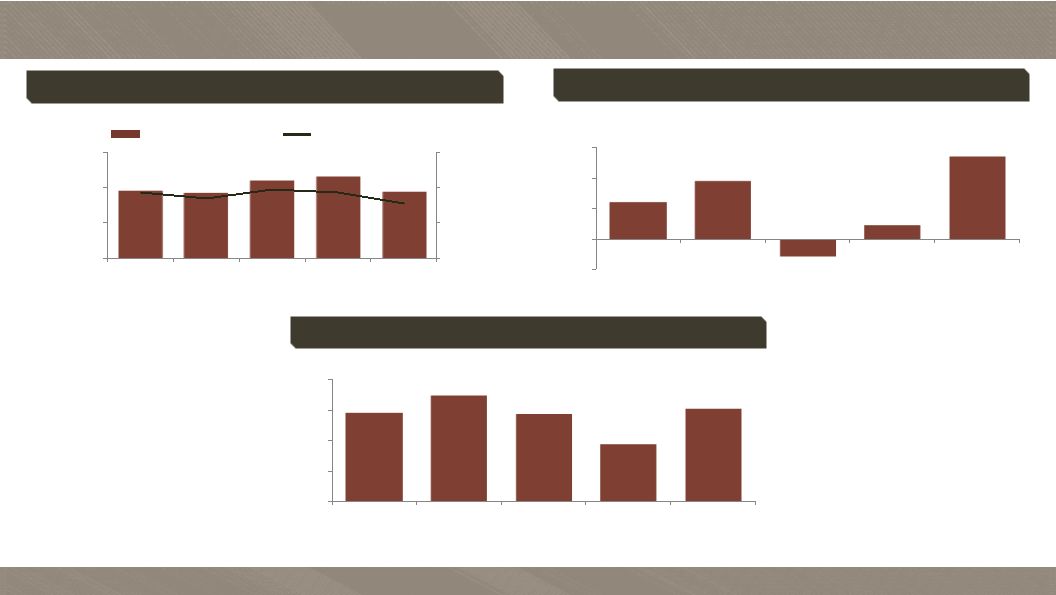
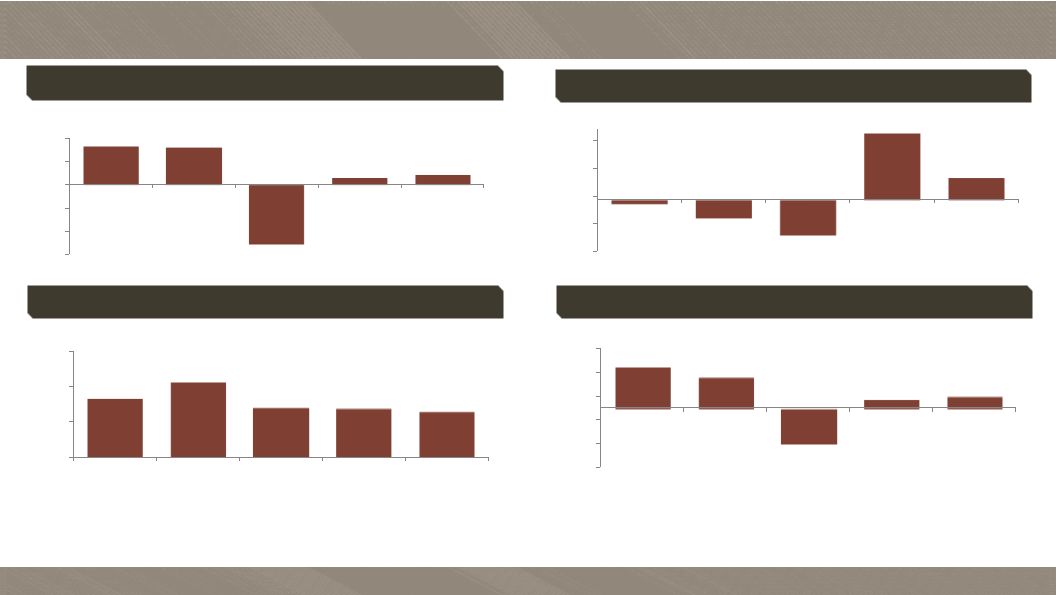 NACoal Financial Highlights 23 Return on Capital Employed (3) 17.3% 13.0% -14.9% 3.6% 5.2% -25% -15% -5% 5% 15% 25% 2012 2013 2014 2015 2016 Adjusted Income (2) $32.8 $42.2 $28.0 $27.3 $25.4 $0 $20 $40 $60 2012 2013 2014 2015 2016 Cash Flow Before Financing (3) ($6.1) ($26.7) ($50.2) $94.4 $31.0 -$75 -$35 $5 $45 $85 2012 2013 2014 2015 2016 ($ in millions) _____________________ (1) Net Income (Loss), Cash Flow Before Financing and Return on Capital Employed include non-cash impairment charges of $4.0 million, $105.1 million and $17.4 million in 2013, 2014 and 2016, respectively, related to NACoal’s Centennial mining operations which ceased active mining operations at the end of 2015. (2) Adjusted Income is a measure of income that differs from Net Income (Loss) measured in accordance with GAAP. Adjusted Income is
adjusted to exclude the results of Centennial. Management believes that Adjusted Income assists the investor in understanding the results of operations of North American Coal and aid in understanding comparability of results.
(3) Cash flow before financing activities and return on capital employed are non-GAAP measures and should not be considered in
isolation or as a substitute for GAAP measures.
Note: Management evaluates results using these non-GAAP
financial measures. The discussion of non-GAAP items and the related reconciliations to GAAP measures start on page 48. ($ in millions) Net Income (Loss) $32.8 $31.9 $(51.0) $5.6 $8.2 ($60) ($40) ($20) $0 $20 $40 2012 2013 2014 2015 2016 ($ in millions) (1) (1) (1) (1) (1) (1) (1) (1) (1) |
 Hamilton Beach Brands Overview 24 * Wolf Gourmet ® is a registered trademark of the Sub-Zero Group, Inc. ** CHI ® is a registered trademark of Farouk Systems, Inc. * ** |
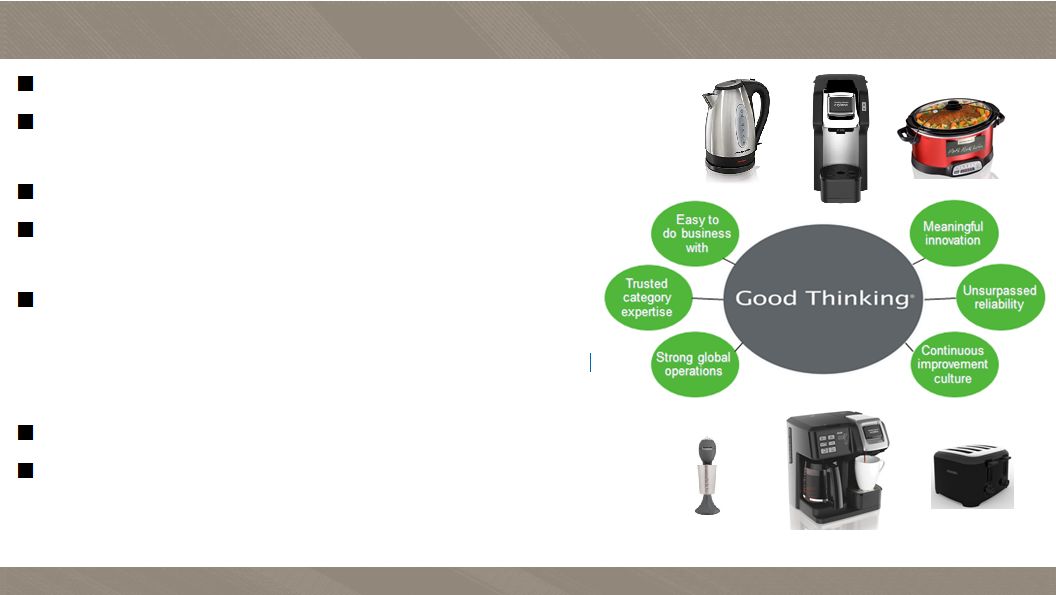 Strong heritage brands with leading market shares Strong relationships with leading retailers and customers across diverse channels Focused emphasis on the quality of products Successful track record of product line expansion and new product innovation…we call that Good Thinking ® Broad consumer price point segmentation coverage from Good to Better to Best, with increased focus on Only-the-Best, including Wolf Gourmet ® , Weston ® , CHI ® and Hamilton Beach ® Professional Highly professional and experienced management team Industry-leading working capital management and strong returns on invested capital Hamilton Beach Brands (“HBB”) Overview 25 Note - All product names, logos, and brands are property of their respective owners. Any third party company, product and service names
used in this presentation are for identification purposes
only. Use of these names, logos, and brands does not imply endorsement. |
 HBB Business Highlights Leading designer, marketer and distributor of: – Small electric household and specialty housewares appliances – Commercial products for restaurants, bars and hotels HBB has a leading retail market share position in North America – Hamilton Beach ® brand ranked #1 small kitchen appliance brand in the U.S. (units sold)
–
Strong share in Canada, Mexico & Central America
Powerful heritage brands including Hamilton Beach and Proctor
Silex HBB has been a critical part of life in America for
over 100 years Newer brands, including
Weston ®
and Hamilton
Beach
®
Professional,
focused on fast-growing
food trends
Hamilton Beach Commercial and Proctor Silex
Commercial have a reputation for durable, quality
performance in the demanding commercial products industry and are
expanding globally Wolf Gourmet
®
(licensed), a premier brand in large appliances, is available in small
appliances, cookware and cutlery
CHI ® (licensed), a proven global leader in the fashion industry, is HBB’s newest brand. A CHI ® garment care line will now be available through HBB’s brand portfolio
26 |
 HBB Business Highlights (continued) Broad product assortment distributed through mass merchants, national department stores, ecommerce, wholesale distributors and other retail outlets HBB is investing shareholder resources that will generate a strong return for years to come • Focused on the long term…think and act strategically… • Stockholder focused • Invest to ensure we have a meaningful “reason for being”
• Deliver consistent profits and strong return on capital invested 27 |
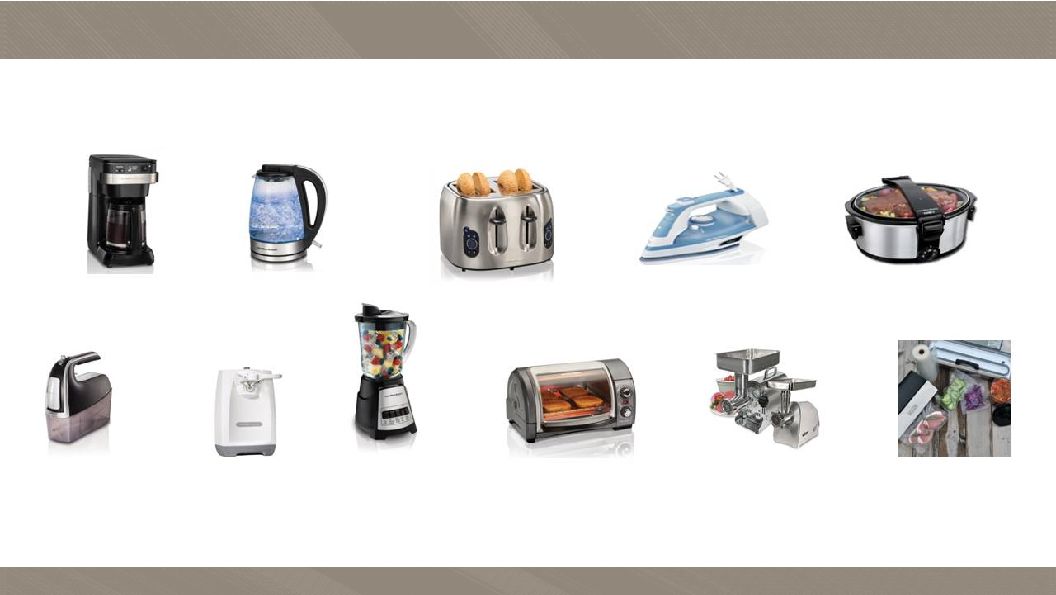 Broad Product Offering 28 Coffeemakers Slow Cookers Irons Hand Mixers Blenders Toaster Ovens Can Openers Comprehensive offering of high-quality consumer housewares Toasters Kettles Meat Grinders Bag Sealers |
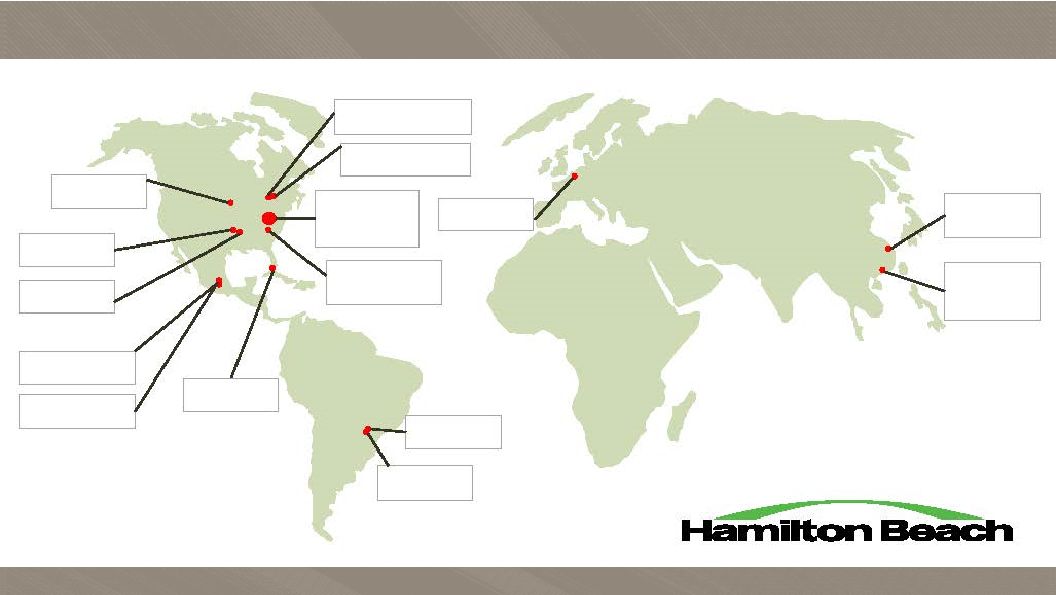 29 Sao Paulo, Brazil Sales & Marketin g Picton, Ontario, Canada Distribution Center Richmond, VA Headquarters Sales & Marketing Engineering Southern Pines, NC Customer Call Center and Refurbishment Center Olive Branch, MS Distribution Center Bentonville, AR Sales Tultitlan, Mexico Distribution Center Minneapolis, MN Sales Miami, Florida Sales Jundiai, Brazil Distribution Center Markham, Ontario, Canada Sales & Marketin g HBB Global Footprint Geel, Belgium Distribution Center Shenzhen, China Administration, Engineering & Distribution Center Shanghai, China Sales , Engineering, Distribution Center Mexico City, Mexico Sales & Marketin g |
 Core Business Deliverables Achieve organizational excellence – Attract and retain passionate talent to deliver Good Thinking ® core competency Pursue market and product development excellence – Lead with product innovation focused on Good Thinking ® – Invest in deep understanding of consumer and customer needs – Leverage marketing and engineering sales expertise worldwide to develop innovative solutions Achieve the highest quality and performance standards – Ensure operational excellence while delivering high-quality
products
–
Maintain a strong, professional engineering and quality-control
staff
30 Ensure best-in-class sourcing and logistics – Continually reduce supply chain costs and optimize supply chain to ensure a sustainable competitive advantage Enhance long-term partnerships with customers and suppliers – Deliver best-in-class products, brands and support systems
to increase customer presence
–
Maintain industry-leading, professional sales and business
development capabilities
Build brand equity of current brands and
selectively add new brands
–
Strengthen brands through advertising, marketing, and
public relations |
 HBB Strategic Initiatives Enhance placements in the North American consumer business – Provide consumer-driven innovative products and strong sales and
marketing support
–
Incremental placements in core business drives scale and drives
incremental profits
Achieve a leadership position in ecommerce
–
Provide best-in-class retailer support and increased consumer
content and engagement
Expand placements in the “only-the-best”, high-end
market with strong brands and broad product
lines –
Robust roadmap of additional product introductions from Wolf
Gourmet
®
scheduled over coming years, through multi-year
agreement with Sub-Zero Group, Inc.
–
Expansion
of Hamilton Beach ® Professional and Weston ® brand product lines – Introduction of CHI ® -branded garment care line, through multi-year licensing deal with Farouk Systems, Inc. 31 Achieve $750 million in sales and a minimum operating profit margin of 10%
The following strategic initiatives have been put in place to achieve
HBB’s financial objectives: Expand internationally in
the emerging Asia and Latin America markets and continue to
expand in Canada and Mexico
–
Understand local consumers’ needs and increase product offerings
designed specifically for those needs
–
Increase international sales to 35 to 45 percent of total sales by
concentrating
on key market s Achieve further penetration of the global commercial market through enhanced global product lines – Strengthen food service and hospitality offerings for further market
penetration
–
Build distribution capabilities and resources in the international food
service market
Leverage brands, sourcing, distribution and
ecommerce expertise to achieve category and
channel expansion |
 HBB International Opportunity Continue to expand established positions in Mexico, Canada, Central America and South America Actively target fast growing China, Brazil and other markets – Some of the fastest growing small kitchen appliance markets globally
–
Use an appropriate mix of brands, products, features and price points
to build business with key retailers and commercial
customers –
Invest in developing solutions tailored to local consumer tastes and
needs
–
Increase resources allocated to these markets
–
Work with local partners in certain target countries
Purse other markets by selectively leveraging primarily the
Hamilton Beach
®
and Wolf Gourmet
®
Brands.
32 Planned Sales Mix Evolution U.S. 80% International 20% U.S. 55% International 45% 2 0 1 6 G O A L Goal is to shift international sales mix from approximately 20% to 35%-45% |
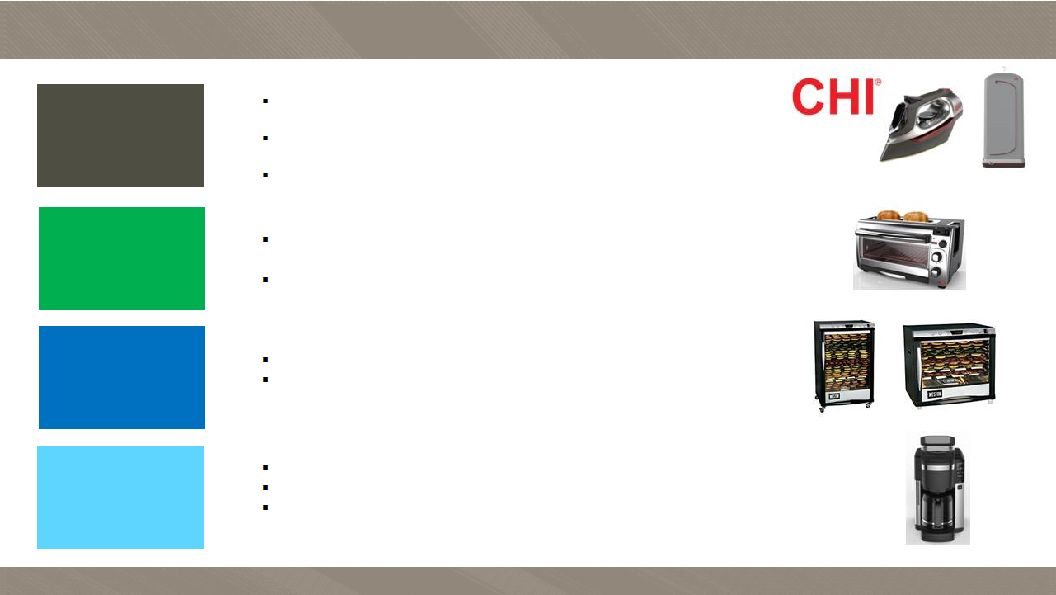 Recent Product Launches Support Market Share Gains 33 xxx Premium garment care products designed and branded to appeal to consumers
interested in a contemporary design and brand
Includes
a full line of irons, all with a titanium infused ceramic soleplate and high steam rates Includes the Easy Steam steamer bag that easily removes wrinkles in minutes
Perfect for homes that want to use a toaster oven but want better
toasting performance
Saves counter space by combining two appliances into one
Weston
®
products enable consumers to reconnect with real food
The Weston 80 liter and 160 liter dehydrators enable large batches for
heavy users of garden and game dehydrating
sessions Hamilton
Beach
®
coffee
maker
with automatic grounds dispensing Coffee storage keeps up to 12oz. of ground coffee fresh and ready to dispense
Automatically dispenses number of scoops of coffee into brew basket
based on desired number of cups
Hamilton Beach
® Coffee Maker with Grounds Dispenser Weston ® Pro Series Dehydrators Hamilton Beach ® 2-in-1 Toaster and Oven CHI ® Garment Care Line |
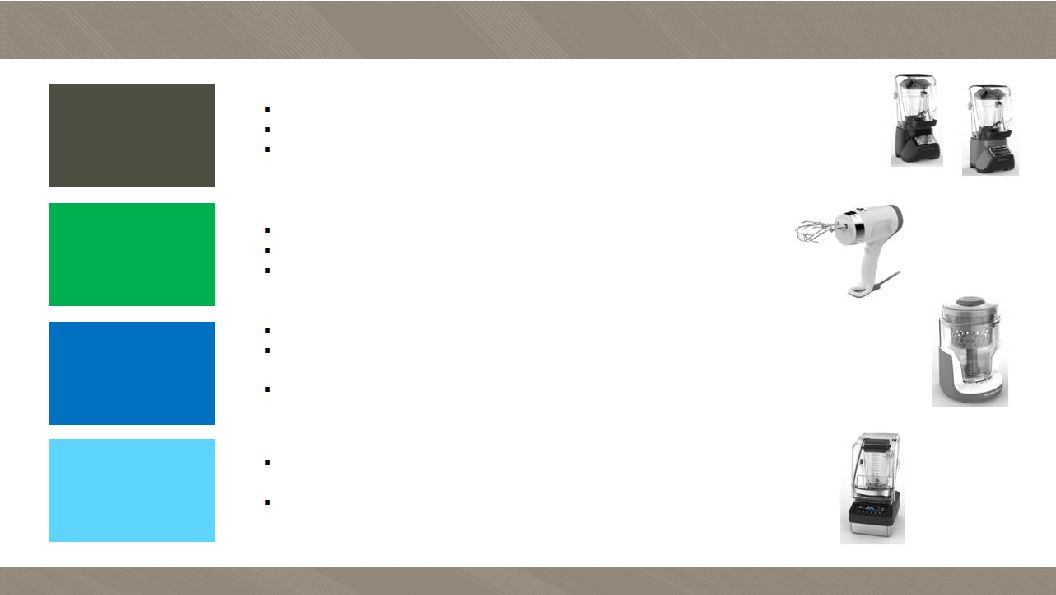 Recent Product Launches Support Market Share Gains (continued) 34 xxx Engineered to reduce noise throughout the base and jar Quiet shield adds additional noise reduction Great for making smoothies or drinks without the noise levels that traditional
blenders create
Lightweight, ergonomic design helps prevent arm and hand
fatigue Includes a DC motor so mixer runs quieter
Provides a slower first setting to prevent splatter and
mess Smart
Chop TM attachment prevents over-processing food Once chopped to the right size, food passes through attachment and drops into
the lower bowl where it will not be further processed
Perfect for nuts, garlic, onions, celery and more
Engineered to include brushless DC motor to deliver significantly
improved durability and noise reduction
Motor holds higher RPM under load which results in improved blending
through thick ingredients and faster blend
times Hamilton Beach
® Smart Chop 3 cup Chopper Hamilton Beach ® Ergonomic Hand Mixer Hamilton Beach ® Quiet Blenders Hamilton Beach ® Commercial Quantum Blender TM |
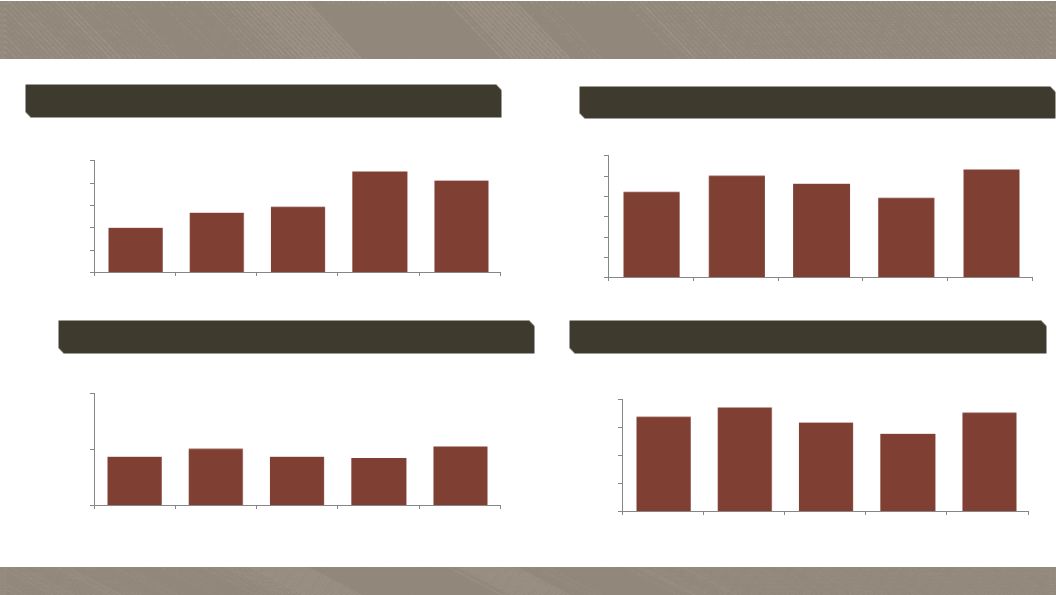 HBB Financial Highlights 35 Operating Profit Margin Revenue ($ in millions) ($ in millions) Net Income $21.2 $25.1 $23.1 $19.7 $26.6 $0 $5 $10 $15 $20 $25 $30 2012 2013 2014 2015 2016 ($ in millions) $35.8 $41.0 $35.8 $34.8 $43.0 $0 $40 $80 2012 2013 2014 2015 2016 Operating Profit 6.9% 7.5% 6.4% 5.6% 7.1% 0% 2% 4% 6% 8% 2012 2013 2014 2015 2016 ($ in millions) $521.6 $547.8 $559.7 $621.0 $605.2 $440 $480 $520 $560 $600 $640 2012 2013 2014 2015 2016 |
 HBB Financial Highlights (continued) 36 Net Working Capital (1) Cash Flow Before Financing (1) $24.2 $38.5 ($10.9) $9.2 $53.9 -$20 $0 $20 $40 $60 2012 2013 2014 2015 2016 $96.9 $93.5 $110.2 $116.8 $95.1 0% 10% 20% 30% $0 $50 $100 $150 2012 2013 2014 2015 2016 Net Working Capital % Revenue ($ in millions) ($ in millions) Return On Capital Employed (1) 29.3% 34.9% 28.7% 19.1% 30.5% 0% 10% 20% 30% 40% 2012 2013 2014 2015 2016 ($ in millions) _____________________ (1) Net working capital, cash flow before financing and return on capital employed are non-GAAP measures and should not be
considered in isolation or as a substitute for GAAP measures. For the discussion of non-GAAP items and the related reconciliations to GAAP measures, see pages starting on 48. |
 Kitchen Collection Overview 37 |
 Kitchen Collection (“KC”) Overview A leading specialty retailer of kitchen and related products in outlet malls throughout the U.S. Highly analytical merchandising skills and disciplined operating controls Strong core Kitchen Collection ® store portfolio in outlet malls 223 stores throughout the U.S. at December 31, 2016 38 |
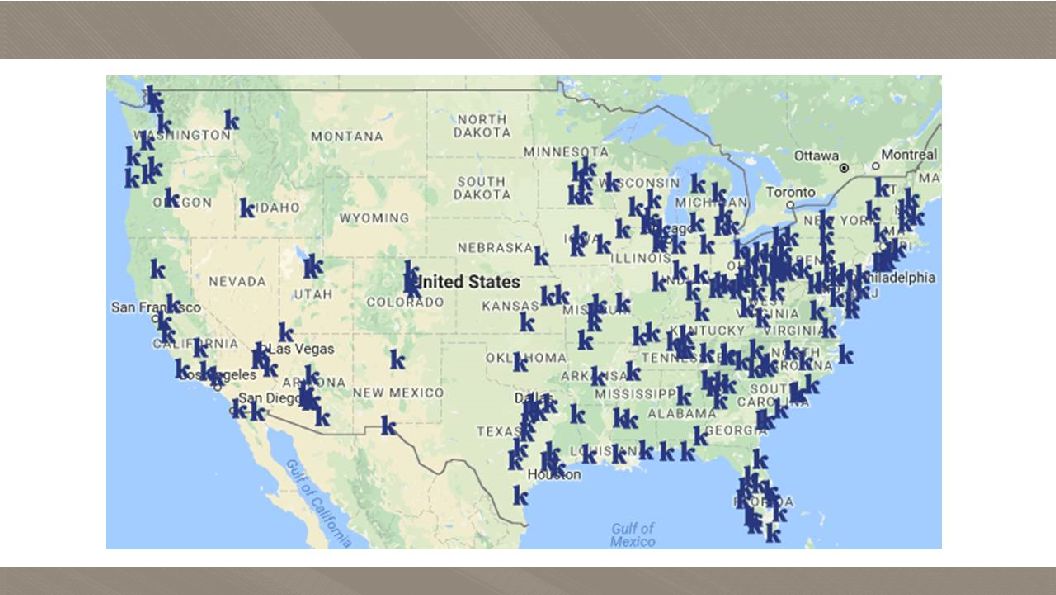 Kitchen Collection Locations 39 |
 Meet the challenge of a difficult environment and evolve aggressively in a
constructive manner, focusing on the outlet mall segment
Focus on comparable store sales growth through:
o Enhancing customers’ store experience through improved customer
interactions to generate greater average sale transaction
size o
Working to enhance sales volume and profitability by improving closure
rates through continued refinement of product offerings,
merchandise mix and store displays and appearances
Optimize store portfolio with Kitchen
Collection ®
stores in strong outlet malls in well-
positioned locations and exit stores that do not generate acceptable
return Continue focus on gross margin, profit and cash
flow improvement areas o
Emphasis on increasing sales of higher-margin products
o Maintain inventory efficiency and store inventory controls o Ongoing merchandising improvement through use of highly analytical
merchandising skills and disciplined operating controls
KC Key Strategy Overview
40 Achieve a minimum operating profit margin target of 5% |
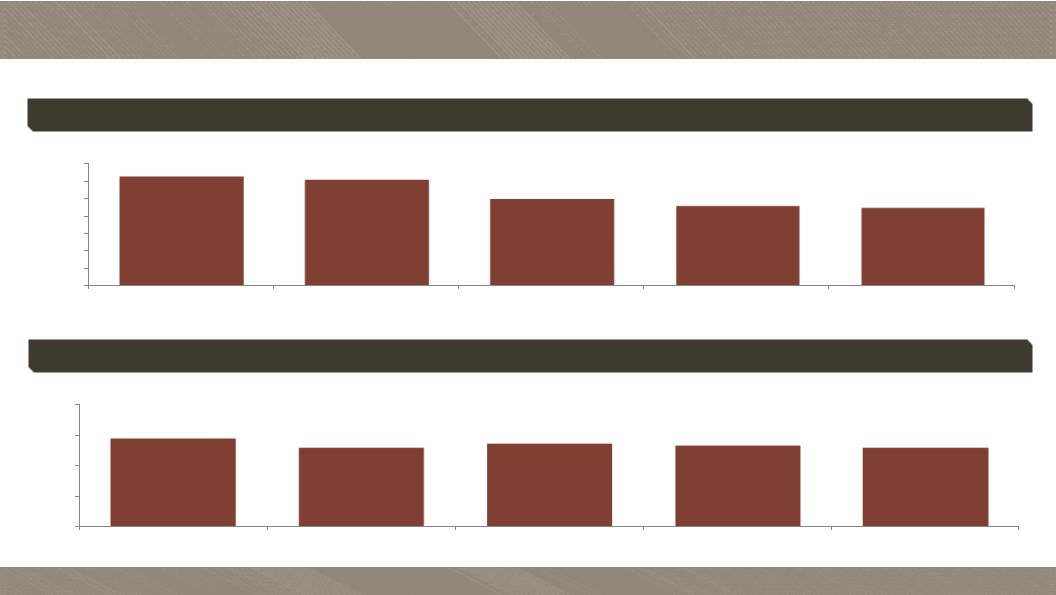 KC Operational Highlights 41 Sales Per Store Store Count ($ in thousands) 312 304 248 229 223 0 50 100 150 200 250 300 350 2012 2013 2014 2015 2016 $720.2 $644.7 $679.4 $659.4 $647.5 $0 $250 $500 $750 $1,000 2012 2013 2014 2015 2016 |
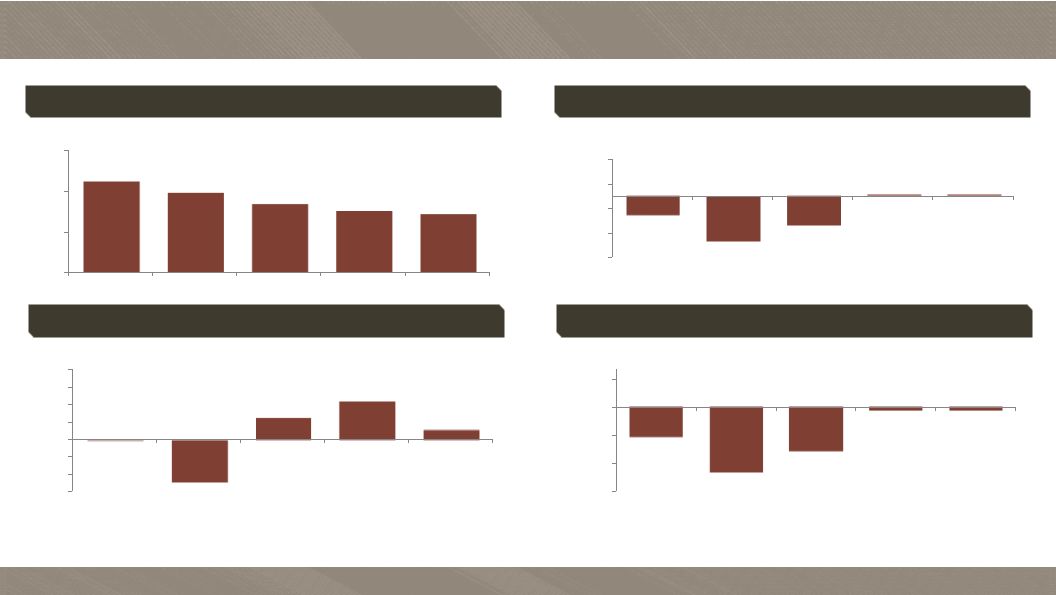 _____________________ (1) 2012, 2013 and 2014 include asset impairment charges of $0.7 million, $1.1 million and $0.9 million, respectively, without which
the operating loss would have been $(3.8) million, $(9.8) million and $(6.2) million, respectively. (2) Cash flow before financing activities is a non-GAAP measure and should not be considered in isolation or as a substitute for
GAAP measures. The discussion of non-GAAP items and the related reconciliations to GAAP measures start on page 48. KC Financial Highlights 42 Operating Profit (Loss) Revenue Net Income (Loss) $224.7 $196.0 $168.5 $151.0 $144.4 $0 $100 $200 $300 2012 2013 2014 2015 2016 ($ in millions) ($4.5) ($10.9) ($7.1) $0.2 $0.4 ($15) ($9) ($3) $3 $9 2012 2013 2014 2015 2016 (1) ($ in millions) ($ in millions) ($3.1) ($6.9) ($4.6) ($0.4) ($0.4) ($9) ($6) ($3) $0 $3 2012 2013 2014 2015 2016 Cash Flow Before Financing (2) ($0.1) ($12.2) $6.3 $10.8 $2.7 ($15) ($10) ($5) $0 $5 $10 $15 $20 2012 2013 2014 2015 2016 ($ in millions) (1) (1) |
 43 NACCO Industries Financial Update |
 2016 Highlights and Outlook 2016 Results NACoal Outlook NACoal performed as expected in 2016. While revenues decreased due to the cessation of coal production at Centennial, net income improved
HBB’s net income increased substantially in 2016 despite a
decrease in revenues primarily due to a shift in sales
mix to higher-price and higher- margin products
and lower costs KC held its small net loss on reduced
revenues due to comparable store sales growth and the
closure of unprofitable stores Expected increase in tons
sold and income before income taxes in 2017 due to the
start of production at Bisti
Fuels and a new limerock
customer’s quarries, and
a full year of mining at Coyote Creek
Centennial loss is expected to moderate in 2017 as it
manages ongoing mine reclamation obligations
Long term
Seeks to maintain or improve the profitability of all
existing mining operations and achieve income growth
from development of new mining and services ventures
($ in thousands)
HBB Outlook
KC Outlook
Expected modest increase in near-term net income as a
result of increased distribution and execution of its
Strategic Initiatives
Long term
Well-positioned to continue its leadership position in the
small appliance industry
Targeting $750 million in sales and a minimum operating
profit margin of 10%
Revenues expected to decline modestly from 2016 as
KC continues to aggressively manage and reduce store
portfolio
2017 results expected to be comparable to 2016
Long term
Focus on smaller core group of profitable stores
Targeting a minimum operating profit margin of 5%
44 _____________________ (1) EBITDA is a non-GAAP measures and should not be considered in isolation or as a substitute for GAAP measures. The discussion
of non-GAAP items and the related reconciliations to GAAP measures start on page 48. 2016 Full Year As Reported % Revenue $856,438 100.0% Operating Profit $ 41,715 4.9 % Net Income $ 29,607 3.5 % Cash Flow from Operations $ 93,935 Adjusted EBITDA (1) $ 76,685 |
 Why Invest in NACCO? North American Coal has a unique coal business model: – Provides mining services primarily under long-term coal contracts which eliminate NACoal’s exposure to market fluctuations of coal prices, providing steady income and cash flow – Long-standing relationships with high-quality utility customers
–
Highly efficient mining capabilities provide customers with
low-cost fuel –
Diversification via multiple coal and limerock
operations and royalty income
Hamilton Beach Brands is a leading provider of a broad range of
consumer housewares: –
Leading retail market share positions in the small kitchen appliance
market in North America –
Strong heritage brands that resonate with consumers
–
Expansion into additional market segments with Wolf
Gourmet ®
and Weston
® brands – Extensive market access through strong relationships with leading retail customers across diverse channels
–
Economies of scale and industry-leading net working capital
management drive strong returns on invested capital
Kitchen Collection is a niche market retailer:
–
Focused on outlet mall footprint
–
Wide variety of high-quality and affordable products
–
Cash generator with minimal capital investment
NACCO represents a strong, multi-industry company with leading,
well-positioned businesses in mining, small appliances
and specialty retail
NACCO offers strong earnings and cash flow generation capability, with clear growth and profit improvement strategies and objectives across the businesses 45 |
 46 Appendix |
 Risk Factors 47 The risks and uncertainties with respect to each subsidiary’s operations as referenced on page
2 of this document include, without limitation:
North American Coal: (1) changes in tax laws or regulatory requirements, including changes in
mining or power plant emission regulations and health, safety or environmental legislation, (2) changes in costs related to geological conditions, repairs and maintenance, new equipment
and replacement parts, fuel or other similar items, (3)
regulatory actions, changes in mining permit requirements or delays in obtaining mining permits that could affect deliveries to customers, (4) weather conditions, extended power plant outages or other events that would change the level of customers' coal or
limerock requirements, (5) weather or equipment problems
that could affect deliveries to customers, (6) changes in the power industry that would affect demand for North American Coal's reserves, (7) changes in the costs to reclaim North American Coal mining areas, (8) costs to pursue and develop new mining
opportunities, (9) changes to or termination of a
long-term mining contract, or a customer default under a contract, (10) the timing and pricing of transactions to dispose of assets at the Centennial operations, (11) delays or reductions in coal deliveries at North American Coal's newer mines, and (12)
increased competition, including consolidation within the
industry. Hamilton Beach: (1) changes in the sales prices, product mix or levels of consumer purchases of
small electric and specialty housewares appliances, (2) changes in consumer retail and credit markets, (3) bankruptcy of or loss of major retail customers or suppliers, (4) changes in
costs, including transportation costs, of sourced
products, (5) delays in delivery of sourced products, (6) changes in or unavailability of quality or cost effective suppliers, (7) exchange rate fluctuations, changes in the import tariffs and monetary policies and other changes in the regulatory climate in the countries in
which Hamilton Beach buys, operates and/or sells products,
(8) product liability, regulatory actions or other litigation, warranty claims or returns of products, (9) customer acceptance of, changes in costs of, or delays in the development of new products, (10) increased competition, including consolidation within the
industry and (11) changes mandated by federal, state and
other regulation, including tax, health, safety or environmental legislation.
Kitchen Collection: (1) increased competition, including through online channels, (2) shift in consumer shopping patterns, gasoline prices, weather
conditions, the level of consumer confidence and disposable income as a
result of economic conditions, unemployment rates or other events or conditions that may adversely affect the number of customers visiting Kitchen Collection stores, (3) changes in the sales prices,
product mix or levels of consumer purchases of kitchenware
and small electric appliances, (4) changes in costs, including transportation costs, of inventory, (5) delays in delivery or the unavailability of inventory, (6) customer acceptance of new products, (7) the anticipated impact of the opening of new stores, the
ability to renegotiate existing leases and effectively and
efficiently close under-performing stores and (8) changes in the import tariffs and monetary policies and other changes in the regulatory climate in the countries in which Kitchen Collection buys, operates and/or sells products. ® |
 Non-GAAP Disclosure 48 NACCO defines non-GAAP measures as follows: Adjusted EBITDA is defined as net income before income taxes plus interest expense, interest income and depreciation, depletion
and amortization expense;
Net debt is defined as total debt less cash and cash equivalents; Cash flow before financing is defined as net cash from operating activities plus net cash from investing activities;
Return
on capital employed is defined as net income before interest expense, after tax divided by LTM average capital employed. LTM average capital employed is defined as LTM average equity plus LTM average debt less LTM average cash; and Net working capital is defined as accounts receivable plus inventories less accounts payable. For reconciliations from GAAP measurements to non-GAAP measurements see pages 49 to 55.
This presentation contains non-GAAP financial measures. Included in
this presentation are reconciliations of these non-GAAP financial measures to the most directly comparable financial measures calculated in accordance with U.S. generally accepted accounting
principles ("GAAP"). Adjusted income and
Adjusted EBITDA are measures of net income (loss) that differ from financial results measured in accordance with GAAP. The adjusted financial measures are U.S. GAAP financial measures adjusted to exclude Centennial. Adjusted EBITDA,
net debt, cash flow before financing, return on capital
employed, net working capital and the adjusted financial measures in this presentation are provided solely as supplemental non-GAAP disclosures of operating results. Management believes these non-GAAP financial
measures assist investors in understanding the results of
operations of NACCO Industries, Inc. and its subsidiaries and aid in understanding comparability of results. In addition, management evaluates results using these non-GAAP financial measures.
|
 Non-GAAP Reconciliations 49 ($ in thousands) Adjusted EBITDA reconciliation – by segment 2016 Full Year North American Coal Hamilton Beach Brands Kitchen Collection NACCO & Other Consolidated Calculation of Adjusted EBITDA Net income (loss) $8,244 $26,557 $(355) $(4,839) $29,607 Centennial asset impairment charge 17,443 - - - 17,443 Income tax provision (benefit) (8,212) 14,541 455 (1,921) 4,863 Interest expense 4,317 1,165 209 1 5,692 Interest income (177) - - (19) (196) Depreciation, depletion and amortization expense 12,682 4,681 1,545 368 19,276 Adjusted EBITDA $34,297 $46,944 $1,854 $(6,410) $76,685 Note: Adjusted EBITDA in this investor presentation is provided solely as a supplemental disclosure with respect to operating
results. Adjusted EBITDA does not represent net income, as defined by U.S. GAAP and should not be considered as a substitute for net income, or as an indicator of operating performance. NACCO defines Adjusted EBITDA as income (loss) before
asset impairment charges and income tax provision (benefit), plus net interest expense and depreciation, depletion and amortization expense. Adjusted EBITDA is not a measurement under U.S. GAAP and is not necessarily comparable with similarly titled
measures of other companies. |
 Non-GAAP Reconciliations (continued) 50 ($ in thousands) Cash Flow Before Financing For the Year Ended December 31, Hamilton Beach Brands 2012 2013 2014 2015 2016 Net cash provided by operating activities $27,390 $40,754 $18,581 $13,941 $58,731 Net cash used for investing activities (3,215) (2,278) (29,516) (4,775) (4,788) Hamilton Beach Brands Cash Flow before Financing $24,175 $38,476 $(10,935) $9,166 $53,943 For the Year Ended December 31, Kitchen Collection 2012 2013 2014 2015 2016 Net cash provided by (used for) operating activities $3,754 $(10,071) $7,097 $12,548 $3,833 Net cash used for investing activities (3,852) (2,113) (792) (1,768) (1,137) Kitchen Collection Cash Flow before Financing $(98) $(12,184) $6,305 $10,780 $2,696 For the Year Ended December 31, North American Coal 2012 2013 2014 2015 2016 Net cash provided by (used for) operating activities $50,158 $29,525 $(6,082) $95,925 $34,940 Net cash used for investing activities (56,320) (56,185) (44,143) (1,512) (3,916) North American Coal Cash Flow before Financing $(6,162) $(26,660) $(50,225) $94,413 $31,024 For the Year Ended
December 31, Consolidated
2012 2013 2014 2015 2016 Net cash provided by operating activities $74,335 $53,065 $19,799 $108,002 $93,935 Net cash used for investing activities (63,768) (60,734) (74,934) (8,291) (9,817) Consolidated Cash Flow before Financing $10,567 $(7,669) $(55,135) $99,711 $84,118 |
 Non-GAAP Reconciliations (continued) 51 ($ in thousands) Net Working Capital – Hamilton Beach Brands December 31, 2012 2013 2014 2015 2016 Accounts receivable, net $94,899 $100,714 $108,908 $100,918 $102,131 Inventories, net 84,814 90,713 104,746 97,511 95,008 Less: Accounts payable (82,800) (97,912) (103,399) (81,590) (102,051) Net Working Capital $96,913 $93,515 $110,255 $116,839 $95,088 |
 Non-GAAP Reconciliations (continued) 52 ($ in thousands) Return on Capital Employed – 2012 & 2013 _____________________ (1) Tax rate of 38% represents the Company's target marginal tax rate compared with 2012's effective income tax rate of
27.3%. (2)
Tax rate of 38% represents the Company's target marginal tax rate
compared with 2013's effective income tax rate of 20.2%.
North American Coal Hamilton Beach Brands 2012 2012 Average Equity (12/31/2011 and each of 2012’s quarter ends)
$96,132
$35,941
Plus: 2012 Average Debt (12/31/2011 and each of 2012’s
quarter ends) 109,019
45,502
Less: 2012 Average Cash (12/31/2011 and each of 2012’s
quarter ends) (5,671)
(3,674)
Total 2012 average capital employed
$199,480
$77,769
2012 Net Income $32,770 $21,200 Plus: 2012 Interest Expense 2,757 2,620 Less: Income taxes on 2012 interest expense at 38% (1,048) (1,001) Return on total capital employed = net income before after-tax interest expense
$34,479
$22,824
Return on total capital employed percentage
17.3%
29.3%
2013 2013 Average Equity (12/31/2012 and each of 2013’s quarter ends)
$121,124
$48,740
Plus: 2013 Average Debt (12/31/2012 and each of 2013’s
quarter ends) 140,267
27,163
Less: 2013 Average Cash (12/31/2012 and each of 2013’s
quarter ends) (1,242)
(1,779)
Total 2013 average capital employed
$260,149
$74,124
2013 Net Income $31,926 $25,093 Plus: 2013 Interest Expense 3,086 1,278 Less: Income taxes on 2013 interest expense at 38% (1,173) (486) Return on total capital employed = net income before after-tax interest expense
$33,839
$25,885
Return on total capital employed percentage
13.0%
34.9%
(2) (1) |
 Non-GAAP Reconciliations (continued) 53 North American Coal Hamilton Beach Brands 2014 2014 Average Equity (12/31/2013 and each of 2014’s quarter ends) $139,791 $53,453 Plus: 2014 Average Debt (12/31/2013 and each of 2014’s quarter ends)
179,841 32,284 Less: 2014 Average Cash (12/31/2013 and each of 2014’s quarter ends)
(136) (2,783) Total 2014 average capital employed $319,496 $82,954 2014 Net (Loss) income $(50,977) $23,144 Plus: 2014 Interest Expense, net 5,211 1,133 Less: Income taxes on 2014 interest expense at 38% (1,980) (431) Return on total capital employed = net (loss) income before after-tax interest expense, net $(47,746) $23,846 Return on total capital employed percentage 14.9% 28.7% 2015 2015 Average Equity (12/31/2014 and each of 2015’s quarter ends) $107,240 $51,541 Plus: 2015 Average Debt (12/31/2014 and each of 2015’s quarter ends)
132,308 58,870 Less: 2015 Average Cash (12/31/2014 and each of 2015’s quarter ends)
(2,886) (1,373) Total 2015 average capital employed $236,662 $109,038 2015 Net Income $5,619 $19,749 Plus: 2015 Interest Expense, net 4,545 1,775 Less: Income taxes on 2015 interest expense at 38% (1,727) (675) Return on total capital employed = net income before after-tax interest expense, net $8,437 $20,849 Return on total capital employed percentage 3.6% 19.1% ($ in thousands) Return on Capital Employed – 2014 and 2015 _____________________ (1) Tax rate of 38% represents the Company's target marginal tax rate compared with 2014's effective income tax rate of
50.2%. (2)
Tax rate of 38% represents the Company's target marginal tax rate
compared with 2015’s effective income tax rate of 11.4%.
(1) (2) |
 Non-GAAP Reconciliations (continued) 54 ($ in thousands) Return on Capital Employed – 2016 _____________________ (1) Tax rate of 38% represents the Company's target marginal tax rate compared with 2016’s effective income tax rate of
14.1%. North American Coal Hamilton Beach Brands 2016 2016 Average Equity (12/31/2015 and each of 2016’s quarter ends) $110,554 $51,954 Plus: 2016 Average Debt (12/31/2015 and each of 2016’s quarter ends)
108,020 40,167 Less: 2016 Average Cash (12/31/2015 and each of 2016’s quarter ends)
(10,884) (2,616) Total 2016 average capital employed $207,690 $89,505 2016 Net Income $8,244 $26,557 Plus: 2016 Interest Expense, net 4,140 1,165 Less: Income taxes on 2016 interest expense at 38% (1,573) (443) Return on total capital employed = net income before after-tax interest expense, net $10,811 $27,279 Return on total capital employed percentage 5.2% 30.5% (1) |
 NACCO Consolidated Reconciliation “As Reported” to Adjusted
Year Ended December 31, 2016 Reconciliation of Adjusted Income Net Income, as reported $29,607 Adjustments to eliminate Centennial 17,159 Adjusted Income $46,766 Non-GAAP Reconciliations (continued) 55 ($ in thousands) ($ in thousands) _____________________ Adjusted Income is a non-GAAP measure. Adjusted Income is adjusted for the exclusion of Centennial, including the 2014
asset impairment charge, the 2015 charges associated with the decision to cease mining operations at Centennial and 2016 Centennial asset impairment charge and Alabama legal settlement. Management believes Adjusted Income assists the investor in understanding the results of operations
of NACCO Industries and NACoal and aids in understanding comparability of results. In addition, management evaluates results using this non-GAAP measure. NACoal Reconciliation “As Reported” to Adjusted Year Ended December 31 2013 2014 2015 2016 Reconciliation of Adjusted Income Net Income (Loss), as reported $31,926 $(50,977) $ 5,619 $ 8,244 Adjustments to eliminate Centennial 10,316 78,941 21,684 17,159 Adjusted Income $42,242 $27,964 $27,303 $25,403 |