Attached files
| file | filename |
|---|---|
| 8-K - 8-K - FEDERAL HOME LOAN MORTGAGE CORP | d267735d8k.htm |
| EX-99.2 - EXHIBIT 99.2 - FEDERAL HOME LOAN MORTGAGE CORP | d267735dex992.htm |
Exhibit 99.1

|

|
| News Release | For Immediate Release // February 16, 2017 |
Freddie Mac Reports Net Income of $7.8 Billion for Full-Year 2016;
Comprehensive Income of $7.1 Billion
Fifth Straight Year of Positive Earnings; Nearly $106 Billion Returned to Taxpayers, Including Scheduled March 2017 Payment
| Full-Year and Fourth Quarter 2016 Results
Full-Year: Comprehensive income driven by solid business results, as the company benefited from higher guarantee fee revenues.
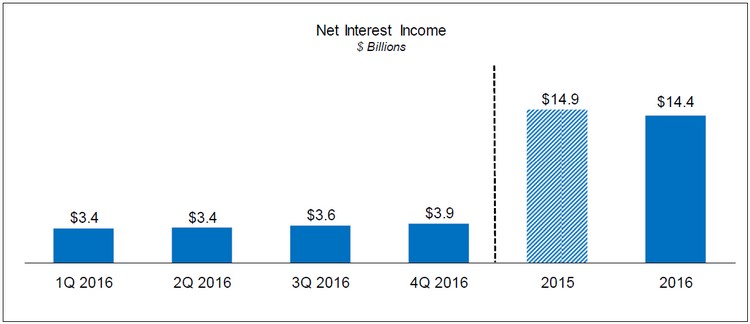
● $14.4 billion of net interest income, down 4 percent from 2015, as expected revenue declines in the investments portfolio were largely offset by higher single-family guarantee fee income.
● $0.4 billion (after-tax) estimated market-related gains, as quarterly volatility had minimal effect on full-year results.
◾ $0.1 billion (after-tax) estimated gain due to market spreads tightening; some market spread sensitivity is inherent in the company’s business model.
◾ $0.3 billion (after-tax) estimated gain due to a modest increase in longer-term interest rates; this generally reflects measurement differences between GAAP financial results and business economics.
Fourth Quarter: Comprehensive income of $3.9 billion driven by solid business results and $2.3 billion of market-related gains, primarily driven by a significant increase in longer-term interest rates during the quarter.
● The company continues to manage its interest-rate risk to low levels on an economic basis, as evidenced by its duration gap, which measured near zero months at year end 2016.
|
Comprehensive Income 2016 = $7.1B / 4Q16 = $3.9B | |||
| Total Assets 12/31/2016 = $2.0T (Up 1.9% from 12/31/2015) | ||||
| Available PSPA Funding 4Q16 = $140.5B | ||||
| 2016 Business Highlights |
||||
|
Business Fundamentals Remain Strong Single-Family Guarantee Business ● Core (post-2008) book, which excludes HARP and other relief refinance loans, grew to 73 percent of the credit guarantee portfolio, from 66 percent at year end 2015. ● Purchase volume of $393 billion, up 12 percent from 2015, primarily driven by higher refinance volume due to lower average mortgage interest rates. ● Serious delinquency rate of 1.00 percent, a decline of 32 basis points from year end 2015, and the lowest since June 2008. Multifamily Business ● Record purchase volume of $56.8 billion, an increase of 20 percent from 2015, primarily driven by significant growth in the multifamily market and the company’s increased presence in the small balance loan market. ● Delinquency rate continues near zero at 0.03 percent.
Reducing Taxpayer Exposure Through Credit Risk Transfer Programs Single-Family Guarantee Business ● Transferred a significant portion of the credit risk on approximately $215 billion of loans, and over $600 billion of loans since the program’s inception in 2013. Multifamily Business ● Transferred a large majority of the credit risk on a record $50 billion of loans, and on nearly $180 billion of loans since the program’s inception in 2009.
Actively Reducing Legacy Assets ● Sold $3.1 billion of seriously delinquent and $1.1 billion of performing modified and reperforming single-family loans; cumulatively sold $7.7 billion in seasoned single-family mortgage loans since 2013. ● Sold $8.1 billion of single-family non-agency mortgage-related securities; cumulatively sold $36.1 billion since 2013.
Delivering on Our Mission ● Provided approximately $456 billion in liquidity to the mortgage market – funding nearly 1.7 million single-family homes and approximately 739,000 multifamily rental units. ● Helped approximately 69,000 borrowers avoid foreclosure.
|
“2016 marked Freddie Mac’s fifth consecutive year of profitability, reflecting not only an improving economy but also the very successful work we have done to transform the company. Our single-family business continues to grow, and we were once again the nation’s leading multifamily lender. We have the best overall credit quality in nearly a decade. Additionally, we are the leading innovator in credit risk transfer and the efficient reduction of legacy assets – enabling us to systematically reduce taxpayer exposure to mortgage risks.
“Alongside these improvements, we are more effectively delivering on our community mission each year – with new products and programs which increase access to credit for more homebuyers and which fund affordable rental housing across the nation.
“All of us at Freddie Mac are strongly dedicated to continuing this momentum and, through it, to improving America’s housing finance system.”
Donald H. Layton Chief Executive Officer |
Freddie Mac Fourth Quarter 2016 Financial Results
February 16, 2017
Page 2
McLean, VA — Freddie Mac (OTCQB: FMCC) today reported net income of $7.8 billion for the full-year 2016, compared to net income of $6.4 billion for the full-year 2015. The company also reported comprehensive income of $7.1 billion for the full-year 2016, compared to comprehensive income of $5.8 billion for the full-year 2015.
Summary Consolidated Statements of Comprehensive Income
| Three Months Ended | Full-Year | |||||||||||||||||||||||||
| ($ Millions) | 12/31/16 | 9/30/16 | Change | 2016 | 2015 | Change | ||||||||||||||||||||
| 1 | Net interest income | $ | 3,885 | $ | 3,646 | $ | 239 | $ | 14,379 | $ | 14,946 | $ | (567 | ) | ||||||||||||
| 2 | Benefit (provision) for credit losses | (326 | ) | (113 | ) | (213 | ) | 803 | 2,665 | (1,862 | ) | |||||||||||||||
| 3 | Derivative gains (losses) | 6,381 | (36 | ) | 6,417 | (274 | ) | (2,696 | ) | 2,422 | ||||||||||||||||
| 4 | Other non-interest income (loss)(1) | (1,411 | ) | 813 | (2,224 | ) | 774 | (903 | ) | 1,677 | ||||||||||||||||
|
|
|
|
|
|
|
|
|
|
|
|
|
|||||||||||||||
| 5 | Non-interest income (loss) | 4,970 | 777 | 4,193 | 500 | (3,599 | ) | 4,099 | ||||||||||||||||||
| 6 | Administrative expense | (584 | ) | (498 | ) | (86 | ) | (2,005 | ) | (1,927 | ) | (78 | ) | |||||||||||||
| 7 | Other non-interest expense | (582 | ) | (487 | ) | (95 | ) | (2,038 | ) | (2,811 | ) | 773 | ||||||||||||||
|
|
|
|
|
|
|
|
|
|
|
|
|
|||||||||||||||
| 8 | Non-interest expense | (1,166 | ) | (985 | ) | (181 | ) | (4,043 | ) | (4,738 | ) | 695 | ||||||||||||||
| 9 | Pre-tax income | 7,363 | 3,325 | 4,038 | 11,639 | 9,274 | 2,365 | |||||||||||||||||||
| 10 | Income tax benefit (expense) | (2,516 | ) | (996 | ) | (1,520 | ) | (3,824 | ) | (2,898 | ) | (926 | ) | |||||||||||||
|
|
|
|
|
|
|
|
|
|
|
|
|
|||||||||||||||
| 11 | Net income | $ | 4,847 | $ | 2,329 | $ | 2,518 | $ | 7,815 | $ | 6,376 | $ | 1,439 | |||||||||||||
| 12 | Total other comprehensive income (loss) | (972 | ) | (19 | ) | (953 | ) | (697 | ) | (577 | ) | (120 | ) | |||||||||||||
|
|
|
|
|
|
|
|
|
|
|
|
|
|||||||||||||||
| 13 | Comprehensive income | $ | 3,875 | $ | 2,310 | $ | 1,565 | $ | 7,118 | $ | 5,799 | $ | 1,319 | |||||||||||||
|
|
|
|
|
|
|
|
|
|
|
|
|
|||||||||||||||
| Memo Item |
||||||||||||||||||||||||||
| 14 | Guarantee fee income(1) | $ | 146 | $ | 133 | $ | 13 | $ | 513 | $ | 369 | $ | 144 | |||||||||||||
| (1) | Guarantee fee income on a GAAP basis is primarily from the company’s multifamily business and is included in Other income (loss) on Freddie Mac’s consolidated statements of comprehensive income. |
Financial Results Discussion
Full-Year 2016 Financial Results – Freddie Mac’s 2016 net income of $7.8 billion and comprehensive income of $7.1 billion increased $1.4 billion and $1.3 billion, respectively, from 2015. The increase in the company’s full-year 2016 results was primarily driven by solid business results, as the company benefited from higher single-family guarantee fee income driven by amortization of upfront fees, and two market-related items.
| ● | Net Interest Rate Effect: $0.3 billion (after-tax) estimated fair value gain for the full-year 2016 driven by a modest increase in longer-term interest rates, compared to a $0.2 billion (after-tax) estimated fair value loss for the full-year 2015 as interest rates decreased. (See Net Interest Rate Effect table for additional details.) |
| ● | Spread Change Effect: $0.1 billion (after-tax) estimated gain for the full-year 2016 due to the impact of market spreads tightening on agency and non-agency mortgage-related securities and multifamily mortgage loans and commitments measured at fair value, compared to a $0.3 billion (after-tax) estimated loss for the full-year 2015 as market spreads widened. |
| ◾ | In the fourth quarter of 2016, the company separated the spread-related gains (losses) on held-for-sale multifamily mortgage loans and commitments from the effect of improved pricing on K Certificates and small balance loan securitizations (SB Certificates). The effect of this improved pricing is now excluded from the estimated spread change effect. |
Fourth Quarter 2016 Financial Results – The company’s fourth quarter 2016 net income of $4.8 billion and comprehensive income of $3.9 billion increased $2.5 billion and $1.6 billion, respectively, from the third quarter of 2016. The improvement in the company’s fourth quarter 2016 results was primarily driven by two market-related items:
Freddie Mac Fourth Quarter 2016 Financial Results
February 16, 2017
Page 3
| ● | Net Interest Rate Effect: $2.0 billion (after-tax) estimated fair value gain for the fourth quarter of 2016 as longer-term interest rates increased significantly, compared to a minimal effect for the third quarter of 2016 from the impact of a modest increase in longer-term rates. (See Net Interest Rate Effect table for additional details.) |
| ● | Spread Change Effect: $0.3 billion (after-tax) estimated gain for the fourth quarter of 2016, compared to a $0.5 billion (after-tax) estimated gain during the third quarter of 2016, as market spreads tightened less in the fourth quarter than in the third quarter. |
Net Interest Rate Effect
| Three Months Ended | Full-Year | |||||||||||||||||||||||||
| ($ Billions) | 12/31/16 | 9/30/16 | Change | 2016 | 2015 | Change | ||||||||||||||||||||
| 1 | Derivative gains (losses) | $ | 6.4 | $ | — | $ | 6.4 | $ | (0.3 | ) | $ | (2.7 | ) | $ | 2.4 | |||||||||||
| Less: | ||||||||||||||||||||||||||
| 2 | Accrual of periodic cash settlements | (0.4 | ) | (0.4 | ) | — | (1.8 | ) | (2.2 | ) | 0.4 | |||||||||||||||
| 3 | Non-interest rate effect on derivative fair values | 0.1 | (0.1 | ) | 0.2 | (0.1 | ) | — | (0.1 | ) | ||||||||||||||||
|
|
|
|
|
|
|
|
|
|
|
|
|
|||||||||||||||
| 4 | Interest rate effect on derivative fair values | 6.7 | 0.5 | 6.2 | 1.6 | (0.5 | ) | 2.1 | ||||||||||||||||||
| Add: | ||||||||||||||||||||||||||
| 5 | Estimate of offsetting interest rate effect related to financial instruments measured at fair value(1) | (3.6 | ) | (0.5 | ) | (3.1 | ) | (1.2 | ) | 0.2 | (1.4 | ) | ||||||||||||||
| 6 | Income tax benefit (expense) - @ 35% | (1.1 | ) | — | (1.1 | ) | (0.1 | ) | 0.1 | (0.2 | ) | |||||||||||||||
|
|
|
|
|
|
|
|
|
|
|
|
|
|||||||||||||||
| 7 | Estimated net interest rate effect on comprehensive income | $ | 2.0 | $ | — | $ | 2.0 | $ | 0.3 | $ | (0.2 | ) | $ | 0.5 | ||||||||||||
|
|
|
|
|
|
|
|
|
|
|
|
|
|||||||||||||||
|
|
|
|
|
|
|
|
|
|
|
|
|
|||||||||||||||
| (1) | Includes the interest-rate effect on the company’s trading securities, available-for-sale securities, mortgage-loans held-for-sale, and other assets and debt for which the company elected the fair value option, which is reflected in Other non-interest income (loss) and Total other comprehensive income (loss) on Freddie Mac’s consolidated statements of comprehensive income. |
Selected Financial Measures
Note: Amounts may not add due to rounding.
Freddie Mac Fourth Quarter 2016 Financial Results
February 16, 2017
Page 4
Full-Year 2016
| ● | Net interest income was $14.4 billion, a decrease of $567 million from the full-year 2015. |
| ◾ | The decrease in net interest income primarily reflects a decline in the balance of the company’s investments portfolio. The decrease was partially offset by an increase in guarantee fee income for the single-family business driven by higher amortization of upfront fees due to increased loan liquidations resulting from a lower interest rate environment, as well as higher average contractual guarantee fees. |
Fourth Quarter 2016
| ● | Net interest income was $3.9 billion, an increase of $239 million from the third quarter of 2016. |
| ◾ | The increase in net interest income primarily reflects higher amortization income driven by increased liquidations. |
| (1) | Guarantee fee income on a GAAP basis is primarily from the company’s multifamily business and is included in Other income (loss) on Freddie Mac’s consolidated statements of comprehensive income. |
Full-Year and Fourth Quarter 2016
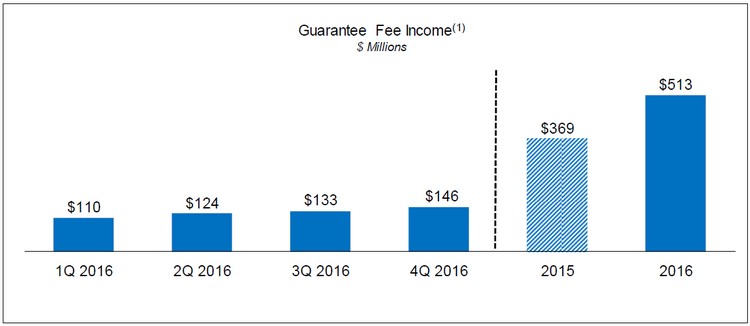
| ● | Guarantee fee income, primarily from the company’s multifamily business, was $513 million for the full-year 2016 and $146 million for the fourth quarter of 2016, an increase of $144 million and $13 million from the full-year 2015 and the third quarter of 2016, respectively. |
| ◾ | The full-year and quarterly increases in guarantee fee income primarily reflect higher average multifamily guarantee portfolio balances as a result of an increase in issuances of K Certificates and SB Certificates in 2016. |
Freddie Mac Fourth Quarter 2016 Financial Results
February 16, 2017
Page 5
Note: Amounts may not add due to rounding.
Full-Year 2016
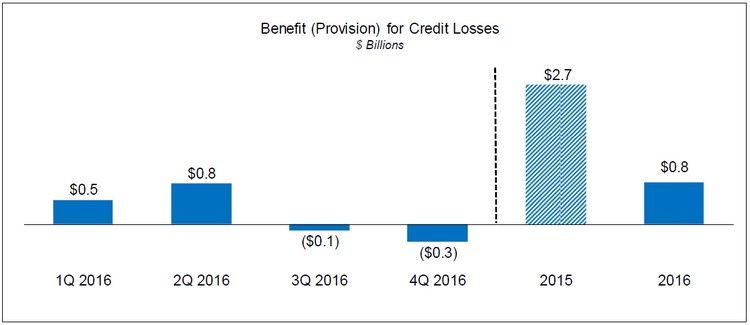
| ● | Benefit for credit losses was $803 million, a decrease of $1.9 billion from the full-year 2015. |
| ◾ | The decrease in benefit for credit losses primarily reflects a decrease in the number of seasoned single-family mortgage loans (i.e., seriously delinquent, performing modified and reperforming single-family loans) being reclassified from held-for-investment to held-for-sale in the full-year 2016. |
| o | Freddie Mac reclassified $4.7 billion in unpaid principal balance (UPB) of seasoned single-family mortgage loans in the full-year 2016, compared to $13.6 billion in the full-year 2015. |
Fourth Quarter 2016
| ● | Provision for credit losses was $326 million, an increase in provision of $213 million from the third quarter of 2016. |
| ◾ | The increase in provision for credit losses primarily reflects higher total interest rate concessions due to the longer expected life of certain modified loans resulting from rising mortgage interest rates in the fourth quarter of 2016, partially offset by an increase in seasoned single-family mortgage loans reclassified from held-for-investment to held-for-sale in the fourth quarter of 2016. |
| o | During the fourth quarter of 2016, $0.9 billion in UPB of seasoned single-family mortgage loans were reclassified, compared to $0.3 billion during the third quarter of 2016. |
Freddie Mac Fourth Quarter 2016 Financial Results
February 16, 2017
Page 6
Variability of Earnings
Freddie Mac’s financial results are subject to significant earnings variability from period to period. This variability is primarily driven by:
| ● | Interest-Rate Volatility – Freddie Mac holds assets and liabilities that expose it to interest-rate risk. Through its use of derivatives, the company manages its exposure to interest-rate risk on an economic basis to a low level as measured by the company’s models. However, the way the company accounts for its financial assets and liabilities (i.e., some are measured at amortized cost, while others are measured at fair value), including derivatives, creates volatility in the company’s GAAP earnings when interest rates fluctuate. Based upon the composition of its financial assets and liabilities, including derivatives, at December 31, 2016, the company generally recognizes fair value losses in earnings when interest rates decline. This volatility generally is not indicative of the underlying economics of its business. |
| ● | Spread Volatility – The volatility of market spreads (i.e., credit spreads, liquidity spreads, risk premiums, etc.), or option-adjusted spreads, is the risk associated with changes in the excess of market interest rates over benchmark rates. Freddie Mac holds assets and liabilities that expose it to spread volatility, which may contribute to significant GAAP earnings volatility. For financial assets measured at fair value, the company generally recognizes fair value losses when market spreads widen. Conversely, for financial liabilities measured at fair value, the company generally recognizes fair value gains when market spreads widen. |
The variability of GAAP earnings and the declining capital reserve required under the terms of the Purchase Agreement (ultimately reaching zero in 2018) increase the risk of Freddie Mac having a negative net worth and thus being required to draw from Treasury. The company could face a risk of a draw for a variety of reasons, including if it were to experience a large decrease in interest rates, which would result in GAAP losses due to measurement differences, coupled with a large widening of market spreads.
In an effort to reduce the probability of a draw due to changes in interest rates, the company entered into certain transactions, including structured transactions, during 2016 that have resulted in additional financial assets being recognized and measured at fair value, which will help to reduce the measurement differences. In addition, in the first quarter of 2017, the company began using hedge accounting for certain single-family mortgage loans, which is intended to partially reduce the interest-rate volatility in its GAAP earnings by eliminating a portion of the measurement differences between the company’s GAAP financial results and the underlying economics of its business.
Non-GAAP Financial Measure Highlights
In addition to analyzing the company’s results on a GAAP basis, management reviews certain financial measures on an “adjusted”, or non-GAAP basis. The adjusted, or non-GAAP, financial measures are calculated by reclassifying certain credit guarantee-related activities and investment-related activities between various line items on the company’s GAAP consolidated statements of comprehensive income. Management believes the non-GAAP financial measures are useful because they more clearly explain the company’s sources of revenue. The company does not present adjusted measures for net income or comprehensive income.
| ● | The company’s GAAP net interest income includes the spread earned on its investments activities plus the guarantee fees earned by its single-family business. GAAP guarantee fees are primarily those generated by its multifamily business. |
| ◾ | The adjusted net interest income is the net spread earned on the company’s investments activities, including the cost of funds associated with using derivatives. |
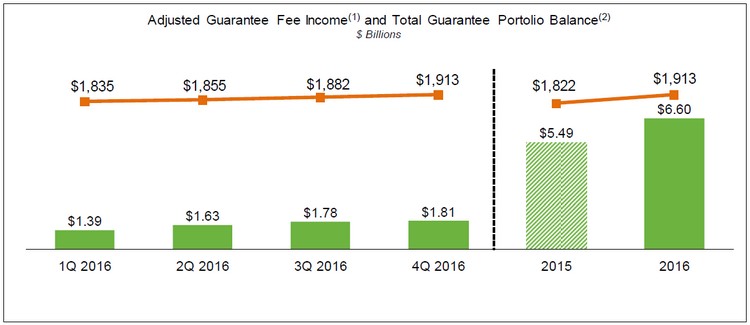
| ◾ | The adjusted guarantee fee income is designed to show the revenues from guarantee fees from both the single-family and multifamily businesses, net of the 10 basis point guarantee fee remitted to Treasury as part of the Temporary Payroll Tax Cut Act. |
Freddie Mac Fourth Quarter 2016 Financial Results
February 16, 2017
Page 7
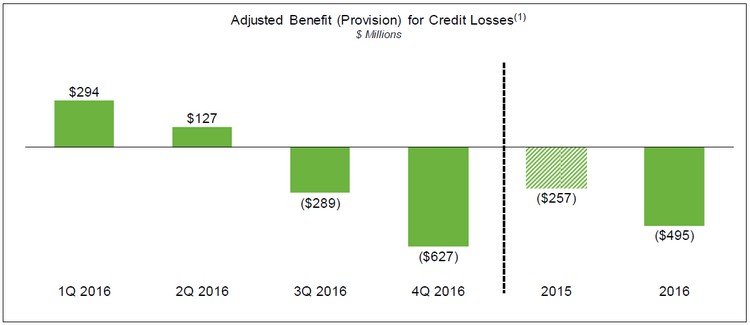
| ◾ | In addition, the adjusted benefit (provision) for credit losses reflects the company’s credit-related expenses after removing the effect of accounting-related reclassifications associated with the transfer of certain seasoned single-family mortgage loans from held-for-investment to held-for-sale to support the sale of such loans. |
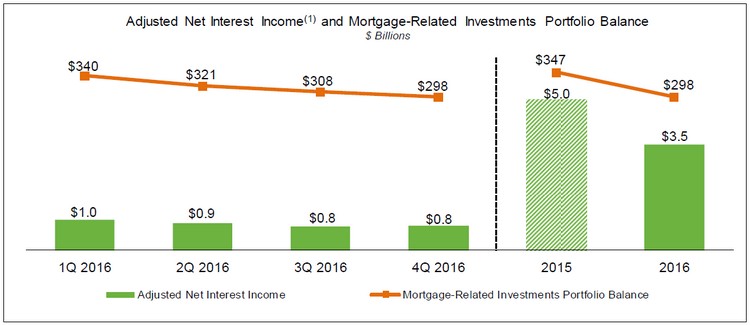
The graphs that follow show the company’s three non-GAAP financial measures – adjusted net interest income, adjusted guarantee fee income and adjusted benefit (provision) for credit losses.
| (1) | Non-GAAP financial measure. For reconciliations to the comparable amounts under GAAP, see page 18 of this press release. |
Full-Year 2016
| ● | Adjusted net interest income was $3.5 billion, a decrease of $1.5 billion from the full-year 2015. |
| ◾ | The decrease in adjusted net interest income primarily reflects a decline in the balance of the company’s investments portfolio, as well as higher hedging costs resulting from an increase in mortgage prepayment risk driven by the continued low interest rate environment in 2016. |
| ◾ | Adjusted net interest income is expected to decline over the long term, primarily as a result of the company’s ongoing reduction of its mortgage-related investments portfolio in accordance with the requirements of the Senior Preferred Stock Purchase Agreement (Purchase Agreement) and FHFA. |
| o | The mortgage-related investments portfolio was $298.4 billion as of December 31, 2016, a decline of $48.5 billion, or 14 percent, from December 31, 2015. |
| o | The company is particularly focused on reducing the balance of less liquid assets in this portfolio. The balance of less liquid assets was $124.0 billion as of December 31, 2016, a decline of $37.2 billion, or 23 percent, from December 31, 2015. |
| – | Less liquid assets (e.g., reperforming loans, performing modified loans, single-family seriously delinquent loans, and non-agency mortgage-related securities not guaranteed by a GSE) are less liquid than agency securities and loans in the securitization pipeline. |
Fourth Quarter 2016
| ● | Adjusted net interest income was $809 million, an increase of $22 million from the third quarter of 2016. |
| ◾ | The increase in adjusted net interest income primarily reflects lower hedging costs. |
Freddie Mac Fourth Quarter 2016 Financial Results
February 16, 2017
Page 8
| (1) | Non-GAAP financial measure. For reconciliations to the comparable amounts under GAAP, see page 18 of this press release. |
| (2) | Total guarantee portfolio balance represents the total of the single-family credit guarantee portfolio and the multifamily guarantee portfolio. |
Note: Amounts may not add due to rounding.
Full-Year 2016
| ● | Adjusted guarantee fee income was $6.6 billion, an increase of $1.1 billion from the full-year 2015. |
| ◾ | The increase in adjusted guarantee fee income primarily reflects strong business volume driven by higher mortgage refinance activity, which resulted in higher amortization of upfront fees as loan liquidations increased due to the lower average interest rate environment, as well as higher average contractual guarantee fees. |
| o | Adjusted guarantee fee income from contractual guarantee fees is expected to increase over the long term as guarantee fees on new business are generally higher than the fees received on older vintages that continue to run off. |
| o | However, this accelerated recognition of upfront fees, which is driven by loan liquidations, would decrease if refinance activity declines. |
| ◾ | The total guarantee portfolio balance grew to $1.91 trillion at December 31, 2016, an increase of $91 billion, or 5 percent from December 31, 2015. |
| o | The growth in the total guarantee portfolio was driven by an increase in both the single-family credit guarantee and the multifamily guarantee portfolios. |
Fourth Quarter 2016
| ● | Adjusted guarantee fee income was $1.8 billion, an increase of $34 million from the third quarter of 2016. |
| ◾ | The increase in adjusted guarantee fee income primarily reflects higher average contractual guarantee fees. |
Freddie Mac Fourth Quarter 2016 Financial Results
February 16, 2017
Page 9
| (1) | Non-GAAP financial measure. For reconciliations to the comparable amounts under GAAP, see page 18 of this press release. |
Full-Year and Fourth Quarter 2016
| ● | Adjusted provision for credit losses was $495 million for the full-year 2016 and $627 million for the fourth quarter of 2016, an increase of $238 million and $338 million from the full-year 2015 and the third quarter of 2016, respectively. |
| ◾ | The increases in adjusted provision for credit losses primarily resulted from higher total interest rate concessions due to the longer expected life of certain modified loans driven by rising mortgage interest rates in the fourth quarter of 2016. |
Freddie Mac Fourth Quarter 2016 Financial Results
February 16, 2017
Page 10
Segment Financial Results and Business Highlights
Freddie Mac’s operations consist of three reportable segments, which are based on the types of business activities they perform – Single-Family Guarantee, Multifamily and Investments. The company presents Segment Earnings for each segment by reclassifying certain credit guarantee-related and investment-related activities between various line items on its GAAP consolidated statements of comprehensive income and allocating certain revenue and expenses, including certain returns on assets and funding costs, and all administrative expenses to its three reportable segments. For more information about Segment Earnings, see Note 11 to the financial statements included in the company’s Annual Report on Form 10-K for the year ended December 31, 2016.
Segment Earnings and Comprehensive Income(1)
| Three Months Ended | Full-Year | |||||||||||||||||||||||||
| ($ Millions) | 12/31/16 | 9/30/16 | Change | 2016 | 2015 | Change | ||||||||||||||||||||
| Single-Family Guarantee Segment | ||||||||||||||||||||||||||
| 1 | Guarantee fee income | $ | 1,664 | $ | 1,641 | $ | 23 | $ | 6,091 | $ | 5,152 | $ | 939 | |||||||||||||
| 2 | Benefit (provision) for credit losses | (630 | ) | (297 | ) | (333 | ) | (517 | ) | (283 | ) | (234 | ) | |||||||||||||
| 3 | Administrative expense | (384 | ) | (330 | ) | (54 | ) | (1,323 | ) | (1,285 | ) | (38 | ) | |||||||||||||
| 4 | Other | (142 | ) | (364 | ) | 222 | (1,020 | ) | (999 | ) | (21 | ) | ||||||||||||||
| 5 | Income tax (expense) benefit | (228 | ) | (153 | ) | (75 | ) | (1,061 | ) | (807 | ) | (254 | ) | |||||||||||||
|
|
|
|
|
|
|
|
|
|
|
|
|
|||||||||||||||
| 6 | Segment Earnings, net of taxes | 280 | 497 | (217 | ) | 2,170 | 1,778 | 392 | ||||||||||||||||||
| 7 | Total other comprehensive income (loss), net of tax | (8 | ) | (1 | ) | (7 | ) | (9 | ) | 12 | (21 | ) | ||||||||||||||
|
|
|
|
|
|
|
|
|
|
|
|
|
|||||||||||||||
| 8 | Total comprehensive income | $ | 272 | $ | 496 | $ | (224 | ) | $ | 2,161 | $ | 1,790 | $ | 371 | ||||||||||||
|
|
|
|
|
|
|
|
|
|
|
|
|
|||||||||||||||
| Multifamily Segment | ||||||||||||||||||||||||||
| 9 | Net interest income | $ | 231 | $ | 255 | $ | (24 | ) | $ | 1,022 | $ | 1,049 | $ | (27 | ) | |||||||||||
| 10 | Guarantee fee income | 145 | 134 | 11 | 511 | 339 | 172 | |||||||||||||||||||
| 11 | Gains (losses) on loans and other non-interest income | (500 | ) | 551 | (1,051 | ) | 1,166 | (198 | ) | 1,364 | ||||||||||||||||
| 12 | Derivative gains (losses) | 1,285 | 205 | 1,080 | 407 | 372 | 35 | |||||||||||||||||||
| 13 | Administrative expense | (107 | ) | (89 | ) | (18 | ) | (362 | ) | (325 | ) | (37 | ) | |||||||||||||
| 14 | Other | (12 | ) | (2 | ) | (10 | ) | (36 | ) | (34 | ) | (2 | ) | |||||||||||||
| 15 | Income tax (expense) benefit | (380 | ) | (310 | ) | (70 | ) | (890 | ) | (376 | ) | (514 | ) | |||||||||||||
|
|
|
|
|
|
|
|
|
|
|
|
|
|||||||||||||||
| 16 | Segment Earnings, net of taxes | 662 | 744 | (82 | ) | 1,818 | 827 | 991 | ||||||||||||||||||
| 17 | Total other comprehensive income (loss), net of tax | (292 | ) | 46 | (338 | ) | (236 | ) | (261 | ) | 25 | |||||||||||||||
|
|
|
|
|
|
|
|
|
|
|
|
|
|||||||||||||||
| 18 | Total comprehensive income | $ | 370 | $ | 790 | $ | (420 | ) | $ | 1,582 | $ | 566 | $ | 1,016 | ||||||||||||
|
|
|
|
|
|
|
|
|
|
|
|
|
|||||||||||||||
| Investments Segment | ||||||||||||||||||||||||||
| 19 | Net interest income | $ | 578 | $ | 532 | $ | 46 | $ | 2,464 | $ | 3,902 | $ | (1,438 | ) | ||||||||||||
| 20 | Derivative gains (losses) | 5,884 | 613 | 5,271 | 2,499 | (70 | ) | 2,569 | ||||||||||||||||||
| 21 | Other non-interest income | (578 | ) | 555 | (1,133 | ) | 1,038 | 1,975 | (937 | ) | ||||||||||||||||
| 22 | Administrative expense | (93 | ) | (79 | ) | (14 | ) | (320 | ) | (317 | ) | (3 | ) | |||||||||||||
| 23 | Other | 22 | — | 22 | 19 | (4 | ) | 23 | ||||||||||||||||||
| 24 | Income tax (expense) benefit | (1,908 | ) | (533 | ) | (1,375 | ) | (1,873 | ) | (1,715 | ) | (158 | ) | |||||||||||||
|
|
|
|
|
|
|
|
|
|
|
|
|
|||||||||||||||
| 25 | Segment Earnings, net of taxes | 3,905 | 1,088 | 2,817 | 3,827 | 3,771 | 56 | |||||||||||||||||||
| 26 | Total other comprehensive income (loss), net of tax | (672 | ) | (64 | ) | (608 | ) | (452 | ) | (356 | ) | (96 | ) | |||||||||||||
|
|
|
|
|
|
|
|
|
|
|
|
|
|||||||||||||||
| 27 | Total comprehensive income | $ | 3,233 | $ | 1,024 | $ | 2,209 | $ | 3,375 | $ | 3,415 | $ | (40 | ) | ||||||||||||
|
|
|
|
|
|
|
|
|
|
|
|
|
|||||||||||||||
|
|
|
|
|
|
|
|
|
|
|
|
|
|||||||||||||||
| (1) | The financial performance of the company’s Single-Family Guarantee segment is measured based on its contribution to GAAP net income (loss). The financial performance of the company’s Investments segment and Multifamily segment are measured based on each segment’s contribution to GAAP comprehensive income (loss). |
Freddie Mac Fourth Quarter 2016 Financial Results
February 16, 2017
Page 11
Single-Family Guarantee Segment
Providing liquidity to the U.S. housing market while continuing to transfer credit risk to the private market
Financial Results
| ● | Single-Family Guarantee segment earnings were $2.2 billion for the full-year 2016, an increase of $392 million from the full-year 2015. |
| ◾ | The increase in segment earnings resulted from higher amortization of upfront fees due to increased loan liquidations, partially offset by an increase in provision for credit losses driven by higher total interest rate concessions due to the longer expected life of certain modified loans resulting from rising mortgage interest rates in the fourth quarter of 2016. |
Business Highlights
| ● | Core book continued to grow and was 73 percent of the single-family credit guarantee portfolio at December 31, 2016. |
| ◾ | HARP and other relief refinance loans represented 15 percent, while the legacy book declined to 12 percent. |
| ● | Average guarantee fees charged on new acquisitions were 45.1 basis points (net of the legislated 10 basis point guarantee fee remitted to Treasury as part of the Temporary Payroll Tax Cut Continuation Act of 2011) for the full-year 2016, up from 44.2 basis points in the full-year 2015. |
| ◾ | Average guarantee fees on the single-family credit guarantee portfolio were 35.5 basis points, an increase of 4.8 basis points from the full-year 2015, primarily due to higher amortization of upfront fees resulting from higher loan liquidations. |
| ● | Sold $3.1 billion in UPB of seriously delinquent single-family mortgage loans during the full-year 2016, and $6.6 billion since 2013. |
| ● | Transferred a portion of expected credit losses and a significant portion of credit losses in a stressed economic environment on approximately $215 billion in UPB of mortgage loans in the Core book during the full-year 2016. |
Multifamily Segment
Providing financing for workforce housing while continuing to transfer credit risk to the private market
Financial Results
| ● | Multifamily segment comprehensive income was $1.6 billion for the full-year 2016, an increase of $1.0 billion from the full-year 2015. |
| ◾ | The increase in comprehensive income was primarily due to improved pricing on K Certificates and SB Certificates, as well as fair value gains on held-for-sale mortgage loans and commitments as market spreads tightened significantly in 2016. |
| o | Derivative gains (losses) for the Multifamily segment are largely offset by interest-rate related fair value changes of the loans and investment securities being economically hedged. As a result, there is minimal net impact on total comprehensive income for the Multifamily segment from interest-rate related derivatives. |
Freddie Mac Fourth Quarter 2016 Financial Results
February 16, 2017
Page 12
Business Highlights
| ● | Record new purchase volume of $56.8 billion for the full-year 2016, an increase of 20 percent from the full-year 2015. |
| ◾ | The capped multifamily new business activity for the full-year 2016 was $36.5 billion. |
| o | The 2016 scorecard production cap was increased to $36.5 billion by FHFA during 2016 from an original amount of $31 billion. |
| ● | Executed 47 K Certificate transactions that transferred a large majority of expected and stress credit losses associated with $46.3 billion in UPB of loans during the full-year 2016. |
| ◾ | The company also transferred a large majority of expected and stress credit losses associated with $3.6 billion of additional loans through other securitization products, such as SB Certificates. |
| ● | Provided financing for approximately 739,000 rental units in the full-year 2016. |
| ◾ | Nearly 90 percent of the eligible units financed were affordable to families earning at or below area median incomes. |
Investments Segment
Enhancing the liquidity of the company’s securities in the secondary mortgage market while reducing less liquid assets using an economically sensible approach
Financial Results
| ● | Investments segment comprehensive income was $3.4 billion for the full-year 2016, a decrease of $40 million from the full-year 2015. |
| ◾ | The decrease in comprehensive income was primarily driven by lower net interest income due to a decline in the balance of the company’s investments portfolio, partially offset by market-related gains driven by a modest increase in interest rates in 2016. |
Business Highlights
| ● | Continued to actively reduce the balance of the company’s mortgage-related investments portfolio, focusing on reducing the balance of less liquid assets. The Investments segment less liquid assets were $79.2 billion at December 31, 2016, down $21.7 billion, or 22 percent, from December 31, 2015, due to sales of $8.1 billion of non-agency mortgage-related securities and ongoing portfolio liquidations. |
| ◾ | Sold $1.1 billion in UPB of single-family performing modified and reperforming loans during the full-year 2016. |
| ● | The Investments segment securitization pipeline assets, which represent performing single-family loans purchased for cash and held until securitized, were $13.1 billion at December 31, 2016, up $3.1 billion from December 31, 2015. |
| ● | Continued to maintain a presence in the agency mortgage-related securities market. |
| ◾ | Liquid assets held by the Investments segment were $137.5 billion at December 31, 2016, or 60 percent of the portfolio. |
Housing Market Support
Freddie Mac supports the U.S. housing market by executing its charter mission to ensure credit availability for new and refinanced mortgages as well as rental housing and helping struggling homeowners avoid foreclosure.
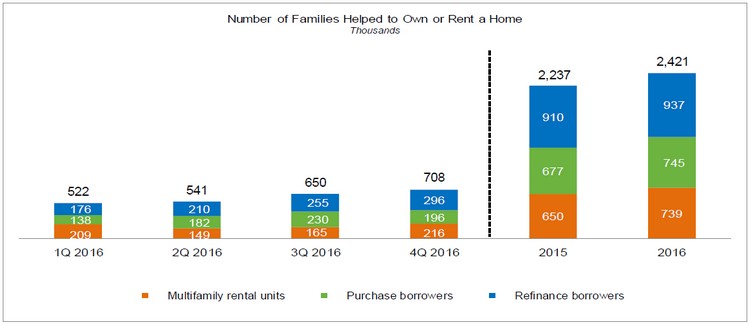
Mortgage Funding – Freddie Mac provided approximately $456 billion in liquidity to the market in the full-year 2016, funding:
| ● | Nearly 1.7 million single-family homes, approximately 937,000 of which were refinance loans. |
| ● | Approximately 739,000 multifamily rental units. |
Freddie Mac Fourth Quarter 2016 Financial Results
February 16, 2017
Page 13
Note: Amounts may not add due to rounding.
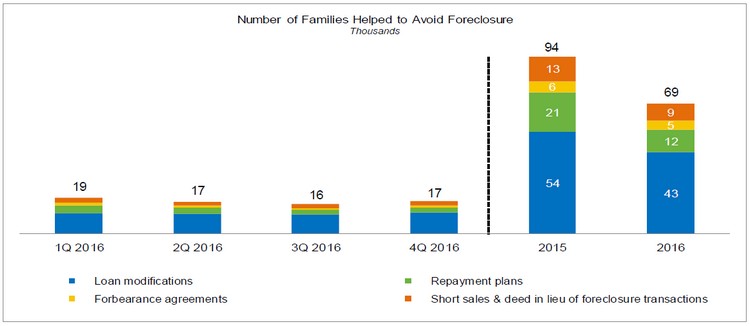
Preventing Foreclosures – Freddie Mac continued to help struggling borrowers retain their homes or otherwise avoid foreclosure in the full-year 2016.
| ● | The company completed approximately 69,000 single-family loan workouts. |
| ● | The declining trend over the past year in the company’s single-family workouts generally reflects rising home prices and improving economic conditions. |
| ● | When foreclosure is unavoidable, Freddie Mac has helped to further stabilize communities by focusing on sales of real estate owned homes to owner-occupants. |
Freddie Mac Fourth Quarter 2016 Financial Results
February 16, 2017
Page 14
About Freddie Mac’s Conservatorship
Since September 2008, Freddie Mac has been operating under conservatorship, with FHFA as Conservator. The support provided by Treasury pursuant to the Purchase Agreement enables the company to maintain access to the debt markets and have adequate liquidity to conduct its normal business operations.
Treasury Draw Requests and Dividend Payments
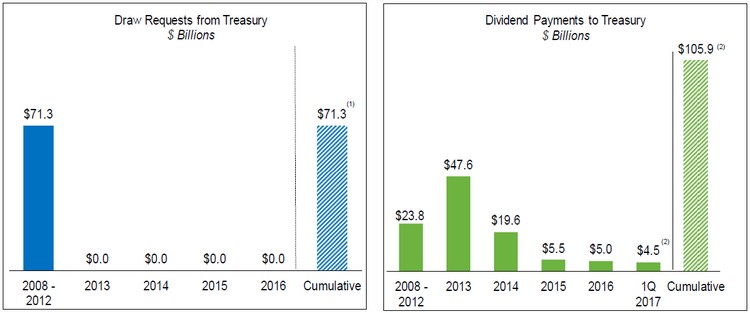
| (1) | Excludes the initial $1 billion liquidation preference of senior preferred stock issued to Treasury in September 2008 as consideration for Treasury’s funding commitment. The company received no cash proceeds as a result of issuing this initial $1 billion liquidation preference of senior preferred stock. |
| (2) | Includes the scheduled March 2017 dividend obligation of $4.5 billion. |
Note: Amounts may not add due to rounding.
| ● | Scheduled dividend obligation to Treasury in March 2017 will be $4.5 billion, based on Freddie Mac’s net worth of $5.1 billion at December 31, 2016, less the 2017 capital reserve amount of $600 million. |
| ◾ | The applicable capital reserve amount is $600 million for 2017, and will be zero beginning on January 1, 2018. |
| ● | Aggregate cash dividends paid to Treasury will total $105.9 billion (including the scheduled March 2017 dividend obligation), $34.6 billion more than cumulative cash draws of $71.3 billion received from Treasury through December 31, 2016. |
| ● | The amount of funding available to Freddie Mac under the Purchase Agreement remains unchanged at $140.5 billion, and will be reduced by any future draws. |
| ● | Treasury still maintains a liquidation preference of $72.3 billion on the company’s senior preferred stock as of December 31, 2016. |
| ◾ | The payment of dividends does not reduce the outstanding liquidation preference under the Purchase Agreement. |
| ◾ | Freddie Mac is not permitted to redeem the senior preferred stock prior to the termination of Treasury’s funding commitment under the Purchase Agreement. |
Freddie Mac Fourth Quarter 2016 Financial Results
February 16, 2017
Page 15
Additional Information
For more information, including that related to Freddie Mac’s financial results, conservatorship and related matters, see the company’s Annual Report on Form 10-K for the year ended December 31, 2016, and the company’s Financial Results Supplement. These documents are available on the Investor Relations page of the company’s Web site at www.FreddieMac.com/investors.
Additional information about Freddie Mac and its business is also set forth in the company’s filings with the SEC, which are available on the Investor Relations page of the company’s Web site at www.FreddieMac.com/investors and the SEC’s Web site at www.sec.gov. Freddie Mac encourages all investors and interested members of the public to review these materials for a more complete understanding of the company’s financial results and related disclosures.
Webcast Announcement
Management will host a conference call at 9 a.m. Eastern Time on February 16, 2017 to discuss the company’s results with the media. The conference call will be concurrently webcast. To access the live audio webcast, use the following link: http://edge.media-server.com/m/p/jdx7moou. The replay will be available on the company’s Web site at www.FreddieMac.com/investors for approximately 30 days. All materials related to the call will be available on the Investor Relations page of the company’s Web site at www.FreddieMac.com/investors.
| Media Contact: Lisa Gagnon (703) 903-3385 | Investor Contact: Robin Phillips (571) 382-4732 | |
* * * *
This press release contains forward-looking statements, which may include statements pertaining to the conservatorship, the company’s current expectations and objectives for its Single-Family Guarantee, Multifamily and Investments segments, its efforts to assist the housing market, liquidity and capital management, economic and market conditions and trends, market share, the effect of legislative and regulatory developments and new accounting guidance, credit quality of loans the company owns or guarantees, the costs and benefits of the company’s credit risk transfer transactions, and results of operations and financial condition on a GAAP, Segment Earnings, non-GAAP and fair value basis. Forward-looking statements involve known and unknown risks and uncertainties, some of which are beyond the company’s control. Management’s expectations for the company’s future necessarily involve a number of assumptions, judgments and estimates, and various factors, including changes in market conditions, liquidity, mortgage spreads, credit outlook, actions by the U.S. government (including FHFA, Treasury and Congress), and the impacts of legislation or regulations and new or amended accounting guidance, could cause actual results to differ materially from these expectations. These assumptions, judgments, estimates and factors are discussed in the company’s Annual Report on Form 10-K for the year ended December 31, 2016, which is available on the Investor Relations page of the company’s Web site at www.FreddieMac.com/investors and the SEC’s Web site at www.sec.gov. The company undertakes no obligation to update forward-looking statements it makes to reflect events or circumstances occurring after the date of this press release.
Freddie Mac makes home possible for millions of families and individuals by providing mortgage capital to lenders. Since our creation by Congress in 1970, we’ve made housing more accessible and affordable for homebuyers and renters in communities nationwide. We are building a better housing finance system for homebuyers, renters, lenders and taxpayers. Learn more at FreddieMac.com, Twitter @FreddieMac and Freddie Mac’s blog FreddieMac.com/blog.
FREDDIE MAC
CONSOLIDATED STATEMENTS OF COMPREHENSIVE INCOME
| Three Months Ended | Twelve Months Ended | |||||||||||||||
| December 31, 2016 | September 30, 2016 | December 31, 2016 | December 31, 2015 | |||||||||||||
| (in millions, except share-related amounts) | (in millions, except share-related amounts) | |||||||||||||||
| Interest income |
||||||||||||||||
| Mortgage loans |
$ | 14,987 | $ | 14,997 | $ | 61,040 | $ | 62,226 | ||||||||
| Investments in securities |
932 | 976 | 3,855 | 4,794 | ||||||||||||
| Other |
83 | 74 | 270 | 70 | ||||||||||||
|
|
|
|
|
|
|
|
|
|||||||||
| Total interest income |
16,002 | 16,047 | 65,165 | 67,090 | ||||||||||||
|
|
|
|
|
|
|
|
|
|||||||||
| Interest expense |
(12,072 | ) | (12,354 | ) | (50,595 | ) | (51,916 | ) | ||||||||
| Expense related to derivatives |
(45 | ) | (47 | ) | (191 | ) | (228 | ) | ||||||||
|
|
|
|
|
|
|
|
|
|||||||||
| Net interest income |
3,885 | 3,646 | 14,379 | 14,946 | ||||||||||||
| Benefit (provision) for credit losses |
(326 | ) | (113 | ) | 803 | 2,665 | ||||||||||
|
|
|
|
|
|
|
|
|
|||||||||
| Net interest income after benefit (provision) for credit losses |
3,559 | 3,533 | 15,182 | 17,611 | ||||||||||||
|
|
|
|
|
|
|
|
|
|||||||||
| Non-interest income (loss) |
||||||||||||||||
| Gains (losses) on extinguishment of debt |
55 | (92 | ) | (211 | ) | (240 | ) | |||||||||
| Derivative gains (losses) |
6,381 | (36 | ) | (274 | ) | (2,696 | ) | |||||||||
| Net Impairment of available-for-sale securities recognized in earnings |
(53 | ) | (9 | ) | (191 | ) | (292 | ) | ||||||||
| Other gains (losses) on investment securities recognized in earnings |
(1,140 | ) | 309 | (78 | ) | 508 | ||||||||||
| Other income (loss) |
(273 | ) | 605 | 1,254 | (879 | ) | ||||||||||
|
|
|
|
|
|
|
|
|
|||||||||
| Non-interest income (loss) |
4,970 | 777 | 500 | (3,599 | ) | |||||||||||
|
|
|
|
|
|
|
|
|
|||||||||
| Non-interest expense |
||||||||||||||||
| Salaries and employee benefits |
(262 | ) | (248 | ) | (989 | ) | (975 | ) | ||||||||
| Professional services |
(142 | ) | (129 | ) | (489 | ) | (497 | ) | ||||||||
| Occupancy expense |
(25 | ) | (13 | ) | (66 | ) | (56 | ) | ||||||||
| Other administrative expense |
(155 | ) | (108 | ) | (461 | ) | (399 | ) | ||||||||
|
|
|
|
|
|
|
|
|
|||||||||
| Total administrative expense |
(584 | ) | (498 | ) | (2,005 | ) | (1,927 | ) | ||||||||
| Real estate owned operations expense |
(118 | ) | (56 | ) | (287 | ) | (338 | ) | ||||||||
| Temporary Payroll Tax Cut Continuation Act of 2011 expense |
(307 | ) | (293 | ) | (1,152 | ) | (967 | ) | ||||||||
| Other expense |
(157 | ) | (138 | ) | (599 | ) | (1,506 | ) | ||||||||
|
|
|
|
|
|
|
|
|
|||||||||
| Non-interest expense |
(1,166 | ) | (985 | ) | (4,043 | ) | (4,738 | ) | ||||||||
|
|
|
|
|
|
|
|
|
|||||||||
| Income before income tax expense |
7,363 | 3,325 | 11,639 | 9,274 | ||||||||||||
| Income tax expense |
(2,516 | ) | (996 | ) | (3,824 | ) | (2,898 | ) | ||||||||
|
|
|
|
|
|
|
|
|
|||||||||
| Net income |
4,847 | 2,329 | 7,815 | 6,376 | ||||||||||||
|
|
|
|
|
|
|
|
|
|||||||||
| Other comprehensive income (loss), net of taxes and reclassification adjustments: |
||||||||||||||||
| Changes in unrealized gains (losses) related to available-for-sale securities |
(1,006 | ) | (47 | ) | (825 | ) | (806 | ) | ||||||||
| Changes in unrealized gains (losses) related to cash flow hedge relationships |
46 | 29 | 141 | 182 | ||||||||||||
| Changes in defined benefit plans |
(12 | ) | (1 | ) | (13 | ) | 47 | |||||||||
|
|
|
|
|
|
|
|
|
|||||||||
| Total other comprehensive income (loss), net of taxes and reclassification adjustments |
(972 | ) | (19 | ) | (697 | ) | (577 | ) | ||||||||
|
|
|
|
|
|
|
|
|
|||||||||
| Comprehensive income |
$ | 3,875 | $ | 2,310 | $ | 7,118 | $ | 5,799 | ||||||||
|
|
|
|
|
|
|
|
|
|||||||||
| Net income |
$ | 4,847 | $ | 2,329 | $ | 7,815 | $ | 6,376 | ||||||||
| Undistributed net worth sweep and senior preferred stock dividends |
(4,475 | ) | (2,310 | ) | (7,718 | ) | (6,399 | ) | ||||||||
|
|
|
|
|
|
|
|
|
|||||||||
| Net income (loss) attributable to common stockholders |
$ | 372 | $ | 19 | $ | 97 | $ | (23 | ) | |||||||
|
|
|
|
|
|
|
|
|
|||||||||
| Net income (loss) per common share — basic and diluted |
$ | 0.11 | $ | 0.01 | $ | 0.03 | $ | (0.01 | ) | |||||||
| Weighted average common shares outstanding (in millions) — basic and diluted |
3,234 | 3,234 | 3,234 | 3,235 | ||||||||||||
Page 16
FREDDIE MAC
CONSOLIDATED BALANCE SHEETS
| December 31, 2016 | December 31, 2015 | |||||||
| (in millions, except share-related amounts) | ||||||||
| Assets |
||||||||
| Cash and cash equivalents |
$ | 12,369 | $ | 5,595 | ||||
| Restricted cash and cash equivalents |
9,851 | 14,533 | ||||||
| Securities purchased under agreements to resell |
51,548 | 63,644 | ||||||
| Investments in securities, at fair value |
111,547 | 114,215 | ||||||
| Mortgage loans held-for-sale (includes $16,255 and $17,660 at fair value) |
18,088 | 24,992 | ||||||
| Mortgage loans held-for-investment (net of allowance for loan losses of $13,431 and $15,331) |
1,784,915 | 1,729,201 | ||||||
| Accrued interest receivable |
6,135 | 6,074 | ||||||
| Derivative assets, net |
747 | 395 | ||||||
| Deferred tax assets, net |
15,818 | 18,205 | ||||||
| Other assets (includes $2,408 and $1,753 at fair value) |
12,358 | 9,038 | ||||||
|
|
|
|
|
|||||
| Total assets |
$ | 2,023,376 | $ | 1,985,892 | ||||
|
|
|
|
|
|||||
| Liabilities and equity |
||||||||
| Liabilities |
||||||||
| Accrued interest payable |
$ | 6,015 | $ | 6,183 | ||||
| Debt, net (includes $6,010 and $7,184 at fair value) |
2,002,004 | 1,970,269 | ||||||
| Derivative liabilities, net |
795 | 1,254 | ||||||
| Other liabilities |
9,487 | 5,246 | ||||||
|
|
|
|
|
|||||
| Total liabilities |
2,018,301 | 1,982,952 | ||||||
|
|
|
|
|
|||||
| Commitments and contingencies |
||||||||
| Equity |
||||||||
| Senior preferred stock, at redemption value |
72,336 | 72,336 | ||||||
| Preferred stock, at redemption value |
14,109 | 14,109 | ||||||
| Common stock, $0.00 par value, 4,000,000,000 shares authorized, 725,863,886 shares issued and 650,046,828 shares and 650,045,962 shares outstanding |
— | — | ||||||
| Additional paid-in capital |
— | — | ||||||
| Retained earnings (accumulated deficit) |
(77,941 | ) | (80,773 | ) | ||||
| AOCI, net of taxes, related to: |
||||||||
| Available-for-sale securities (includes $782 and $778, related to net unrealized gains on securities for which other-than-temporary impairment has been recognized in earnings) |
915 | 1,740 | ||||||
| Cash flow hedge relationships |
(480 | ) | (621 | ) | ||||
| Defined benefit plans |
21 | 34 | ||||||
|
|
|
|
|
|||||
| Total AOCI, net of taxes |
456 | 1,153 | ||||||
| Treasury stock, at cost, 75,817,058 shares and 75,817,924 shares |
(3,885 | ) | (3,885 | ) | ||||
|
|
|
|
|
|||||
| Total equity |
5,075 | 2,940 | ||||||
|
|
|
|
|
|||||
| Total liabilities and equity |
$ | 2,023,376 | $ | 1,985,892 | ||||
|
|
|
|
|
|||||
Page 17
Freddie Mac
Non-GAAP Reconciliations
$ Millions, Pre-Tax
| Reconciliation of GAAP Net Interest Income to Adjusted Net Interest Income | ||||||||||||||||||||||||||
| 1Q 2016 |
2Q 2016 |
3Q 2016 |
4Q 2016 |
2015 | 2016 | |||||||||||||||||||||
| 1 | GAAP Net Interest Income | $ | 3,405 | $ | 3,443 | $ | 3,646 | $ | 3,885 | $ | 14,946 | $ | 14,379 | |||||||||||||
| Reclassifications: | ||||||||||||||||||||||||||
| 2 | Guarantee fee income reclassified out of net interest income (1), (2) | (1,555 | ) | (1,781 | ) | (1,935 | ) | (1,970 | ) | (6,089 | ) | (7,241 | ) | |||||||||||||
| 3 | Accrual of periodic cash settlements reclassified into net interest income (3) | (490 | ) | (420 | ) | (416 | ) | (434 | ) | (2,198 | ) | (1,760 | ) | |||||||||||||
| 4 | Amortization of options reclassified into net interest income (4) | (281 | ) | (318 | ) | (402 | ) | (347 | ) | (763 | ) | (1,348 | ) | |||||||||||||
| 5 | Other reclassifications (5) | (78 | ) | (35 | ) | (106 | ) | (325 | ) | (945 | ) | (544 | ) | |||||||||||||
|
|
|
|
|
|
|
|
|
|
|
|
|
|||||||||||||||
| 6 | Total reclassifications | $ | (2,404 | ) | $ | (2,554 | ) | $ | (2,859 | ) | $ | (3,076 | ) | $ | (9,995 | ) | $ | (10,893 | ) | |||||||
|
|
|
|
|
|
|
|
|
|
|
|
|
|||||||||||||||
| 7 | Adjusted Net Interest Income | $ | 1,001 | $ | 889 | $ | 787 | $ | 809 | $ | 4,951 | $ | 3,486 | |||||||||||||
|
|
|
|
|
|
|
|
|
|
|
|
|
|||||||||||||||
|
Reconciliation of GAAP Guarantee Fee Income* to Adjusted Guarantee Fee Income |
||||||||||||||||||||||||||
| 1Q 2016 |
2Q 2016 |
3Q 2016 |
4Q 2016 |
2015 | 2016 | |||||||||||||||||||||
| 8 | GAAP Guarantee Fee Income* | $ | 110 | $ | 124 | $ | 133 | $ | 146 | $ | 369 | $ | 513 | |||||||||||||
| Reclassifications: | ||||||||||||||||||||||||||
| 9 | Guarantee fee income reclassified from net interest income (1), (2) | 1,555 | 1,781 | 1,935 | 1,970 | 6,089 | 7,241 | |||||||||||||||||||
| 10 | Temporary Payroll Tax Cut Continuation Act of 2011 expense reclassified from other non-interest expense (6) | (272 | ) | (280 | ) | (293 | ) | (307 | ) | (967 | ) | (1,152 | ) | |||||||||||||
|
|
|
|
|
|
|
|
|
|
|
|
|
|||||||||||||||
| 11 | Total reclassifications | 1,283 | 1,501 | 1,642 | 1,663 | 5,122 | 6,089 | |||||||||||||||||||
|
|
|
|
|
|
|
|
|
|
|
|
|
|||||||||||||||
| 12 | Adjusted Guarantee Fee Income | $ | 1,393 | $ | 1,625 | $ | 1,775 | $ | 1,809 | $ | 5,491 | $ | 6,602 | |||||||||||||
|
|
|
|
|
|
|
|
|
|
|
|
|
|||||||||||||||
|
Reconciliation of GAAP Benefit (Provision) for Credit Losses to Adjusted Benefit (Provision) for Credit Losses |
||||||||||||||||||||||||||
| 1Q 2016 |
2Q 2016 |
3Q 2016 |
4Q 2016 |
2015 | 2016 | |||||||||||||||||||||
| 13 | GAAP Benefit (Provision) for Credit Losses | $ | 467 | $ | 775 | $ | (113 | ) | $ | (326 | ) | $ | 2,665 | $ | 803 | |||||||||||
| Reclassifications: | ||||||||||||||||||||||||||
| 14 | Mortgage loans reclassified from held-for-investment to held-for-sale (7) | (64 | ) | (509 | ) | (59 | ) | (180 | ) | (2,314 | ) | (812 | ) | |||||||||||||
| 15 | Other reclassifications (8) | (109 | ) | (139 | ) | (117 | ) | (121 | ) | (608 | ) | (486 | ) | |||||||||||||
|
|
|
|
|
|
|
|
|
|
|
|
|
|||||||||||||||
| 16 | Total reclassifications | (173 | ) | (648 | ) | (176 | ) | (301 | ) | (2,922 | ) | (1,298 | ) | |||||||||||||
|
|
|
|
|
|
|
|
|
|
|
|
|
|||||||||||||||
| 17 | Adjusted Benefit (Provision) for Credit Losses | $ | 294 | $ | 127 | $ | (289 | ) | $ | (627 | ) | $ | (257 | ) | $ | (495 | ) | |||||||||
|
|
|
|
|
|
|
|
|
|
|
|
|
|||||||||||||||
* Guarantee fee income on a GAAP basis is included in Other income (loss) on Freddie Mac’s consolidated statements of comprehensive income.
Note: Columns may not add due to rounding.
For notes on reclassifications, see page 19 of this press release.
Page 18
Freddie Mac
Notes on Non-GAAP Financial Measures
Fourth Quarter 2016 Financial Results
Notes on Significant Reclassifications
(1) Net guarantee fees are reclassified from GAAP net interest income to adjusted guarantee fee income.
(2) Implied guarantee fee income related to unsecuritized loans held in the mortgage investments portfolio is reclassified from GAAP net interest income to adjusted guarantee fee income.
(3) The accrual of periodic cash settlements of all derivatives is reclassified from GAAP derivative gains (losses) into adjusted net interest income to fully reflect the periodic cost associated with the protection provided by these contracts.
(4) Up-front cash paid or received upon the purchase or writing of swaptions and other option contracts is reclassified prospectively on a straight-line basis from GAAP derivative gains (losses) into adjusted net interest income over the contractual life of the instrument to fully reflect the periodic cost associated with the protection provided by these contracts.
(5) Other reclassifications primarily relate to items reclassified out of GAAP net interest income, including the amortization of premiums and discounts associated with the company’s PCs and the loans underlying those PCs, amortization of non-cash premiums on single-family loans in trusts and on consolidated PCs, amortization of discounts on loans purchased with deteriorated credit quality that are on accrual status, the accretion of other-than-temporary impairments on available-for-sale securities, STACR debt note expense and net float income or expense.
(6) The expense related to the Temporary Payroll Tax Cut Continuation Act of 2011 is reclassified from GAAP other non-interest expense to adjusted guarantee fee income. As a result of the reclassification, the revenue and expense related to the legislated 10 basis point increase are netted within adjusted guarantee fee income.
(7) The impact from the reclassification of seasoned single-family mortgage loans from held-for-investment to held-for-sale is not included in adjusted benefit (provision) for credit losses.
(8) Other reclassifications primarily reflect interest rate concession adjustments related to the company’s modified loan population, which are reclassified from GAAP benefit (provision) for credit losses to adjusted net interest income.
Page 19