Attached files
| file | filename |
|---|---|
| 8-K - ANNALY CAPITAL MANAGEMENT, INC. 8-K - ANNALY CAPITAL MANAGEMENT INC | a51510358.htm |
| EX-99.1 - EXHIBIT 99.1 - ANNALY CAPITAL MANAGEMENT INC | a51510358ex99_1.htm |
Exhibit 99.2

February 15, 2017 Fourth Quarter 2016 Financial Summary
This presentation, other written or oral communications, and our public documents to which we refer contain or incorporate by reference certain forward-looking statements which are based on various assumptions (some of which are beyond our control) and may be identified by reference to a future period or periods or by the use of forward-looking terminology, such as “may,” “will,” “believe,” “expect,” “anticipate,” “continue,” or similar terms or variations on those terms or the negative of those terms. Actual results could differ materially from those set forth in forward-looking statements due to a variety of factors, including, but not limited to, changes in interest rates; changes in the yield curve; changes in prepayment rates; the availability of mortgage-backed securities and other securities for purchase; the availability of financing and, if available, the terms of any financings; changes in the market value of our assets; changes in business conditions and the general economy; our ability to grow our commercial business; our ability to grow our residential mortgage credit business; credit risks related to our investments in credit risk transfer securities, residential mortgage-backed securities and related residential mortgage credit assets, commercial real estate assets and corporate debt; risks related to investments in mortgage servicing rights and ownership of a servicer; our ability to consummate any contemplated investment opportunities; changes in government regulations affecting our business; our ability to maintain our qualification as a REIT; and our ability to maintain our exemption from registration under the Investment Company Act of 1940, as amended. For a discussion of the risks and uncertainties which could cause actual results to differ from those contained in the forward-looking statements, see “Risk Factors” in our most recent Annual Report on Form 10-K and any subsequent Quarterly Reports on Form 10-Q. We do not undertake, and specifically disclaim any obligation, to publicly release the result of any revisions which may be made to any forward-looking statements to reflect the occurrence of anticipated or unanticipated events or circumstances after the date of such statements, except as required by law.Non-GAAP Financial MeasuresThis presentation includes certain non-GAAP financial measures. Based upon recent regulatory guidance and interpretations on the use of non-GAAP financial measures, beginning with the fourth quarter 2016, the Company will report core earnings metrics (revised) that include the PAA. In addition, this is the final quarter that the Company will report core earnings metrics (unrevised) that exclude the PAA. In future periods, the Company will not make an adjustment to GAAP net income (loss) to exclude the PAA. However, given its usefulness in evaluating the Company’s financial performance, the Company will continue to separately disclose the PAA. Additionally, comparative prior period results reported in future periods will conform to the revised presentation.The Company believes its non-GAAP financial measures are useful for management, investors, analysts, and other interested parties in evaluating the Company’s performance but should not be viewed in isolation and are not a substitute for financial measures computed in accordance with GAAP. Please see the section entitled “Non-GAAP Reconciliations” in the attached Appendix for a reconciliation to the most directly comparable GAAP financial measures. A reconciliation of GAAP net income (loss) to non-GAAP core earnings is provided on page 7 of this financial summary. Safe Harbor Notice
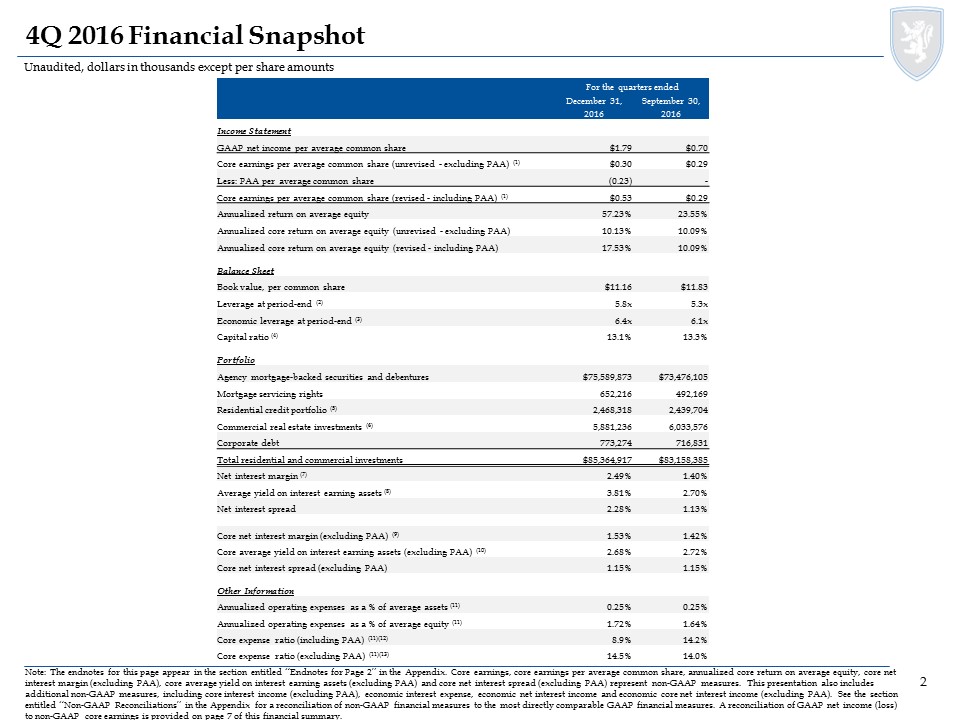
Note: The endnotes for this page appear in the section entitled “Endnotes for Page 2” in the Appendix. Core earnings, core earnings per average common share, annualized core return on average equity, core net interest margin (excluding PAA), core average yield on interest earning assets (excluding PAA) and core net interest spread (excluding PAA) represent non-GAAP measures. This presentation also includes additional non-GAAP measures, including core interest income (excluding PAA), economic interest expense, economic net interest income and economic core net interest income (excluding PAA). See the section entitled “Non-GAAP Reconciliations” in the Appendix for a reconciliation of non-GAAP financial measures to the most directly comparable GAAP financial measures. A reconciliation of GAAP net income (loss) to non-GAAP core earnings is provided on page 7 of this financial summary. 4Q 2016 Financial Snapshot Unaudited, dollars in thousands except per share amounts For the quarters ended December 31, September 30, 2016 2016 Income Statement GAAP net income per average common share $1.79 $0.70 Core earnings per average common share (unrevised - excluding PAA) (1) $0.30 $0.29 Less: PAA per average common share (0.23) - Core earnings per average common share (revised - including PAA) (1) $0.53 $0.29 Annualized return on average equity 57.23% 23.55% Annualized core return on average equity (unrevised - excluding PAA) 10.13% 10.09% Annualized core return on average equity (revised - including PAA) 17.53% 10.09% Balance Sheet Book value, per common share $11.16 $11.83 Leverage at period-end (2) 5.8x 5.3x Economic leverage at period-end (3) 6.4x 6.1x Capital ratio (4) 13.1% 13.3% Portfolio Agency mortgage-backed securities and debentures $75,589,873 $73,476,105 Mortgage servicing rights 652,216 492,169 Residential credit portfolio (5) 2,468,318 2,439,704 Commercial real estate investments (6) 5,881,236 6,033,576 Corporate debt 773,274 716,831 Total residential and commercial investments $85,364,917 $83,158,385 Net interest margin (7) 2.49% 1.40% Average yield on interest earning assets (8) 3.81% 2.70% Net interest spread 2.28% 1.13% Core net interest margin (excluding PAA) (9) 1.53% 1.42% Core average yield on interest earning assets (excluding PAA) (10) 2.68% 2.72% Core net interest spread (excluding PAA) 1.15% 1.15% Other Information Annualized operating expenses as a % of average assets (11) 0.25% 0.25% Annualized operating expenses as a % of average equity (11) 1.72% 1.64% Core expense ratio (including PAA) (11)(12) 8.9% 14.2% Core expense ratio (excluding PAA) (11)(13) 14.5% 14.0%
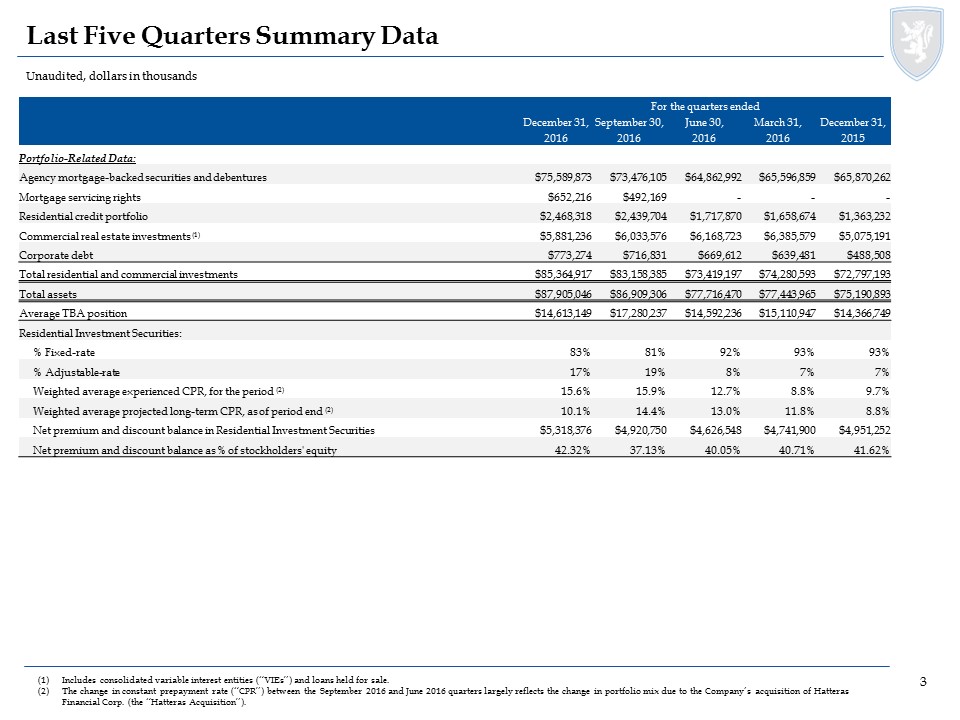
Unaudited, dollars in thousands Last Five Quarters Summary Data Includes consolidated variable interest entities (“VIEs”) and loans held for sale.The change in constant prepayment rate (“CPR”) between the September 2016 and June 2016 quarters largely reflects the change in portfolio mix due to the Company’s acquisition of Hatteras Financial Corp. (the “Hatteras Acquisition”). For the quarters ended December 31, September 30, June 30, March 31, December 31, 2016 2016 2016 2016 2015 Portfolio-Related Data: Agency mortgage-backed securities and debentures $75,589,873 $73,476,105 $64,862,992 $65,596,859 $65,870,262 Mortgage servicing rights $652,216 $492,169 - - - Residential credit portfolio $2,468,318 $2,439,704 $1,717,870 $1,658,674 $1,363,232 Commercial real estate investments (1) $5,881,236 $6,033,576 $6,168,723 $6,385,579 $5,075,191 Corporate debt $773,274 $716,831 $669,612 $639,481 $488,508 Total residential and commercial investments $85,364,917 $83,158,385 $73,419,197 $74,280,593 $72,797,193 Total assets $87,905,046 $86,909,306 $77,716,470 $77,443,965 $75,190,893 Average TBA position $14,613,149 $17,280,237 $14,592,236 $15,110,947 $14,366,749 Residential Investment Securities: % Fixed-rate 83% 81% 92% 93% 93% % Adjustable-rate 17% 19% 8% 7% 7% Weighted average experienced CPR, for the period (2) 15.6% 15.9% 12.7% 8.8% 9.7% Weighted average projected long-term CPR, as of period end (2) 10.1% 14.4% 13.0% 11.8% 8.8% Net premium and discount balance in Residential Investment Securities $5,318,376 $4,920,750 $4,626,548 $4,741,900 $4,951,252 Net premium and discount balance as % of stockholders' equity 42.32% 37.13% 40.05% 40.71% 41.62%
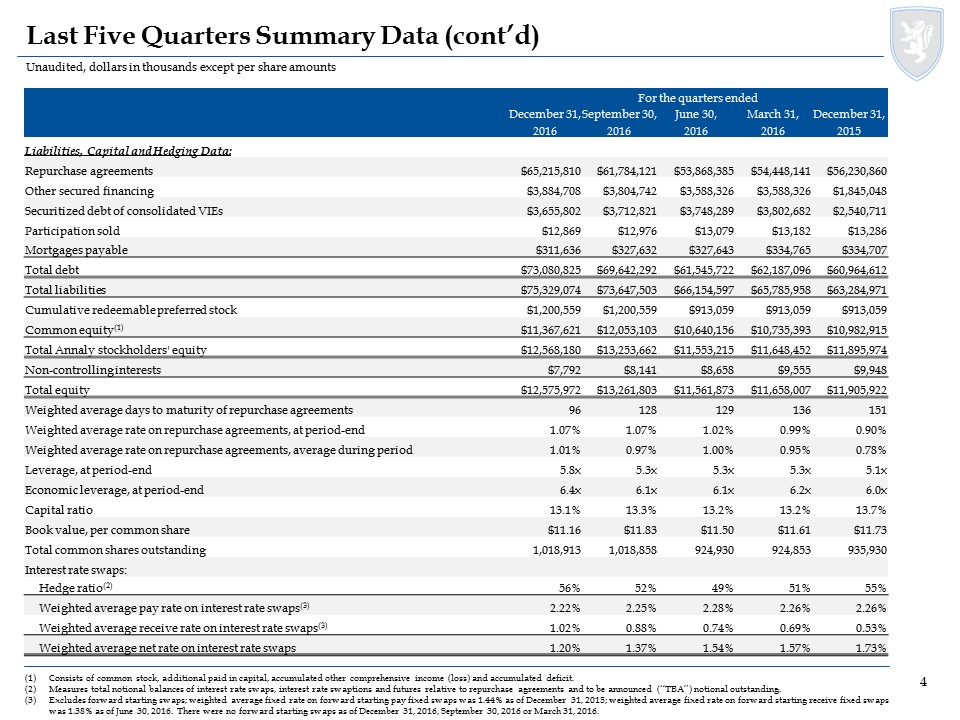
Unaudited, dollars in thousands except per share amounts Last Five Quarters Summary Data (cont’d) Consists of common stock, additional paid in capital, accumulated other comprehensive income (loss) and accumulated deficit.Measures total notional balances of interest rate swaps, interest rate swaptions and futures relative to repurchase agreements and to be announced (“TBA”) notional outstanding.Excludes forward starting swaps; weighted average fixed rate on forward starting pay fixed swaps was 1.44% as of December 31, 2015; weighted average fixed rate on forward starting receive fixed swaps was 1.38% as of June 30, 2016. There were no forward starting swaps as of December 31, 2016, September 30, 2016 or March 31, 2016. For the quarters ended December 31, September 30, June 30, March 31, December 31, 2016 2016 2016 2016 2015 Liabilities, Capital and Hedging Data: Repurchase agreements $65,215,810 $61,784,121 $53,868,385 $54,448,141 $56,230,860 Other secured financing $3,884,708 $3,804,742 $3,588,326 $3,588,326 $1,845,048 Securitized debt of consolidated VIEs $3,655,802 $3,712,821 $3,748,289 $3,802,682 $2,540,711 Participation sold $12,869 $12,976 $13,079 $13,182 $13,286 Mortgages payable $311,636 $327,632 $327,643 $334,765 $334,707 Total debt $73,080,825 $69,642,292 $61,545,722 $62,187,096 $60,964,612 Total liabilities $75,329,074 $73,647,503 $66,154,597 $65,785,958 $63,284,971 Cumulative redeemable preferred stock $1,200,559 $1,200,559 $913,059 $913,059 $913,059 Common equity(1) $11,367,621 $12,053,103 $10,640,156 $10,735,393 $10,982,915 Total Annaly stockholders' equity $12,568,180 $13,253,662 $11,553,215 $11,648,452 $11,895,974 Non-controlling interests $7,792 $8,141 $8,658 $9,555 $9,948 Total equity $12,575,972 $13,261,803 $11,561,873 $11,658,007 $11,905,922 Weighted average days to maturity of repurchase agreements 96 128 129 136 151 Weighted average rate on repurchase agreements, at period-end 1.07% 1.07% 1.02% 0.99% 0.90% Weighted average rate on repurchase agreements, average during period 1.01% 0.97% 1.00% 0.95% 0.78% Leverage, at period-end 5.8x 5.3x 5.3x 5.3x 5.1x Economic leverage, at period-end 6.4x 6.1x 6.1x 6.2x 6.0x Capital ratio 13.1% 13.3% 13.2% 13.2% 13.7% Book value, per common share $11.16 $11.83 $11.50 $11.61 $11.73 Total common shares outstanding 1,018,913 1,018,858 924,930 924,853 935,930 Interest rate swaps: Hedge ratio(2) 56% 52% 49% 51% 55% Weighted average pay rate on interest rate swaps(3) 2.22% 2.25% 2.28% 2.26% 2.26% Weighted average receive rate on interest rate swaps(3) 1.02% 0.88% 0.74% 0.69% 0.53% Weighted average net rate on interest rate swaps 1.20% 1.37% 1.54% 1.57% 1.73%

Unaudited, dollars in thousands except per share amounts Last Five Quarters Summary Data (cont’d) Includes interest expense on interest rate swaps used to hedge cost of funds. Excludes interest expense on interest rate swaps used to hedge TBA dollar rolls. For the quarters ended December 31, September 30, June 30, March 31, December 31, 2016 2016 2016 2016 2015 Performance-Related Data: Total interest income $807,022 $558,668 $457,118 $388,143 $576,580 Total interest expense $183,396 $174,154 $152,755 $147,447 $118,807 Net interest income $623,626 $384,514 $304,363 $240,696 $457,773 Total economic interest expense (1) $276,237 $277,254 $261,056 $270,571 $254,074 Economic net interest income (1) $530,785 $281,414 $196,062 $117,572 $322,506 Total core interest income (excluding PAA) $568,081 $562,559 $542,701 $556,551 $558,508 Economic core net interest income (excluding PAA) (1) $291,844 $285,305 $281,645 $285,980 $304,434 GAAP net income (loss) $1,848,483 $730,880 ($278,497) ($868,080) $669,666 GAAP net income (loss) available (related) to common shareholders $1,825,097 $708,413 ($296,104) ($885,910) $652,047 GAAP net income (loss) per average common share $1.79 $0.70 ($0.32) ($0.96) $0.69 Core earnings (unrevised - excluding PAA) $326,999 $312,893 $282,176 $291,757 $311,133 Core earnings available to common shareholders (unrevised - excluding PAA) $303,526 $290,090 $264,184 $273,765 $293,141 Core earnings per average common share (unrevised - excluding PAA) $0.30 $0.29 $0.29 $0.30 $0.31 Core earnings (revised - including PAA) $565,940 $309,002 $196,593 $123,349 $329,205 Core earnings available to common shareholders (revised - including PAA) $542,467 $286,199 $178,601 $105,357 $311,213 Core earnings per average common share (revised - including PAA) $0.53 $0.29 $0.19 $0.11 $0.33 Dividends declared per common share $0.30 $0.30 $0.30 $0.30 $0.30 Total common and preferred dividends declared $329,147 $325,091 $295,471 $295,448 $298,771 Annualized return (loss) on average equity 57.23% 23.55% (9.60%) (29.47%) 22.15% Annualized return (loss) on average equity per unit of economic leverage 8.94% 3.86% (1.57%) (4.75%) 3.69% Annualized core return on average equity (unrevised - excluding PAA) 10.13% 10.09% 9.73% 9.91% 10.30% Annualized core return on average equity per unit of economic leverage (unrevised - excluding PAA) 1.58% 1.65% 1.60% 1.60% 1.72% Annualized core return on average equity (revised - including PAA) 17.53% 10.09% 6.78% 4.19% 10.89% Annualized core return on average equity per unit of economic leverage (revised - including PAA) 2.74% 1.65% 1.11% 0.68% 1.82% Net interest margin 2.49% 1.40% 1.15% 0.79% 1.80% Core net interest margin (excluding PAA) 1.53% 1.42% 1.54% 1.54% 1.71% Average yield on interest earning assets 3.81% 2.70% 2.48% 2.09% 3.15% Core average yield on interest earning assets (excluding PAA) 2.68% 2.72% 2.95% 3.00% 3.05% Average cost of interest bearing liabilities 1.53% 1.57% 1.68% 1.73% 1.68% Net interest spread 2.28% 1.13% 0.80% 0.36% 1.47% Core net interest spread (excluding PAA) 1.15% 1.15% 1.27% 1.27% 1.37%

Unaudited, dollars in thousands Components of Economic Net Interest Income Included within realized losses on interest rate swaps. Excludes interest expense on interest rate swaps used to hedge TBA dollar rolls. For the quarters ended December 31, September 30, June 30, March 31, December 31, 2016 2016 2016 2016 2015 Interest income: Residential Investment Securities $740,664 $493,226 $394,850 $315,717 $515,195 Residential mortgage loans 2,539 1,608 - - - Commercial investment portfolio 61,431 61,240 59,578 70,187 60,835 Reverse repurchase agreements 2,388 2,594 2,690 2,239 550 Total interest income $807,022 $558,668 $457,118 $388,143 $576,580 Economic interest expense: Repurchase agreements $162,676 $154,083 $136,176 $132,891 $112,529 Interest expense on swaps used to hedge cost of funds(1) 92,841 103,100 108,301 123,124 135,267 Securitized debt of consolidated VIEs 12,087 12,046 11,226 9,033 5,597 Participation sold 155 157 157 158 160 Other 8,478 7,868 5,196 5,365 521 Total economic interest expense $276,237 $277,254 $261,056 $270,571 $254,074 Economic net interest income $530,785 $281,414 $196,062 $117,572 $322,506 Premium amortization adjustment cost (benefit) (238,941) 3,891 85,583 168,408 (18,072) Economic core net interest income (excluding PAA) $291,844 $285,305 $281,645 $285,980 $304,434

Unaudited, dollars in thousands Reconciliations and Changes in Key Metrics Represents transaction costs incurred in connection with the Hatteras Acquisition.Represents a component of Net gains (losses) on trading assets.Represents a component of Net unrealized gains (losses) on investments measured at fair value through earnings. For the quarters ended December 31, September 30, June 30, March 31, December 31, 2016 2016 2016 2016 2015 Core earnings reconciliation GAAP net income (loss) $1,848,483 $730,880 ($278,497) ($868,080) $669,666 Less: Realized (gains) losses on termination of interest rate swaps 55,214 (1,337) 60,064 - - Unrealized (gains) losses on interest rate swaps (1,430,668) (256,462) 373,220 1,031,720 (463,126) Net (gains) losses on disposal of investments (7,782) (14,447) (12,535) 1,675 7,259 Net (gains) losses on trading assets 139,470 (162,981) (81,880) (125,189) (42,584) Net unrealized (gains) losses on investments measured at fair value through earnings (110,742) (29,675) 54,154 (128) 62,703 Bargain purchase gain - (72,576) - - - Corporate acquisition related expenses(1) - 46,724 2,163 - - Net (income) loss attributable to noncontrolling interest 87 336 385 162 373 Premium amortization adjustment cost (benefit) (238,941) 3,891 85,583 168,408 (18,072) Plus: TBA dollar roll income(2) 98,896 90,174 79,519 83,189 94,914 MSR amortization(3) (27,018) (21,634) - - - Core earnings (unrevised - excluding PAA) $326,999 $312,893 $282,176 $291,757 $311,133 Add back: Premium amortization adjustment benefit (cost) 238,941 (3,891) (85,583) (168,408) 18,072 Core earnings (revised - including PAA) $565,940 $309,002 $196,593 $123,349 $329,205 Book value, per common share rollforward: Book value, per common share, beginning of period $11.83 $11.50 $11.61 $11.73 $11.99 Net income (loss) attributable to common stockholders 1.79 0.70 (0.32) (0.96) 0.69 Other comprehensive income (loss) attributable to common stockholders (2.16) 0.00 0.51 1.11 (0.68) Common dividends declared (0.30) (0.30) (0.30) (0.30) (0.30) Issuance of common stock 0.00 (0.07) 0.00 0.00 0.00 Buyback of common stock 0.00 0.00 0.00 0.03 0.03 Book value, per common share, end of period $11.16 $11.83 $11.50 $11.61 $11.73
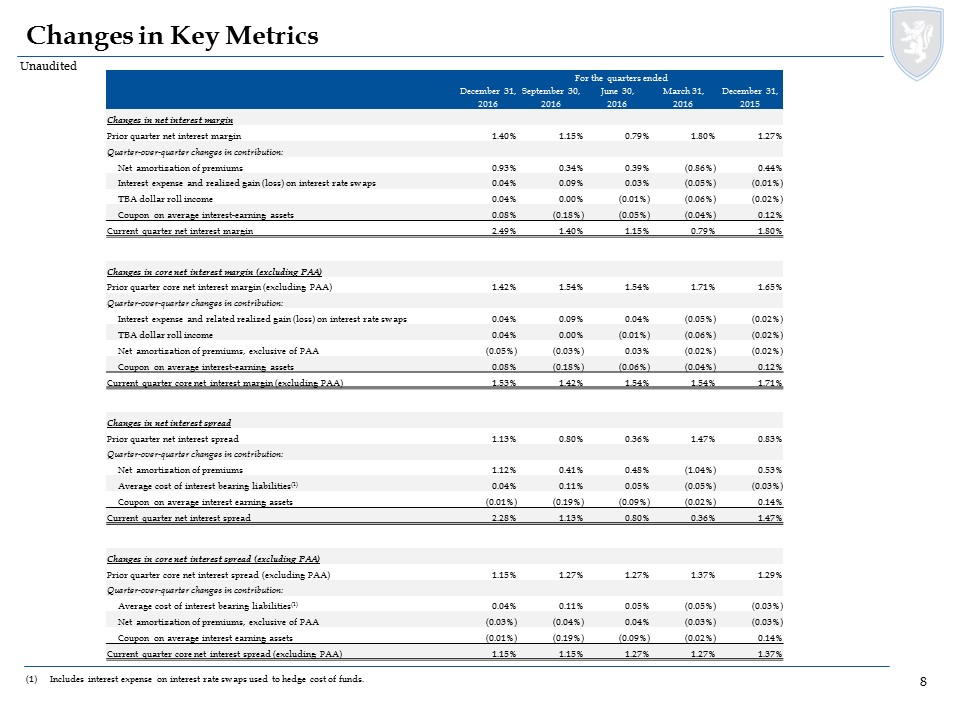
Unaudited Changes in Key Metrics Includes interest expense on interest rate swaps used to hedge cost of funds. For the quarters ended December 31, September 30, June 30, March 31, December 31, 2016 2016 2016 2016 2015 Changes in net interest margin Prior quarter net interest margin 1.40% 1.15% 0.79% 1.80% 1.27% Quarter-over-quarter changes in contribution: Net amortization of premiums 0.93% 0.34% 0.39% (0.86%) 0.44% Interest expense and realized gain (loss) on interest rate swaps 0.04% 0.09% 0.03% (0.05%) (0.01%) TBA dollar roll income 0.04% 0.00% (0.01%) (0.06%) (0.02%) Coupon on average interest-earning assets 0.08% (0.18%) (0.05%) (0.04%) 0.12% Current quarter net interest margin 2.49% 1.40% 1.15% 0.79% 1.80% Changes in core net interest margin (excluding PAA) Prior quarter core net interest margin (excluding PAA) 1.42% 1.54% 1.54% 1.71% 1.65% Quarter-over-quarter changes in contribution: Interest expense and related realized gain (loss) on interest rate swaps 0.04% 0.09% 0.04% (0.05%) (0.02%) TBA dollar roll income 0.04% 0.00% (0.01%) (0.06%) (0.02%) Net amortization of premiums, exclusive of PAA (0.05%) (0.03%) 0.03% (0.02%) (0.02%) Coupon on average interest-earning assets 0.08% (0.18%) (0.06%) (0.04%) 0.12% Current quarter core net interest margin (excluding PAA) 1.53% 1.42% 1.54% 1.54% 1.71% Changes in net interest spread Prior quarter net interest spread 1.13% 0.80% 0.36% 1.47% 0.83% Quarter-over-quarter changes in contribution: Net amortization of premiums 1.12% 0.41% 0.48% (1.04%) 0.53% Average cost of interest bearing liabilities(1) 0.04% 0.11% 0.05% (0.05%) (0.03%) Coupon on average interest earning assets (0.01%) (0.19%) (0.09%) (0.02%) 0.14% Current quarter net interest spread 2.28% 1.13% 0.80% 0.36% 1.47% Changes in core net interest spread (excluding PAA) Prior quarter core net interest spread (excluding PAA) 1.15% 1.27% 1.27% 1.37% 1.29% Quarter-over-quarter changes in contribution: Average cost of interest bearing liabilities(1) 0.04% 0.11% 0.05% (0.05%) (0.03%) Net amortization of premiums, exclusive of PAA (0.03%) (0.04%) 0.04% (0.03%) (0.03%) Coupon on average interest earning assets (0.01%) (0.19%) (0.09%) (0.02%) 0.14% Current quarter core net interest spread (excluding PAA) 1.15% 1.15% 1.27% 1.27% 1.37%
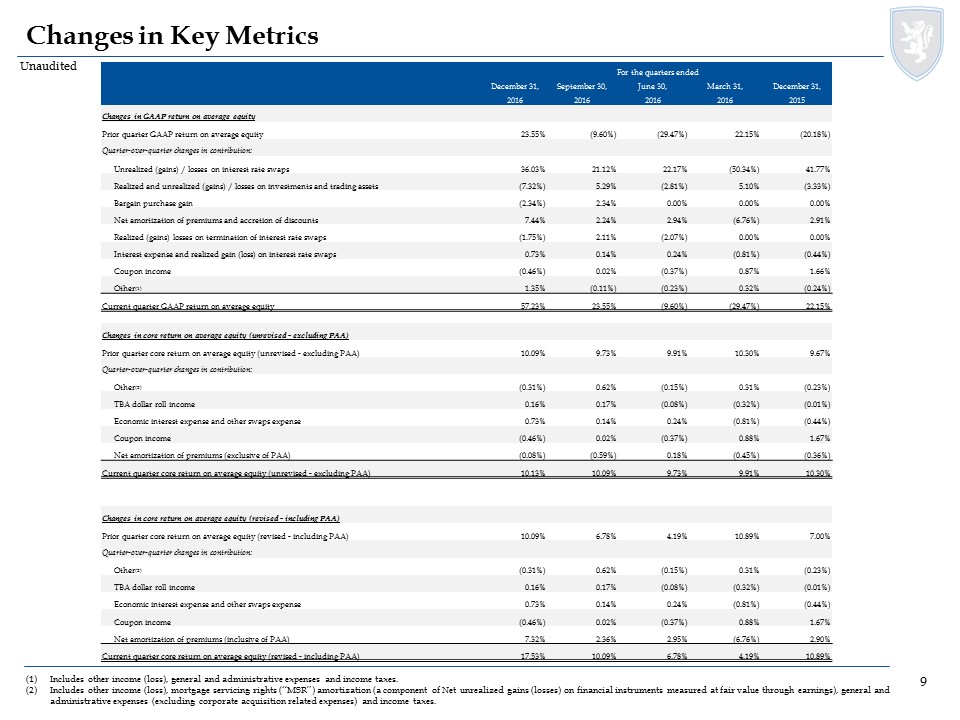
Unaudited Changes in Key Metrics Includes other income (loss), general and administrative expenses and income taxes.Includes other income (loss), mortgage servicing rights (“MSR”) amortization (a component of Net unrealized gains (losses) on financial instruments measured at fair value through earnings), general and administrative expenses (excluding corporate acquisition related expenses) and income taxes. For the quarters ended December 31, September 30, June 30, March 31, December 31, 2016 2016 2016 2016 2015 Changes in GAAP return on average equity Prior quarter GAAP return on average equity 23.55% (9.60%) (29.47%) 22.15% (20.18%) Quarter-over-quarter changes in contribution: Unrealized (gains) / losses on interest rate swaps 36.03% 21.12% 22.17% (50.34%) 41.77% Realized and unrealized (gains) / losses on investments and trading assets (7.32%) 5.29% (2.81%) 5.10% (3.33%) Bargain purchase gain (2.34%) 2.34% 0.00% 0.00% 0.00% Net amortization of premiums and accretion of discounts 7.44% 2.24% 2.94% (6.76%) 2.91% Realized (gains) losses on termination of interest rate swaps (1.75%) 2.11% (2.07%) 0.00% 0.00% Interest expense and realized gain (loss) on interest rate swaps 0.73% 0.14% 0.24% (0.81%) (0.44%) Coupon income (0.46%) 0.02% (0.37%) 0.87% 1.66% Other(1) 1.35% (0.11%) (0.23%) 0.32% (0.24%) Current quarter GAAP return on average equity 57.23% 23.55% (9.60%) (29.47%) 22.15% Changes in core return on average equity (unrevised - excluding PAA) Prior quarter core return on average equity (unrevised - excluding PAA) 10.09% 9.73% 9.91% 10.30% 9.67% Quarter-over-quarter changes in contribution: Other(2) (0.31%) 0.62% (0.15%) 0.31% (0.23%) TBA dollar roll income 0.16% 0.17% (0.08%) (0.32%) (0.01%) Economic interest expense and other swaps expense 0.73% 0.14% 0.24% (0.81%) (0.44%) Coupon income (0.46%) 0.02% (0.37%) 0.88% 1.67% Net amortization of premiums (exclusive of PAA) (0.08%) (0.59%) 0.18% (0.45%) (0.36%) Current quarter core return on average equity (unrevised - excluding PAA) 10.13% 10.09% 9.73% 9.91% 10.30% Changes in core return on average equity (revised - including PAA) Prior quarter core return on average equity (revised - including PAA) 10.09% 6.78% 4.19% 10.89% 7.00% Quarter-over-quarter changes in contribution: Other(2) (0.31%) 0.62% (0.15%) 0.31% (0.23%) TBA dollar roll income 0.16% 0.17% (0.08%) (0.32%) (0.01%) Economic interest expense and other swaps expense 0.73% 0.14% 0.24% (0.81%) (0.44%) Coupon income (0.46%) 0.02% (0.37%) 0.88% 1.67% Net amortization of premiums (inclusive of PAA) 7.32% 2.36% 2.95% (6.76%) 2.90% Current quarter core return on average equity (revised - including PAA) 17.53% 10.09% 6.78% 4.19% 10.89%

Unaudited, dollars in thousands Residential Investments and TBA Derivative Overview as of December 31, 2016 Weighted by face value.Weighted by notional value. Agency Fixed-Rate Securities (Pools) Weighted Avg. Current Weighted Avg. Weighted Avg. Weighted Avg. Weighted Avg. Estimated Years to Maturity Face Value % (1) Coupon Amortized Cost Fair Value 3-Month CPR Fair Value <=15 years $7,269,580 12.0% 3.12% 103.7% 103.2% 11.1% $7,503,147 20 years 5,269,476 8.7% 3.49% 104.8% 104.2% 19.4% 5,493,234 >=30 years 48,220,261 79.3% 3.77% 106.4% 104.3% 14.1% 50,314,992 Total/Weighted Avg. $60,759,317 100.0% 3.67% 106.0% 104.2% 14.2% $63,311,373 TBA Purchase Contracts Weighted Avg. Implied Cost Implied Market Type Notional Value % (2) Coupon Basis Value 15-year $4,883,000 43.5% 2.88% $4,992,442 $4,983,494 30-year 6,340,000 56.5% 3.42% 6,503,072 6,453,822 Total/Weighted Avg. $11,223,000 100.0% 3.19% $11,495,514 $11,437,316 Agency Adjustable-Rate Securities Weighted Avg. Current Weighted Avg. Weighted Avg. Weighted Avg. Weighted Avg. Estimated Months to Reset Face Value % (1) Coupon Amortized Cost Fair Value 3-Month CPR Fair Value 0 - 24 months $4,700,500 44.1% 2.88% 104.0% 104.9% 27.0% $4,929,734 25 - 40 months 3,737,216 35.1% 2.52% 103.3% 102.9% 23.6% 3,845,903 41 - 60 months 877,490 8.2% 2.74% 103.5% 102.0% 23.1% 895,373 61 - 90 months 473,399 4.5% 2.80% 103.7% 102.1% 24.2% 483,181 >90 months 864,504 8.1% 3.02% 103.1% 101.7% 19.3% 879,560 Total/Weighted Avg. $10,653,109 100.0% 2.75% 103.6% 103.6% 24.7% $11,033,751
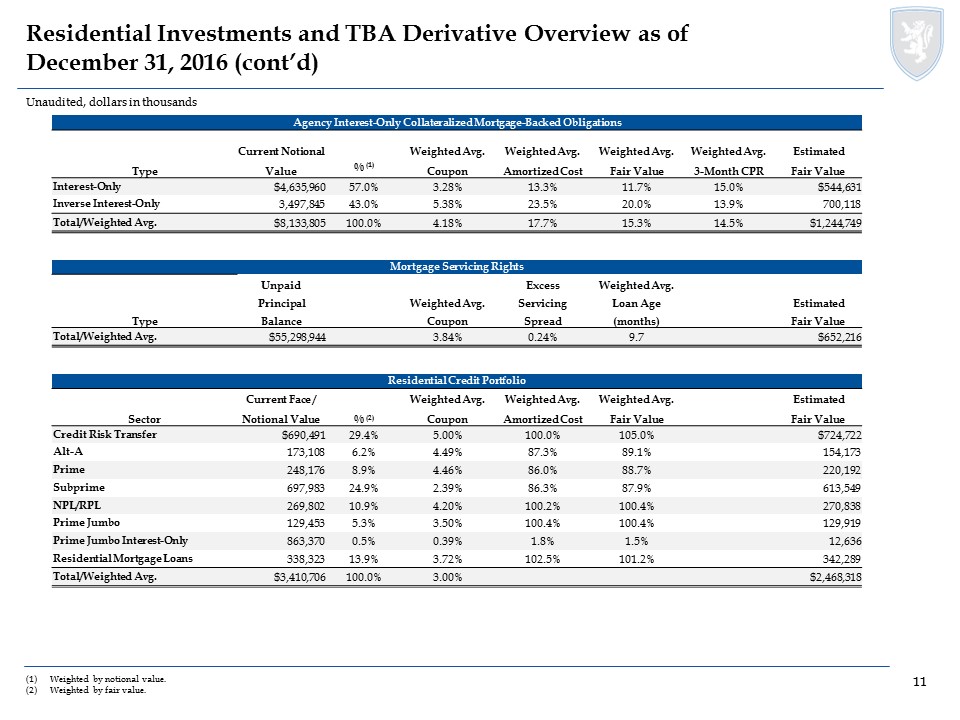
Unaudited, dollars in thousands Residential Investments and TBA Derivative Overview as of December 31, 2016 (cont’d) Weighted by notional value.Weighted by fair value. Agency Interest-Only Collateralized Mortgage-Backed Obligations Current Notional Weighted Avg. Weighted Avg. Weighted Avg. Weighted Avg. Estimated Type Value % (1) Coupon Amortized Cost Fair Value 3-Month CPR Fair Value Interest-Only $4,635,960 57.0% 3.28% 13.3% 11.7% 15.0% $544,631 Inverse Interest-Only 3,497,845 43.0% 5.38% 23.5% 20.0% 13.9% 700,118 Total/Weighted Avg. $8,133,805 100.0% 4.18% 17.7% 15.3% 14.5% $1,244,749 Mortgage Servicing Rights Unpaid Excess Weighted Avg. Principal Weighted Avg. Servicing Loan Age Estimated Type Balance Coupon Spread (months) Fair Value Total/Weighted Avg. $55,298,944 3.84% 0.24% 9.7 $652,216 Residential Credit Portfolio Current Face / Weighted Avg. Weighted Avg. Weighted Avg. Estimated Sector Notional Value % (2) Coupon Amortized Cost Fair Value Fair Value Credit Risk Transfer $690,491 29.4% 5.00% 100.0% 105.0% $724,722 Alt-A 173,108 6.2% 4.49% 87.3% 89.1% 154,173 Prime 248,176 8.9% 4.46% 86.0% 88.7% 220,192 Subprime 697,983 24.9% 2.39% 86.3% 87.9% 613,549 NPL/RPL 269,802 10.9% 4.20% 100.2% 100.4% 270,838 Prime Jumbo 129,453 5.3% 3.50% 100.4% 100.4% 129,919 Prime Jumbo Interest-Only 863,370 0.5% 0.39% 1.8% 1.5% 12,636 Residential Mortgage Loans 338,323 13.9% 3.72% 102.5% 101.2% 342,289 Total/Weighted Avg. $3,410,706 100.0% 3.00% $2,468,318

Residential Credit Investments Detail as of December 31, 2016 (1) Excludes Residential Mortgage Loans. Unaudited, dollars in thousands (1) By Sector Product Product Market Value Coupon Credit Enhancement 60+ Delinquencies 3M VPR Alt-A $154,173 4.49% 8.87% 14.17% 13.52% Prime 220,192 4.46% 1.14% 11.13% 14.08% Subprime 613,549 2.39% 24.47% 21.34% 5.27% Prime Jumbo (>=2010 Vintage) 129,919 3.50% 15.95% 0.12% 20.22% Prime Jumbo (>=2010 Vintage) Interest Only 12,636 0.39% 0.00% 0.07% 27.03% Re-Performing Loan Securitizations 77,887 4.21% 40.36% 20.95% 4.65% Agency Credit Risk Transfer 671,794 4.89% 1.13% 0.19% 23.26% Private Label Credit Risk Transfer 52,928 6.29% 8.41% 2.36% 19.44% Non-Performing Loan Securitizations 192,951 4.20% 52.04% 64.15% 3.00% Total $2,126,029 2.91% 11.48% 11.19% 17.01% Market Value By Sector and Payment Structure Product Senior Subordinate Total Alt-A $58,647 $95,526 $154,173 Prime 33,216 186,976 220,192 Subprime 195,059 418,490 613,549 Prime Jumbo (>=2010 Vintage) 119,759 10,160 129,919 Prime Jumbo (>=2010 Vintage) Interest Only 12,636 - 12,636 Re-Performing Loan Securitizations 65,209 12,678 77,887 Agency Credit Risk Transfer - 671,794 671,794 Private Label Credit Risk Transfer - 52,928 52,928 Non-Performing Loan Securitizations 189,453 3,498 192,951 Total $673,979 $1,452,050 $2,126,029 Market Value By Sector and Bond Coupon Product ARM Fixed Floater Interest Only Total Alt-A $44,822 $91,187 $18,164 $ - $154,173 Prime 107,296 112,896 - - 220,192 Subprime - 66,383 547,166 - 613,549 Prime Jumbo (>=2010 Vintage) 4,704 125,215 - - 129,919 Prime Jumbo (>=2010 Vintage) Interest Only - - - 12,636 12,636 Re-Performing Loan Securitizations - 77,887 - - 77,887 Agency Credit Risk Transfer - - 671,794 - 671,794 Private Label Credit Risk Transfer - - 52,928 - 52,928 Non-Performing Loan Securitizations - 192,951 - - 192,951 Total $156,822 $666,519 $1,290,052 $12,636 $2,126,029
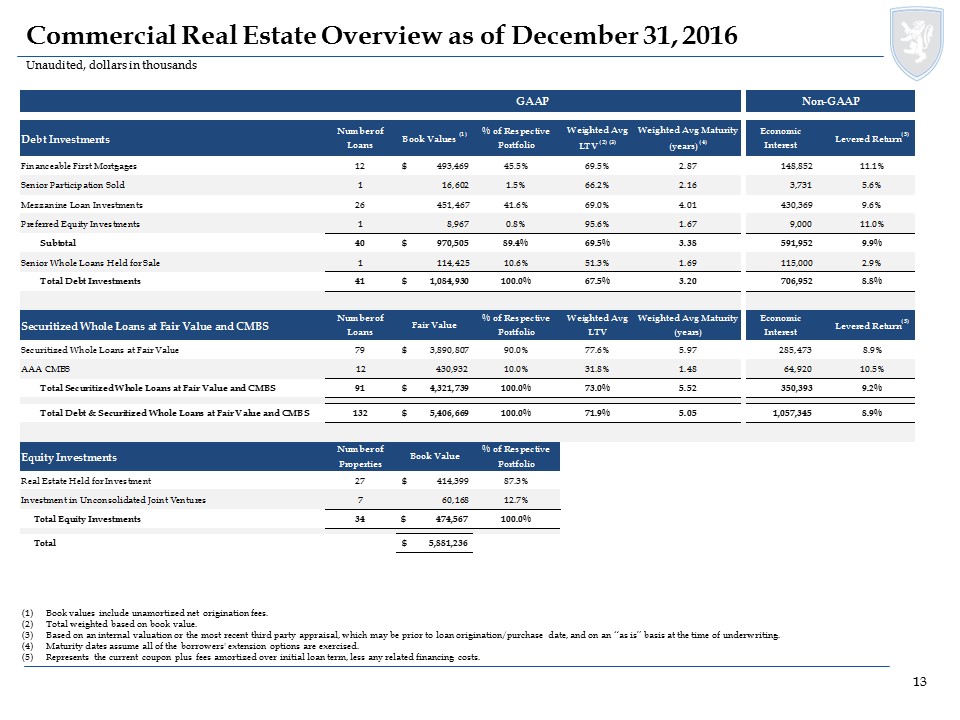
Commercial Real Estate Overview as of December 31, 2016 Book values include unamortized net origination fees.Total weighted based on book value.Based on an internal valuation or the most recent third party appraisal, which may be prior to loan origination/purchase date, and on an “as is” basis at the time of underwriting.Maturity dates assume all of the borrowers' extension options are exercised.Represents the current coupon plus fees amortized over initial loan term, less any related financing costs. Unaudited, dollars in thousands

Middle Market Lending Overview as of December 31, 2016 Unaudited, dollars in thousands Industry Dispersion Industry Fixed Rate Floating Rate Total Aircraft and Parts $ - $ 32,067 $ 32,067 Commercial Fishing - 40,600 40,600 Computer Programming, Data Processing & Other Computer Related Services - 146,547 146,547 Drugs - 34,042 34,042 Groceries and Related Products - 14,856 14,856 Grocery Stores - 23,761 23,761 Home Health Care Services - 39,205 39,205 Insurance Agents, Brokers and Service 4,391 73,267 77,658 Management and Public Relations Services - 16,493 16,493 Medical and Dental Laboratories - 17,292 17,292 Miscellaneous Business Services 84,486 - 84,486 Miscellaneous Health and Allied Services, not elsewhere classified - 9,791 9,791 Miscellaneous Nonmetallic Minerals, except Fuels - 24,688 24,688 Miscellaneous Plastic Products - 27,036 27,036 Motor Vehicles and Motor Vehicle Parts and Supplies - 12,319 12,319 Offices and Clinics of Doctors of Medicine - 83,386 83,386 Personnel Supply Services - 36,921 36,921 Research, Development and Testing Services - 17,744 17,744 Schools and Educational Services, not elsewhere classified - 20,979 20,979 Surgical, Medical, and Dental Instruments and Supplies - 13,403 13,403 Total $ 88,877 $ 684,397 $ 773,274 Size Dispersion Position Size Amount Percentage $0 - $20 million $ 176,869 22.9% $20 - $40 million 268,492 34.7% $40 - $60 million 182,622 23.6% greater than $60 million 145,291 18.8% Total $ 773,274 100.0% Tenor Dispersion Remaining Term Amount Percentage One year or less $ - 0.0% One to three years 17,136 2.2% Three to five years 456,835 59.1% Greater than five years 299,303 38.7% Total $ 773,274 100.0% Lien Position Amount First lien loans $ 505,956 65.4% Second lien loans 178,441 23.1% Second lien notes 84,486 10.9% Subordinated notes 4,391 0.6% Total $ 773,274 100.0%
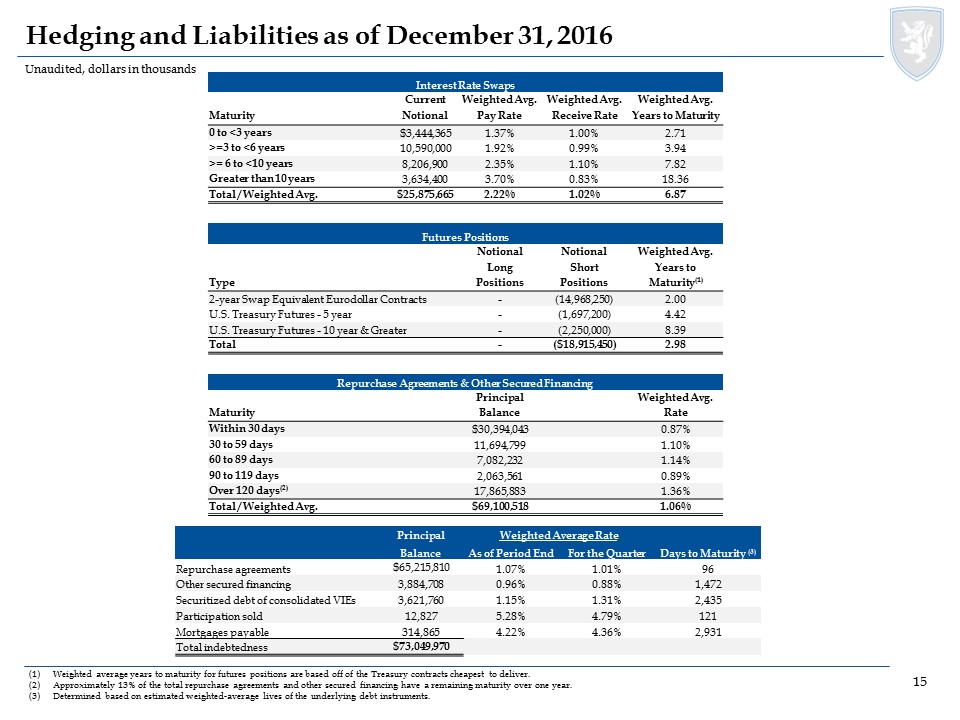
Hedging and Liabilities as of December 31, 2016 Unaudited, dollars in thousands Weighted average years to maturity for futures positions are based off of the Treasury contracts cheapest to deliver.Approximately 13% of the total repurchase agreements and other secured financing have a remaining maturity over one year. Determined based on estimated weighted-average lives of the underlying debt instruments. Interest Rate Swaps Current Weighted Avg. Weighted Avg. Weighted Avg. Maturity Notional Pay Rate Receive Rate Years to Maturity 0 to <3 years $3,444,365 1.37% 1.00% 2.71 >=3 to <6 years 10,590,000 1.92% 0.99% 3.94 >= 6 to <10 years 8,206,900 2.35% 1.10% 7.82 Greater than 10 years 3,634,400 3.70% 0.83% 18.36 Total / Weighted Avg. $25,875,665 2.22% 1.02% 6.87 Futures Positions Notional Notional Weighted Avg. Long Short Years to Type Positions Positions Maturity(1) 2-year Swap Equivalent Eurodollar Contracts - (14,968,250) 2.00 U.S. Treasury Futures - 5 year - (1,697,200) 4.42 U.S. Treasury Futures - 10 year & Greater - (2,250,000) 8.39 Total - ($18,915,450) 2.98 Repurchase Agreements & Other Secured Financing Principal Weighted Avg. Maturity Balance Rate Within 30 days $30,394,043 0.87% 30 to 59 days 11,694,799 1.10% 60 to 89 days 7,082,232 1.14% 90 to 119 days 2,063,561 0.89% Over 120 days(2) 17,865,883 1.36% Total / Weighted Avg. $69,100,518 1.06% Principal Weighted Average Rate Balance As of Period End For the Quarter Days to Maturity (3) Repurchase agreements $65,215,810 1.07% 1.01% 96 Other secured financing 3,884,708 0.96% 0.88% 1,472 Securitized debt of consolidated VIEs 3,621,760 1.15% 1.31% 2,435 Participation sold 12,827 5.28% 4.79% 121 Mortgages payable 314,865 4.22% 4.36% 2,931 Total indebtedness $73,049,970
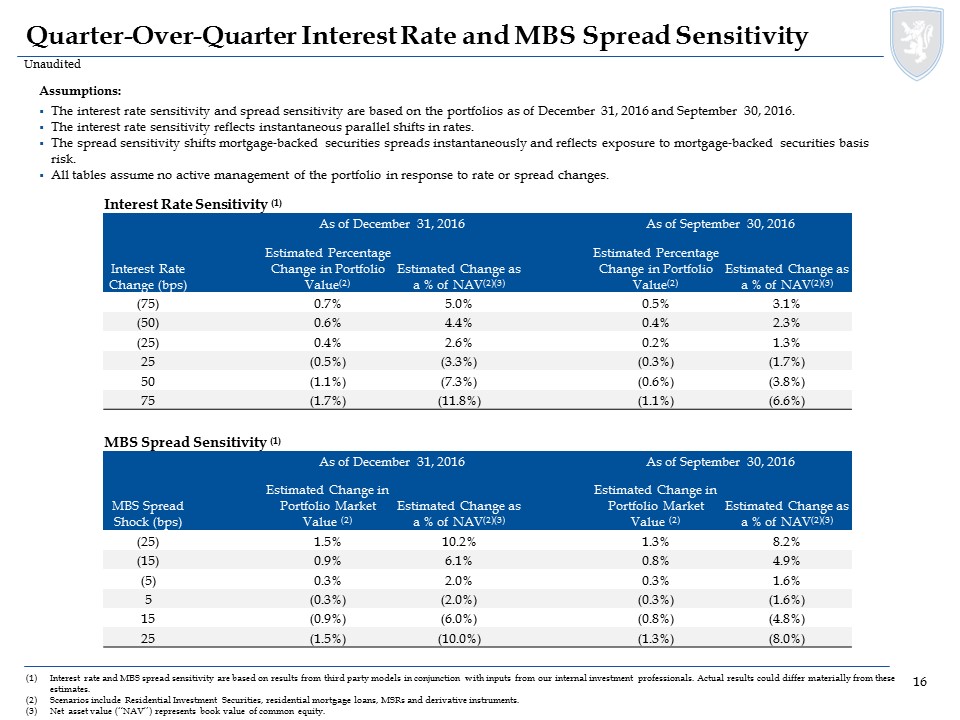
Unaudited Quarter-Over-Quarter Interest Rate and MBS Spread Sensitivity Interest rate and MBS spread sensitivity are based on results from third party models in conjunction with inputs from our internal investment professionals. Actual results could differ materially from these estimates.Scenarios include Residential Investment Securities, residential mortgage loans, MSRs and derivative instruments.Net asset value (“NAV”) represents book value of common equity. Assumptions:The interest rate sensitivity and spread sensitivity are based on the portfolios as of December 31, 2016 and September 30, 2016.The interest rate sensitivity reflects instantaneous parallel shifts in rates.The spread sensitivity shifts mortgage-backed securities spreads instantaneously and reflects exposure to mortgage-backed securities basis risk.All tables assume no active management of the portfolio in response to rate or spread changes. Interest Rate Sensitivity (1) As of December 31, 2016 As of September 30, 2016 Interest Rate Change (bps) Estimated Percentage Change in Portfolio Value(2) Estimated Change as a % of NAV(2)(3) Estimated Percentage Change in Portfolio Value(2) Estimated Change as a % of NAV(2)(3) (75) 0.7% 5.0% 0.5% 3.1% (50) 0.6% 4.4% 0.4% 2.3% (25) 0.4% 2.6% 0.2% 1.3% 25 (0.5%) (3.3%) (0.3%) (1.7%) 50 (1.1%) (7.3%) (0.6%) (3.8%) 75 (1.7%) (11.8%) (1.1%) (6.6%) MBS Spread Sensitivity (1) As of December 31, 2016 As of September 30, 2016 MBS Spread Shock (bps) Estimated Change in Portfolio Market Value (2) Estimated Change as a % of NAV(2)(3) Estimated Change in Portfolio Market Value (2) Estimated Change as a % of NAV(2)(3) (25) 1.5% 10.2% 1.3% 8.2% (15) 0.9% 6.1% 0.8% 4.9% (5) 0.3% 2.0% 0.3% 1.6% 5 (0.3%) (2.0%) (0.3%) (1.6%) 15 (0.9%) (6.0%) (0.8%) (4.8%) 25 (1.5%) (10.0%) (1.3%) (8.0%)

Appendix
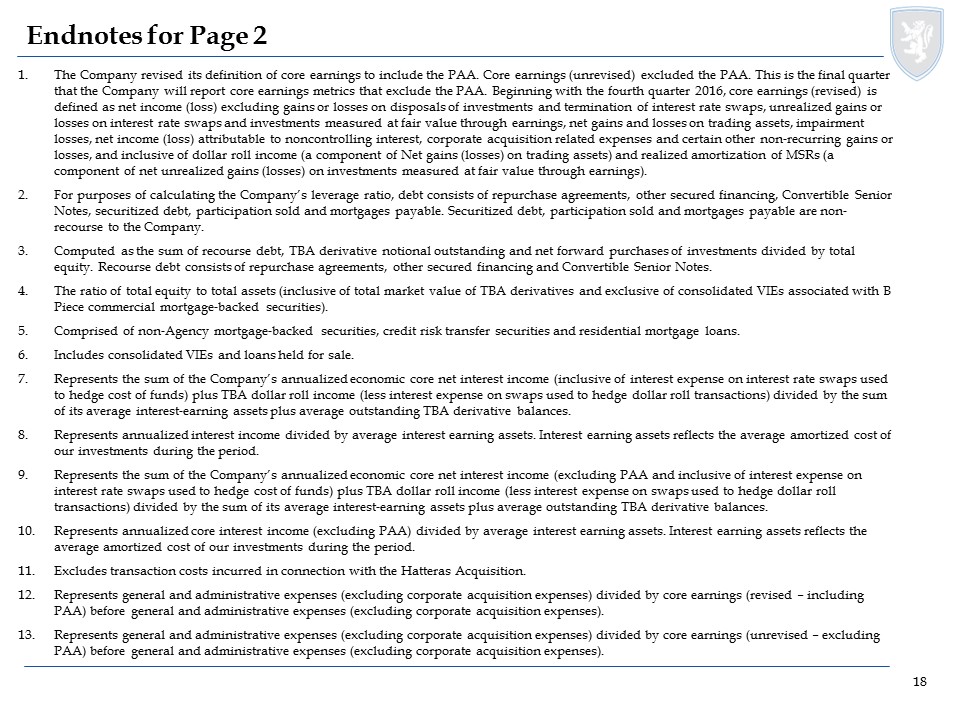
Endnotes for Page 2 The Company revised its definition of core earnings to include the PAA. Core earnings (unrevised) excluded the PAA. This is the final quarter that the Company will report core earnings metrics that exclude the PAA. Beginning with the fourth quarter 2016, core earnings (revised) is defined as net income (loss) excluding gains or losses on disposals of investments and termination of interest rate swaps, unrealized gains or losses on interest rate swaps and investments measured at fair value through earnings, net gains and losses on trading assets, impairment losses, net income (loss) attributable to noncontrolling interest, corporate acquisition related expenses and certain other non-recurring gains or losses, and inclusive of dollar roll income (a component of Net gains (losses) on trading assets) and realized amortization of MSRs (a component of net unrealized gains (losses) on investments measured at fair value through earnings).For purposes of calculating the Company’s leverage ratio, debt consists of repurchase agreements, other secured financing, Convertible Senior Notes, securitized debt, participation sold and mortgages payable. Securitized debt, participation sold and mortgages payable are non-recourse to the Company.Computed as the sum of recourse debt, TBA derivative notional outstanding and net forward purchases of investments divided by total equity. Recourse debt consists of repurchase agreements, other secured financing and Convertible Senior Notes. The ratio of total equity to total assets (inclusive of total market value of TBA derivatives and exclusive of consolidated VIEs associated with B Piece commercial mortgage-backed securities).Comprised of non-Agency mortgage-backed securities, credit risk transfer securities and residential mortgage loans.Includes consolidated VIEs and loans held for sale.Represents the sum of the Company’s annualized economic core net interest income (inclusive of interest expense on interest rate swaps used to hedge cost of funds) plus TBA dollar roll income (less interest expense on swaps used to hedge dollar roll transactions) divided by the sum of its average interest-earning assets plus average outstanding TBA derivative balances.Represents annualized interest income divided by average interest earning assets. Interest earning assets reflects the average amortized cost of our investments during the period. Represents the sum of the Company’s annualized economic core net interest income (excluding PAA and inclusive of interest expense on interest rate swaps used to hedge cost of funds) plus TBA dollar roll income (less interest expense on swaps used to hedge dollar roll transactions) divided by the sum of its average interest-earning assets plus average outstanding TBA derivative balances.Represents annualized core interest income (excluding PAA) divided by average interest earning assets. Interest earning assets reflects the average amortized cost of our investments during the period. Excludes transaction costs incurred in connection with the Hatteras Acquisition.Represents general and administrative expenses (excluding corporate acquisition expenses) divided by core earnings (revised – including PAA) before general and administrative expenses (excluding corporate acquisition expenses).Represents general and administrative expenses (excluding corporate acquisition expenses) divided by core earnings (unrevised – excluding PAA) before general and administrative expenses (excluding corporate acquisition expenses).
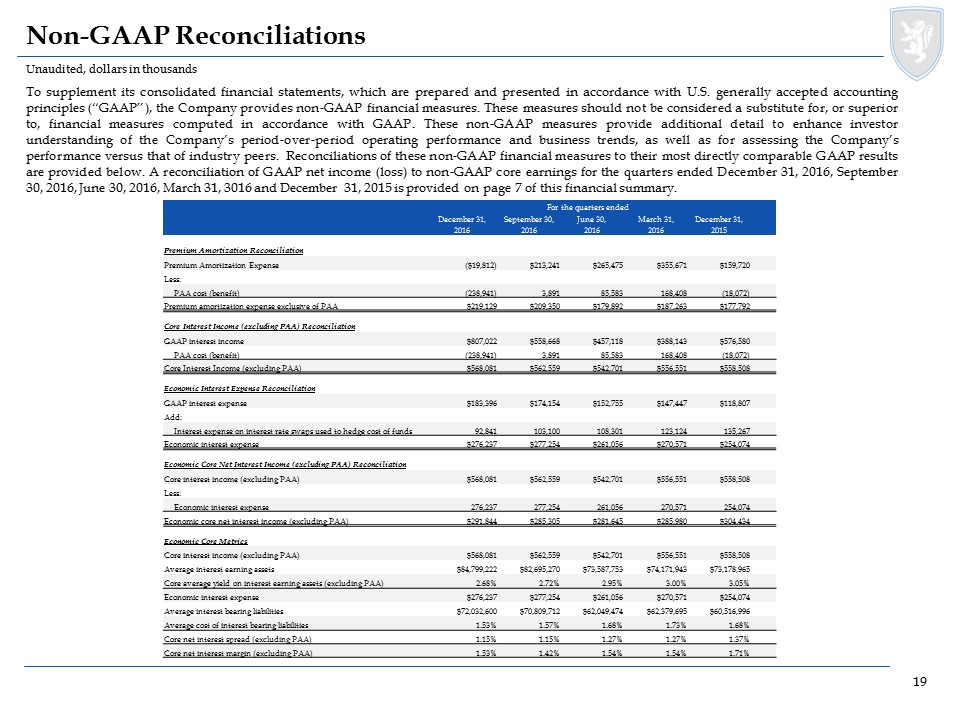
Non-GAAP Reconciliations To supplement its consolidated financial statements, which are prepared and presented in accordance with U.S. generally accepted accounting principles (“GAAP”), the Company provides non-GAAP financial measures. These measures should not be considered a substitute for, or superior to, financial measures computed in accordance with GAAP. These non-GAAP measures provide additional detail to enhance investor understanding of the Company’s period-over-period operating performance and business trends, as well as for assessing the Company’s performance versus that of industry peers. Reconciliations of these non-GAAP financial measures to their most directly comparable GAAP results are provided below. A reconciliation of GAAP net income (loss) to non-GAAP core earnings for the quarters ended December 31, 2016, September 30, 2016, June 30, 2016, March 31, 3016 and December 31, 2015 is provided on page 7 of this financial summary. Unaudited, dollars in thousands For the quarters ended December 31, September 30, June 30, March 31, December 31, 2016 2016 2016 2016 2015 Premium Amortization Reconciliation Premium Amortization Expense ($19,812) $213,241 $265,475 $355,671 $159,720 Less: PAA cost (benefit) (238,941) 3,891 85,583 168,408 (18,072) Premium amortization expense exclusive of PAA $219,129 $209,350 $179,892 $187,263 $177,792 Core Interest Income (excluding PAA) Reconciliation GAAP interest income $807,022 $558,668 $457,118 $388,143 $576,580 PAA cost (benefit) (238,941) 3,891 85,583 168,408 (18,072) Core Interest Income (excluding PAA) $568,081 $562,559 $542,701 $556,551 $558,508 Economic Interest Expense Reconciliation GAAP interest expense $183,396 $174,154 $152,755 $147,447 $118,807 Add: Interest expense on interest rate swaps used to hedge cost of funds 92,841 103,100 108,301 123,124 135,267 Economic interest expense $276,237 $277,254 $261,056 $270,571 $254,074 Economic Core Net Interest Income (excluding PAA) Reconciliation Core interest income (excluding PAA) $568,081 $562,559 $542,701 $556,551 $558,508 Less: Economic interest expense 276,237 277,254 261,056 270,571 254,074 Economic core net interest income (excluding PAA) $291,844 $285,305 $281,645 $285,980 $304,434 Economic Core Metrics Core interest income (excluding PAA) $568,081 $562,559 $542,701 $556,551 $558,508 Average interest earning assets $84,799,222 $82,695,270 $73,587,753 $74,171,943 $73,178,965 Core average yield on interest earning assets (excluding PAA) 2.68% 2.72% 2.95% 3.00% 3.05% Economic interest expense $276,237 $277,254 $261,056 $270,571 $254,074 Average interest bearing liabilities $72,032,600 $70,809,712 $62,049,474 $62,379,695 $60,516,996 Average cost of interest bearing liabilities 1.53% 1.57% 1.68% 1.73% 1.68% Core net interest spread (excluding PAA) 1.15% 1.15% 1.27% 1.27% 1.37% Core net interest margin (excluding PAA) 1.53% 1.42% 1.54% 1.54% 1.71%