Attached files
| file | filename |
|---|---|
| 8-K - 8-K - STATE BANK FINANCIAL CORP | a8kcoverpage123116.htm |
| EX-99.1 - EXHIBIT 99.1 - STATE BANK FINANCIAL CORP | pressrelease123116.htm |

4th Quarter 2016
Earnings Presentation
Joe Evans, Chairman and CEO
Tom Wiley, Vice Chairman and President
Sheila Ray, EVP and Chief Financial Officer
David Black, EVP and Chief Credit Officer
January 26, 2017
State Bank Financial Corporation

2
Cautionary Note Regarding Forward-Looking
Statements
This presentation contains forward-looking statements within the meaning of the federal securities laws. These forward-looking statements, which are based on certain
assumptions and describe our future plans, strategies and expectations, can generally be identified by the use of the words “will,” “expect,” “should,” “anticipate,” “may,” and
“project,” as well as similar expressions. These forward-looking statements include, but are not limited to, statements regarding our acquisitions of NBG Bancorp (“NBG”) and
its subsidiary and S Bankshares and its subsidiary, including our belief that these acquisitions will provide entry into attractive new markets and the timing of each acquired
bank’s expected conversion date, statements regarding our focus on improving efficiency, including our target burden ratio and target efficiency ratio, and other statements
about expected developments or events, our future financial performance, and the execution of our strategic goals. Forward-looking statements are not guarantees of future
performance and are subject to risks, uncertainties and assumptions (“risk factor”) that are difficult to predict with regard to timing, extent, likelihood and degree. Therefore,
actual results and outcomes may materially differ from what may be expressed or forecasted in such forward-looking statements. We undertake no obligation to update, amend
or clarify forward-looking statements, whether as a result of new information, future events or otherwise. Risk factors including, without limitation, the following:
• the anticipated benefits, including anticipated cost savings and strategic gains, may be significantly harder or take longer to achieve than expected or may not be achieved in
their entirety as a result of unexpected factors or events;
• the integration of NBG’s and S Bankshares’ business and operations into ours may be more costly than anticipated or have unanticipated adverse results related to NBG’s,
S Bankshares’ or our existing businesses;
• our ability to achieve anticipated results from the transactions with NBG and S Bankshares will depend on the state of the economic and financial markets going forward;
• economic conditions (both generally and in our markets) may be less favorable than expected, which could result in, among other things, a deterioration in credit quality, a
reduction in demand for credit and a decline in real estate values;
• a general decline in the real estate and lending markets, particularly in our market areas, could negatively affect our financial results;
• risk associated with income taxes including the potential for adverse adjustments and the inability to fully realize deferred tax benefits;
• increased cybersecurity risk, including potential network breaches, business disruptions or financial losses;
• restrictions or conditions imposed by our regulators on our operations may make it more difficult for us to achieve our goals;
• legislative or regulatory changes, including changes in accounting standards and compliance requirements, may adversely affect us;
• competitive pressures among depository and other financial institutions may increase significantly;
• changes in the interest rate environment may reduce margins or the volumes or values of the loans we make or have acquired;
• other financial institutions have greater financial resources and may be able to develop or acquire products that enable them to compete more successfully than we can;
• our ability to attract and retain key personnel can be affected by the increased competition for experienced employees in the banking industry;
• adverse changes may occur in the bond and equity markets;
• war or terrorist activities may cause deterioration in the economy or cause instability in credit markets; and
• economic, governmental or other factors may prevent the projected population, residential and commercial growth in the markets in which we operate.
In addition, risk factors include, but are not limited to, the risk factors described in Item 1A, Risk Factors, in our Annual Report on Form 10-K for the most recently ended fiscal
year. These and other risk factors are representative of the risk factors that may emerge and could cause a difference between an ultimate actual outcome and a forward-
looking statement.

3
Recent Acquisitions Enhance Georgia
Footprint
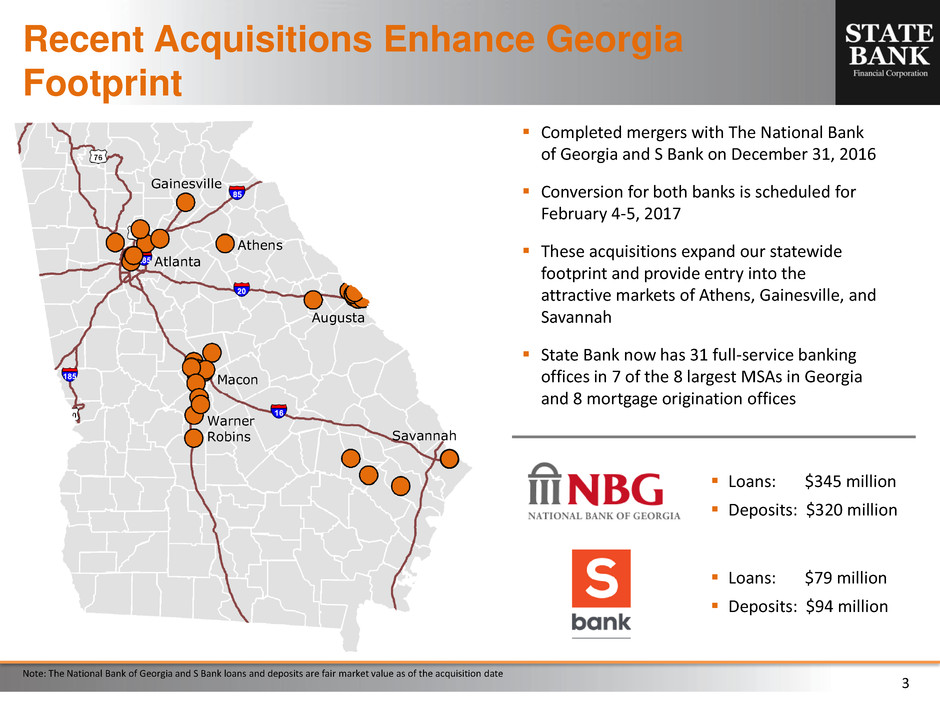
Completed mergers with The National Bank
of Georgia and S Bank on December 31, 2016
Conversion for both banks is scheduled for
February 4-5, 2017
These acquisitions expand our statewide
footprint and provide entry into the
attractive markets of Athens, Gainesville, and
Savannah
State Bank now has 31 full-service banking
offices in 7 of the 8 largest MSAs in Georgia
and 8 mortgage origination offices
Loans: $345 million
Deposits: $320 million
Loans: $79 million
Deposits: $94 million
Atlanta
Macon
Warner
Robins
Augusta
Savannah
Athens
Gainesville
Note: The National Bank of Georgia and S Bank loans and deposits are fair market value as of the acquisition date

4
2016 Highlights
Record full year 2016 earnings of $47.6 million
Increased interest income excluding accretion 12% year-over-year
Improved noninterest income 7% excluding amortization of the FDIC receivable
Reduced expenses 5% excluding merger expenses and the net benefit of OREO activity
Organic and PNCI loan growth of $254 million, or 13%, excluding acquisitions
Deposit growth of $156 million, including $118 million, or 8%, growth in transaction deposit
accounts, excluding acquisitions
Completed acquisitions of The National Bank of Georgia and S Bank on December 31, 2016

5
Income Statement Highlights
($ in 000s, except per share data) 4Q16 3Q16 4Q15 FY 2016 FY 2015
Interest income on loans $26,696 $26,580 $24,250 $103,024 $92,938
Accretion income on loans 10,271 9,335 14,240 43,310 49,830
Interest income on invested funds 4,810 4,714 4,139 18,923 15,823
Total interest income 41,777 40,629 42,629 165,257 158,591
Interest expense 2,631 2,504 1,994 9,619 7,922
Net interest income 39,146 38,125 40,635 155,638 150,669
Provision for loan and lease losses 277 88 494 237 3,486
Net interest income after provision for loan losses 38,869 38,037 40,141 155,401 147,183
Total noninterest income 9,911 9,769 8,136 39,301 36,599
Amortization of FDIC receivable - - - - (16,488)
Total noninterest expense 32,875 28,480 29,562 120,927 123,422
Income before income taxes 15,905 19,326 18,715 73,775 43,872
Income tax expense 5,578 6,885 6,594 26,184 15,449
Net income $10,327 $12,441 $12,121 $47,591 $28,423
Diluted earnings per share .28 .34 .33 1.28 .77
Dividends per share .14 .14 .14
Tangible book value per share 13.48 13.99 13.22
Balance Sheet Highlights (period-end)
Total loans $2,814,572 $2,346,346 $2,160,217
Organic 2,090,564 2,030,457 1,774,332
Purchased non-credit impaired 563,362 189,053 240,310
Purchased credit impaired 160,646 126,836 145,575
Total assets 4,224,859 3,616,384 3,470,067
Noninterest-bearing deposits 984,419 890,588 826,216
Total deposits 3,431,165 2,959,292 2,861,962
Shareholders’ equity 613,633 561,134 536,490
4Q and Full Year 2016 Results Summary
1 Denotes a non-GAAP financial measure; for more information, refer to Table 8 of the 4Q16 earnings press release
Note: Consolidated financial results contained throughout this presentation are unaudited; numbers may not add due to rounding
2016 net income of $47.6
million, or $1.28 per
diluted share
4Q16 net income of $10.3
million, or $.28 per
diluted share
1

6
4Q 2016 Results
Net income of $10.3 million, or $.28 per diluted share in 4Q16
Interest income on loans and invested funds was 11% higher in 4Q16 compared to 4Q15
Noninterest income in 4Q16 increased 22% versus 4Q15
Noninterest expense in 4Q16 was impacted by the following items:
Merger-related expenses of $3.5 million, representing the majority of merger expenses we expect to incur
on our two most recent acquisitions (diluted EPS impact of $.06)
Increase in legal/professional fees of $638,000 related to consulting charge of $900,000 on a support
system project (diluted EPS impact of $.01)
Decrease in net gains on OREO of $714,000 compared to 3Q16 (diluted EPS impact of $.01)
1

7
0
20,000
40,000
60,000
80,000
100,000
120,000
140,000
2011 2012 2013 2014 2015 2016
Interest Income
1
Revenue Trends
Interest income (excluding accretion)
of $31.5mm in 4Q16 compared to
$28.4mm in 4Q15
Total interest income increased 4%
in 2016 compared to 2015, despite
a 13% decline in accretion income
Double digit growth in targeted fee
income lines of business led to a 7%
increase in 2016 noninterest income
($ i
n
000
s)
5,000
10,000
15,000
20,000
25,000
30,000
35,000
1Q14 2Q14 3Q14 4Q14 1Q15 2Q15 3Q15 4Q15 1Q16 2Q16 3Q16 4Q16
Interest Income and Accretion
Interest Income Accretion
1 Excludes accretion income on loans
2 Excludes (amortization)/accretion of FDIC receivable
($ i
n
000
s)
($ i
n
000
s)
0
10,000
20,000
30,000
40,000
50,000
2011 2012 2013 2014 2015 2016
Noninterest Income
2

8
SBA income increased 31% in 4Q16 and 17% in FY
2016 compared to the same periods a year ago
Payroll fee income increased 17% in 4Q16 and 15% in
FY 2016 compared to the same periods a year ago
Revenue Trends
Mortgage banking income increased 25% in 4Q16 and 10%
in FY 2016 compared to the same periods a year ago
Total 4Q16 noninterest income of $9.9mm
($ i
n
000
s)
0
2,000
4,000
6,000
8,000
10,000
12,000
4Q15 1Q16 2Q16 3Q16 4Q16
Service Charge Other Mortgage Payroll SBA
0
50
100
150
200
0
1,000
2,000
3,000
4,000
4Q15 1Q16 2Q16 3Q16 4Q16
Pr
o
d
u
cti
o
n
($
in
m
m
)
N
o
n
in
ter
es
t
In
com
e
($ i
n
000
s)
Income Production
1,000
1,050
1,100
1,150
1,200
0
250
500
750
1,000
1,250
1,500
4Q15 1Q16 2Q16 3Q16 4Q16
# o
f C
lien
ts
N
o
n
in
ter
es
t
In
com
e
($ i
n
000
s)
Income Number of Clients
0
5
10
15
20
25
30
35
0
500
1,000
1,500
2,000
4Q15 1Q16 2Q16 3Q16 4Q16
Pr
o
d
u
cti
o
n
($
in
m
m
)
N
o
n
in
ter
es
t
In
com
e
($ i
n
000
s)
Income Production

9
Focused on Improving Efficiency
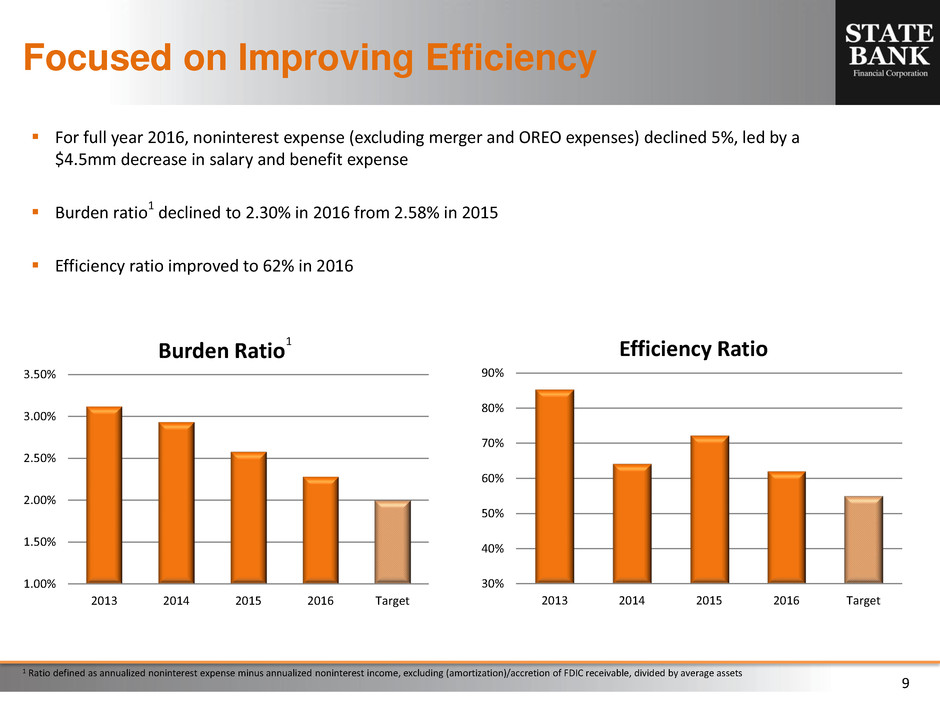
For full year 2016, noninterest expense (excluding merger and OREO expenses) declined 5%, led by a
$4.5mm decrease in salary and benefit expense
Burden ratio1 declined to 2.30% in 2016 from 2.58% in 2015
Efficiency ratio improved to 62% in 2016
1 Ratio defined as annualized noninterest expense minus annualized noninterest income, excluding (amortization)/accretion of FDIC receivable, divided by average assets
1.00%
1.50%
2.00%
2.50%
3.00%
3.50%
2013 2014 2015 2016 Target
Burden Ratio
1
30%
40%
50%
60%
70%
80%
90%
2013 2014 2015 2016 Target
Efficiency Ratio

10
($ in mm)
2013 % 2014 % 2015 % 2016 % 2016 %
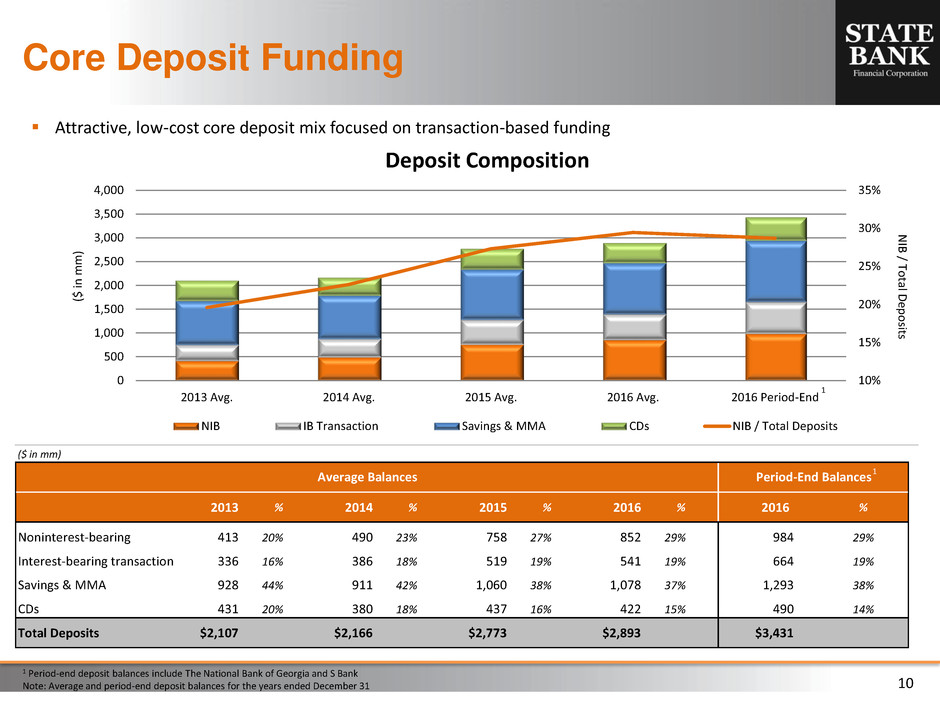
Noninterest-bearing 413 20% 490 23% 758 27% 852 29% 984 29%
Interest-bearing transaction 336 16% 386 18% 519 19% 541 19% 664 19%
Savings & MMA 928 44% 911 42% 1,060 38% 1,078 37% 1,293 38%
CDs 431 20% 380 18% 437 16% 422 15% 490 14%
Total Deposits $2,107 $2,166 $2,773 $2,893 $3,431
Period-End BalancesAverage Balances
Core Deposit Funding
($ i
n
m
m
)
N
IB
/ Tot
al D
ep
o
sit
s
Attractive, low-cost core deposit mix focused on transaction-based funding
1 Period-end deposit balances include The National Bank of Georgia and S Bank
Note: Average and period-end deposit balances for the years ended December 31
1
1
10%
15%
20%
25%
30%
35%
0
500
1,000
1,500
2,000
2,500
3,000
3,500
4,000
2013 Avg. 2014 Avg. 2015 Avg. 2016 Avg. 2016 Period-End
Deposit Composition
NIB IB Transaction Savings & MMA CDs NIB / Total Deposits

11
0
125
250
375
500
500
1,000
1,500
2,000
2,500
3,000
1Q14 2Q14 3Q14 4Q14 1Q15 2Q15 3Q15 4Q15 1Q16 2Q16 3Q16 4Q16
Total Loan Portfolio
Organic PNCI PCI New Loan Fundings
Loan Portfolio
To
ta
l L
o
an
s
($
in
m
m
)
1 New loan fundings include new loans funded and net loan advances on existing commitments
Note: Period-end loan balances as of year-end 2016 include The National Bank of Georgia and S Bank
1
New loan originations in
excess of $400mm in 4Q16
Excluding the acquisitions,
organic and PNCI loans
increased $49mm in the
quarter and $254mm year-
over-year to end 4Q16 at
$2.27B
N
ew
Lo
an
Fu
n
d
in
gs ($ i
n
m
m
)
($ in mm)
Loan Composition (period-end) 2013 2014 2015
2016 Ex.
Acquisitions
2016 Inc.
Acquisitions
Construction, land & land development $251 $313 $501 $507 $551
Other commercial real estate 550 636 736 812 964
Total commercial real estate 802 949 1,236 1,319 1,516
Residential real estate 67 135 210 197 289
Owner-occupied real estate 175 212 281 306 372
C&I and Leases 71 123 267 409 435
Consumer 9 9 21 38 42
Total Organic & PNCI Loans 1,123 1,428 2,015 2,269 2,654
PCI Loans 257 206 146 122 161
Total Loans $1,381 $1,635 $2,160 $2,391 $2,815

12
Excluding the acquisitions,
purchased credit impaired loans
were down 16% year-over-year to
$121.8mm
OREO balances remain relatively
low at $10.9mm as of 4Q16
Asset Quality
($ i
n
m
m
)
Total organic NPAs of $6.5mm,
representing .31% of organic loans
and OREO
Average net charge-offs were .10%
in 4Q16
Past due organic loans of just .06%,
compared to .09% at 3Q16
Allowance to organic loans is 1.01%,
down from 1.07% last quarter, and
covers NPAs by 3.2 times
0.00%
0.50%
1.00%
1.50%
2.00%
0
5
10
15
20
2012 2013 2014 2015 2016
Nonperforming Loans
Organic PNCI NPLs / Organic Loans
0
10
20
30
40
50
0
100
200
300
400
500
2012 2013 2014 2015 2016
OR
EO
($ i
n
m
m
)
PCI
Lo
an
s ($
in
m
m
)
PCI Loans & OREO
1
PCI Loans OREO
1 Period-end PCI loans and OREO balances include The National Bank of Georgia and S Bank
