Attached files
| file | filename |
|---|---|
| 8-K - FORM 8-K - MYERS INDUSTRIES INC | d247291d8k.htm |
| EX-99.1 - EX-99.1 - MYERS INDUSTRIES INC | d247291dex991.htm |
 NOVEMBER 8, 2016 – THIRD QUARTER EARNINGS PRESENTATION MYERS INDUSTRIES, INC. Exhibit 99.2 |
 SAFE
HARBOR
STATEMENT
Statements in this presentation concerning the Company’s goals, strategies, and
expectations for business and financial results may be
"forward-looking statements" within the meaning of the Private Securities
Litigation Reform Act of 1995 and are based on current indicators
and expectations. Whenever you read a statement that is not simply
a statement of historical fact (such as when we describe what we
"believe," "expect," or "anticipate" will occur, and other
similar statements), you must remember that our expectations may not be correct, even though we believe they are reasonable. We do not guarantee that the transactions and events described will happen as described
(or that they will happen at all). You should review this
presentation with the understanding that actual future results may
be materially different from what we expect. Many of the factors that will determine these results are beyond our ability to control or predict.
You are cautioned not to put undue reliance on any forward-looking
statement. We do not intend, and undertake no obligation, to update these forward-looking statements. These statements involve a number of risks and uncertainties that could cause actual results to differ
materially from those expressed or implied in the applicable
statements. Such risks include: (1) Changes in the markets for the
Company’s business segments (2) Changes in trends and demands in the
markets in which the Company competes (3) Unanticipated downturn in
business relationships with customers or their purchases (4) Competitive
pressures on sales and pricing (5) Raw material availability, increases in
raw material costs, or other production costs (6) Harsh weather
conditions (7) Future economic and financial conditions in the United
States and around the world (8) Inability of the Company to meet future
capital requirements (9) Claims, litigation and regulatory actions against
the Company (10) Changes in laws and regulations affecting the
Company 2
Myers Industries, Inc. encourages investors to learn more about these risk factors. A
detailed explanation of these factors is available in the Company’s publicly filed quarterly and annual reports, which can be found online at www.myersindustries.com and at the SEC.gov
web site. |
 3 Q3 2016 SUMMARY WEAK CAPITAL SPENDING CONTINUES TO IMPACT RESULTS » Q3 sales in line with expectations » Net sales $132.7M, a decrease of 6% to prior year » Continued difficult capital spending environment in several key markets » Distribution sales initiative still in early innings; making progress » Gross margin reduction of 230 basis points to 27.1% » Lower volume » Unfavorable product mix and operational inefficiencies » SG&A reduction of $6M due primarily to lower non-recurring comp,
lower environmental costs and other cost containment actions
» GAAP EPS from continuing operations $0.01 vs. $0.02 in 2015 » Adjusted EPS from continuing operations $0.04 vs. $0.09 in 2015 » YTD free cash flow of $7.1M vs. ($10.5M) in 2015 » Cash from operations up due to working capital process improvements » Capital spending down |
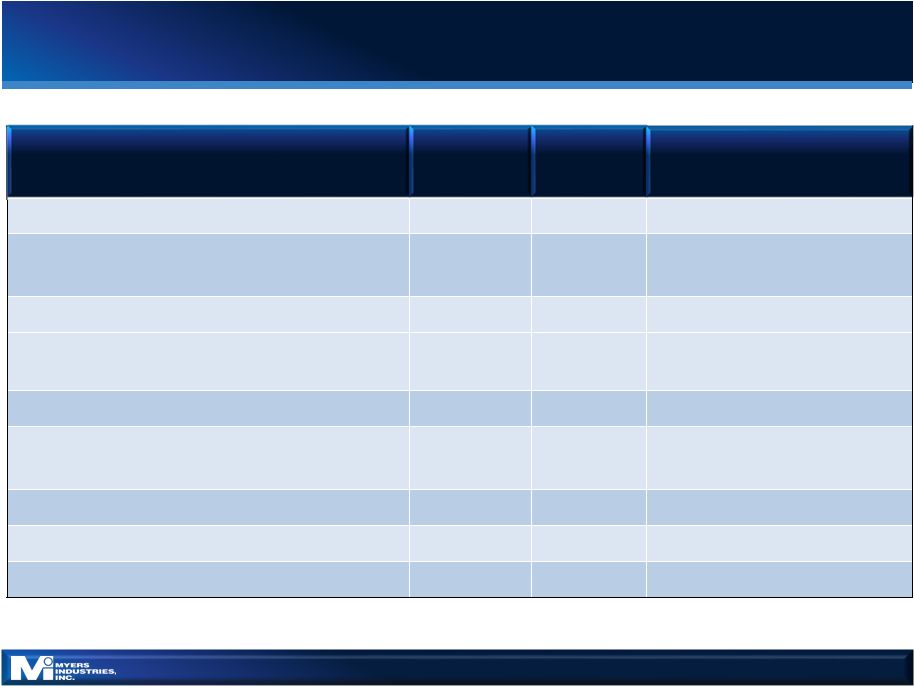 4 Q3 GAAP FINANCIAL SUMMARY CONTINUING OPERATIONS Q3 2015 Q3 2016 NET SALES $ 141.7 $ 132.7 - 6.3%; - 6.7% organic GROSS PROFIT GROSS MARGIN $ 41.7 29.4% $ 35.9 27.1% - 230 bps SG&A $ 39.1 $ 32.9 15.8% improvement OPERATING INCOME OPERATING MARGIN $ 2.6
1.8% $ 3.0 2.3% + 50 bps NET INTEREST EXPENSE $ 1.7
$ 2.0
INCOME
FROM CONTINUING OPS BEFORE INCOME TAXES $ 0.8
$ 1.0
INCOME
TAX
EXPENSE
$
0.2 $
0.5 INCOME
FROM CONTINUING OPS $ 0.6
$ 0.4
EPS FROM CONTINUING OPS $ 0.02 $ 0.01 IN $MILLIONS EXCEPT RATIOS AND PERCENTAGES |
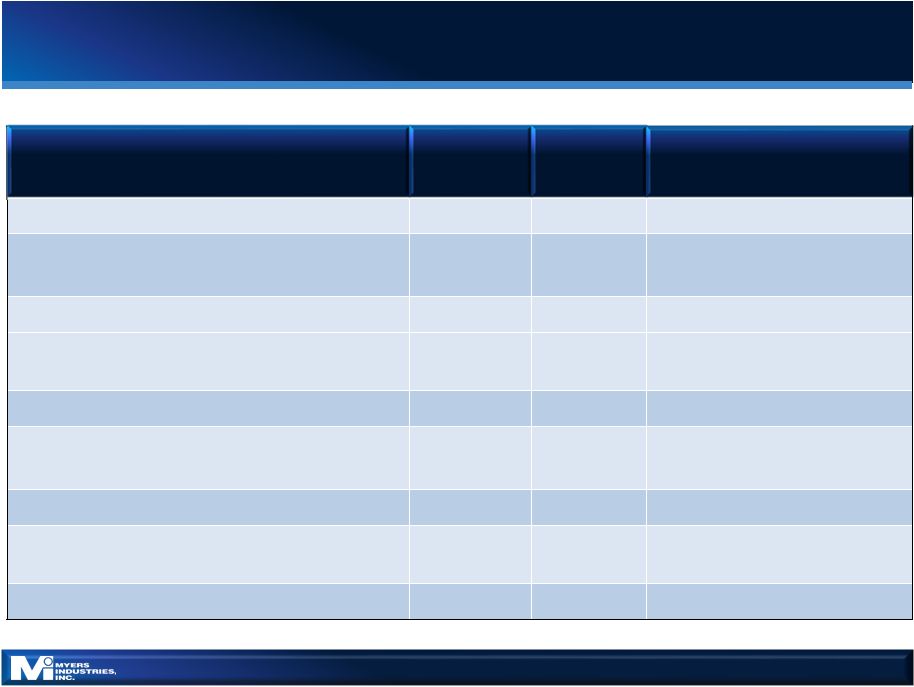 5 Q3 ADJUSTED FINANCIAL SUMMARY CONTINUING OPERATIONS Q3 2015 Q3 2016 NET SALES $ 141.7 $ 132.7 - 6.3%; - 6.7% organic ADJ. GROSS PROFIT GROSS MARGIN $ 42.4 30.0% $ 35.9 27.1% - 290 bps ADJ. SG&A $ 36.6 $ 32.0 12.4% improvement ADJ. OPERATING INCOME OPERATING MARGIN $ 5.9
4.2% $ 3.9 2.9% - 130 bps NET INTEREST EXPENSE $ 1.7
$ 2.0
ADJ. INCOME FROM CONTINUING OPS BEFORE INCOME TAXES $ 4.2
$ 1.9
INCOME
TAX
EXPENSE
$
1.5 $
0.7 ADJ.
INCOME
FROM CONTINUING OPS INCOME MARGIN $ 2.7
1.9% $ 1.2 0.9% ADJ. EPS FROM CONTINUING OPS $ 0.09 $ 0.04 IN $MILLIONS EXCEPT RATIOS AND PERCENTAGES See appendix for reconciliations
from GAAP to adjusted results
$12.5M ADJUSTED
EBITDA COMPARED
TO $14.4M IN PRIOR -YEAR QUARTER |
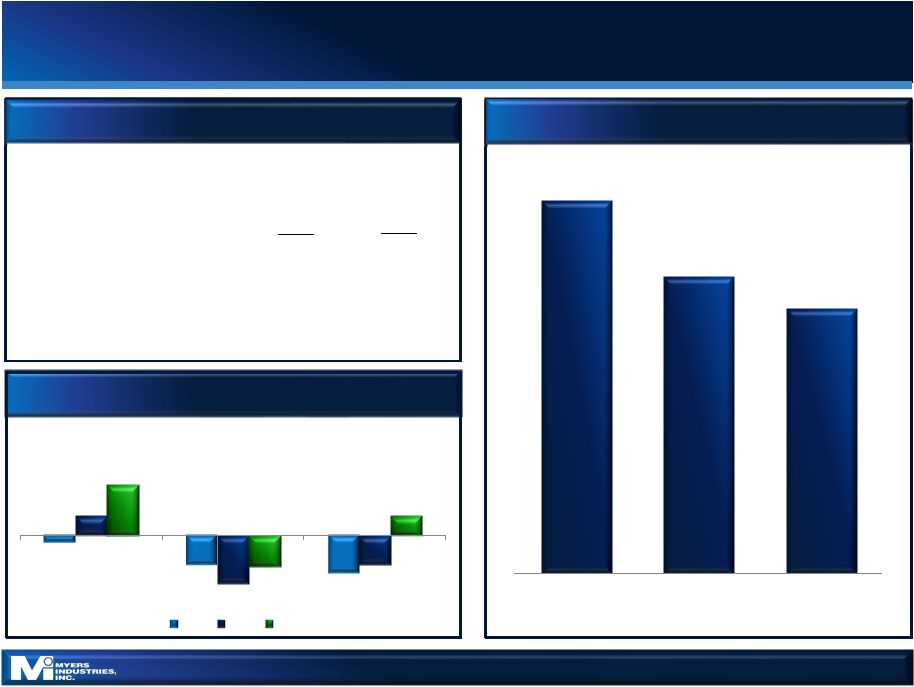 6 BALANCE SHEET & CASH FLOW YTD CASH FLOW WORKING CAPITAL AS A % OF SALES 12.8% 10.2% 9.1% Q3 2014 Q3 2015 Q3 2016 DISCIPLINED WORKING CAPITAL AND CAPITAL SPENDING $(2.8) $(10.9) $(13.7) $7.1 $(17.7) $(10.5) $18.6 $(11.5) $7.1 Cash from Cont. Ops CapEx Free Cash Flow 2014 2015 2016 BALANCE SHEET 09/30/15 09/30/16 Cash 5.2 $ 5.5 $ Debt 214.7 197.9 Net Debt 209.5 $ 192.4 $ Adjusted TTM EBITDA 74.1 $ 65.8 $ Net Debt-to-Adj. EBITDA 2.8x 2.9x See appendix for reconciliations from GAAP to adjusted results |
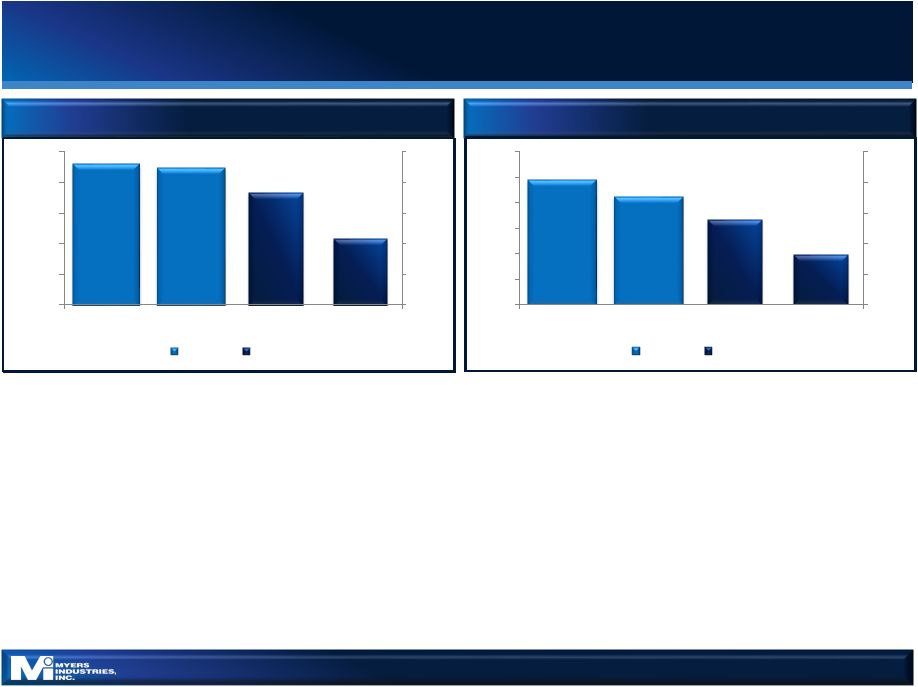 7 Q3 2016 SEGMENT RESULTS » Sales down 13%: » Market indicators positive » Reduced capital spending continues to impact equipment sales; retread markets remain slow » Sales team initiative progressing; steady sequential pace but still down year-over-year » Share gains with vending installs at large auto dealer group » Q3 margin decline due to lower sales volumes and cost reallocations from corporate to reflect correct segment cost structure » Sales down 2.8% (down 3.4% organic): » Capital spending remains down in food and beverage markets » In vehicle market, steady share gains in automotive and strong sales in RV » Progress in industrial markets; slow overall pace » Share gains at Scepter for 2017 during seasonal buying process » Unfavorable mix in Q3; results also impacted by operational inefficiencies and cost reallocations from corporate to reflect correct segment cost structure MATERIAL HANDLING DISTRIBUTION COMMERCIAL EXECUTION CONTINUES TO BE THE PRIORITY $92.5 $89.9 $7.4 $4.4 $0.0 $2.0 $4.0 $6.0 $8.0 $10.0 $0.0 $20.0 $40.0 $60.0 $80.0 $100.0 Q3 2015 Q3 2016 Q3 2015 Q3 2016 Net Sales Op Inc. $49.2 $42.8 $5.6 $3.3 $0.0 $2.0 $4.0 $6.0 $8.0 $10.0 $0.0 $10.0 $20.0 $30.0 $40.0 $50.0 $60.0 Q3 2015 Q3 2016 Q3 2015 Q3 2016 Net Sales Op Inc. |
 8 2016 OUTLOOK AND STRATEGY UPDATE CONSUMER 12% VEHICLE 13% FOOD & BEVERAGE 16% AUTO AFTERMARKET 30% INDUSTRIAL 29% MID SINGLE DIGITS HIGH SINGLE DIGITS MID SINGLE DIGITS HIGH-TEENS
FLAT
PERCENT
OF 2015 SALES MYE 2016 GROWTH OUTLOOK Outlook » Holding prior outlook; Q4 & FY revenue expected to be down mid-to-high single digits » Continued weakness in capital spending in both segments » Steady sales run rate in Distribution segment Strategic Update » Senior leadership team now in place » Finalizing enterprise strategy that supports competitive strengths » Key themes: » Protect the core » Safe and efficient solutions for niche end- markets » Simplify » More flexible operating model » Near-term priorities: » Further develop our capability to execute niche market commercial strategies » Implement a culture of continuous process improvement » Debt reduction/more flexible balance sheet SAFETY AND EFFICIENCY FOR OUR CUSTOMERS AND OUR BUSINESSES |
 APPENDIX |
 » Capital expenditures: $12 - $14 million » Net interest expense: $8 - $9 million » D&A: $34 - $35 million » Effective tax rate (normalized): 36% 10 2016 KEY ASSUMPTIONS |
 Note on
Reconciliation of Income and Earnings Data: Gross profit excluding the items above in the text of this presentation and in this
reconciliation chart is a non-GAAP financial measure that Myers Industries, Inc. calculates according to the schedule above using GAAP amounts from the unaudited Condensed
Consolidated Statement of Operations. The Company believes that the
excluded items are not primarily related to core operational activities. The Company believes that gross profit excluding items that are not primarily related to core operating activities is generally viewed as providing useful information regarding a company's operating
profitability. Management uses gross profit excluding these items as well
as other financial measures in connection with its decision-making activities. Gross profit excluding these items should not be considered in isolation or as a substitute for gross profit prepared in accordance with GAAP. The Company's method for calculating gross profit excluding these
items may not be comparable to methods used by other companies.
11 RECONCILIATION OF NON-GAAP MEASURES
MYERS INDUSTRIES, INC.
RECONCILIATION OF NON-GAAP FINANCIAL MEASURES
CONSOLIDATED GROSS PROFIT (UNAUDITED)
(Dollars in thousands)
Quarter
Ended
For the nine months ended
September
30, 2016
September
30, 2015
September
30, 2016
September
30, 2015
Gross profit as reported
$
35,918 $ 41,686
$
128,625
$
138,024
Restructuring expenses and other adjustments in cost of
sales Material Handling
segment -
762
-
1,057
Distribution segment
-
-
-
-
Gross profit as adjusted
$
35,918 $ 42,448
$
128,625
139,081
$ |
 12 RECONCILIATION OF NON-GAAP MEASURES
MYERS INDUSTRIES, INC.
RECONCILIATION OF NON-GAAP FINANCIAL MEASURES
CONSOLIDATED SELLING, GENERAL AND ADMINISTRATIVE EXPENSES (UNAUDITED)
(Dollars in thousands) Note on Reconciliation of Income and Earnings Data: Selling, general and administrative expenses excluding the items above in the text of this presentation and in this reconciliation chart is a non-GAAP financial measure that Myers Industries, Inc. calculates according to the schedule above using GAAP amounts from the unaudited Condensed Consolidated Statement of Operations. The Company believes that the excluded items are not primarily related to core operational activities. The Company believes that selling, general and administrative expenses excluding items that are not primarily related to core operating activities is generally viewed as providing useful information regarding a company's operating profitability. Management uses selling, general and administrative expenses excluding these items as well as other financial measures in connection with its decision-making activities. Selling, general and administrative expenses excluding these items should not be considered in isolation or as a substitute for selling, general and administrative expenses prepared in accordance with GAAP. The Company's method for calculating selling, general and administrative expenses excluding these items may not be comparable to methods used by other companies. Quarter Ended Nine Months Ended 2016 September 30, 2015 September 30, 2016 September 30, 2015 Selling, general and administrative expenses as reported
$ 32,932
$ 39,108
$ 103,470
$ 108,987
Restructuring expenses and other adjustments in
selling, general and administrative
expenses Material Handling
segment (292)
(448)
2,043
2,317
Distribution segment
-
(142)
-
(195)
Corporate
(605)
(1,965)
(4,166)
(3,771)
Selling, general and administrative expenses as
adjusted $ 32,035
$ 36,553
$ 101,347
$ 107,338
September
30, |
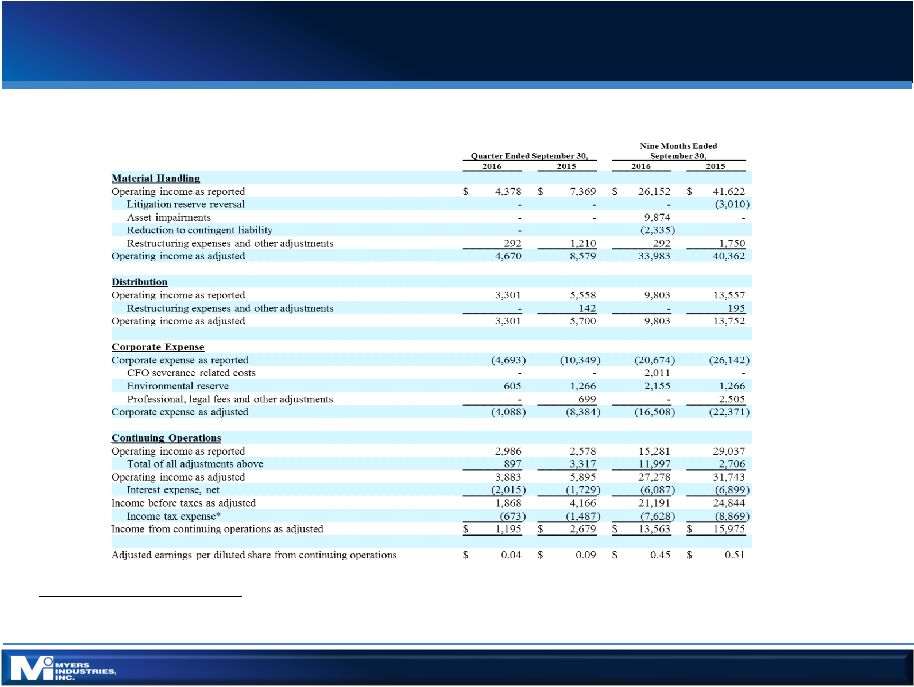 13 RECONCILIATION OF NON-GAAP MEASURES
MYERS INDUSTRIES, INC.
RECONCILIATION OF NON-GAAP FINANCIAL MEASURES
INCOME (LOSS) BEFORE TAXES BY SEGMENT (UNAUDITED)
(Dollars in thousands, except per share data)
Note on Reconciliation of Income and Earnings Data: Income (loss) excluding the items above in the text of this presentation and in this reconciliation chart is a non-GAAP financial measure that Myers Industries, Inc. calculates according to the schedule above using GAAP amounts from the unaudited Condensed Consolidated Statement of Operations. The Company believes that the excluded items are not primarily related to core operational activities. The Company believes that income (loss) excluding items that are not primarily related to core operating activities is generally viewed as providing useful information regarding a company's operating profitability. Management uses income (loss) excluding these items as well as other financial measures in connection with its decision-making activities. Income (loss) excluding these items should not be considered in isolation or as a substitute for income (loss) prepared in accordance with GAAP. The Company's method for calculating income (loss) excluding these items may not be comparable to methods used by other companies. *Income taxes are calculated using the normalized effective tax rate for each year. The normalized rate used above is 36%.
|
 14 RECONCILIATION OF NON-GAAP MEASURES
MYERS INDUSTRIES, INC.
RECONCILIATION OF NON-GAAP FINANCIAL MEASURES
COMBINED STATEMENTS OF INCOME (UNAUDITED)
(Dollars in thousands) Note on Reconciliation of Income and Earnings Data: EBITDA as adjusted is a financial measure that Myers Industries, Inc. calculates according to the schedule above using amounts from the unaudited Reconciliation of Non-GAAP Financial Measures Income (Loss) Before Taxes By Segment and GAAP amounts from the
unaudited Condensed Consolidated Statement of Operations. The Company
believes that EBITDA as adjusted provides useful information regarding a company's operating profitability. Management uses EBITDA as adjusted as well as other financial measures in connection with its decision-making activities. EBITDA as adjusted should not be
considered in isolation or as a substitute for net income (loss), income
(loss) before taxes or other consolidated income data prepared in accordance with GAAP. The Company's method for calculating EBITDA as adjusted may not be comparable to methods used by other companies. Quarter Ended TTM 31-Dec-14 31-Mar-15 30-Jun-15 30-Sep-15 30-Sep-15 Net Income as Reported Continuing Operations $
1,489
$
2,622 $ 10,925
$
631 $ 15,667
Add: tax expense
991
1,392
6,350
218
8,951
Add: net interest expense
2,647
2,702
2,467
1,729
9,545
Add: depreciation
6,424
6,489
6,801
5,926
25,640
Add: amortization
2,724
2,638
2,641
2,575
10,578
EBITDA
14,275
15,843
29,184
11,079
70,381
Add: one-time unusual charges
1,031
1,950
(2,561)
3,317
3,737
EBITDA As Adjusted
15,306
17,793
26,623
14,396
74,118
Quarter
Ended
TTM
31-Dec-15
31-Mar-16
30-Jun-16
30-Sep-16
30-Sep-16
Net Income as Reported Continuing
Operations (125)
(3,336)
$
5,684 $
424
$
2,647 Add: tax expense (151) 2,446 3,429 547 6,271 Add: net interest expense 2,100 2,019 2,053 2,015 8,187 Add: depreciation 5,496 6,000 6,283 6,182 23,961 Add: amortization 2,413 2,499 2,482 2,447 9,841 EBITDA 9,733 9,628 19,931 11,615 50,907 Add: one-time unusual charges 2,906 10,556 544 897 14,903 EBITDA As Adjusted 12,639 20,184 20,475 12,512 65,810 $ $ |
 |