Attached files
| file | filename |
|---|---|
| EX-99.1 - EX-99.1 - Enviva Partners, LP | a2230028zex-99_1.htm |
| 8-K - 8-K - Enviva Partners, LP | a2230028z8-k.htm |
QuickLinks -- Click here to rapidly navigate through this document
Exhibit 99.2
Enviva Partners, LP (the "Partnership") is a Delaware limited partnership formed on November 12, 2013. We conduct our operations through our wholly owned subsidiary Enviva, LP. Our sponsor is Enviva Holdings, LP and our general partner is Enviva Partners GP, LLC (our "general partner"), a wholly owned subsidiary of Enviva Holdings, LP. We completed our initial public offering (the "IPO") on May 4, 2015. Unless otherwise indicated or the context otherwise requires, the terms "we," "us" or "our" refer to (i) Enviva Partners, LP when made in reference to periods subsequent to our IPO and (ii) Enviva, LP when made in reference to periods prior to our IPO. References to the "issuers" refer to the Partnership and Enviva Partners Finance Corp. This summary highlights information appearing elsewhere or incorporated by reference in this offering memorandum. This summary is not complete and does not include all of the information that you should consider before investing in the notes. You should carefully read the entire offering memorandum, including the historical financial statements and related notes incorporated by reference in this offering memorandum and the section entitled "Risk factors" in this offering memorandum and "Risk Factors" in Item 1A of our Annual Report on Form 10-K for the fiscal year ended December 31, 2015, and of our subsequent Quarterly Reports on Form 10-Q, before making any investment decision.
Overview
We are a publicly traded master limited partnership and the world's largest supplier by production capacity of utility-grade wood pellets to major power generators. Since our entry into this business in 2010, we have executed multiple long-term, take-or-pay off-take contracts with utilities and large scale power generators and have built and acquired the production and terminaling capacity necessary to serve them. Our existing production constitutes approximately 13.3% of current global utility-grade wood pellet production capacity and the product we deliver to our customers typically comprises a material portion of their fuel supply. We own and operate six industrial-scale production plants in the Southeastern U.S. that currently have a combined wood pellet production capacity of 2.3 million metric tons per year ("MTPY"). Three of our production plants are new facilities that we constructed using our templated design and standardized equipment. A fourth plant, our largest in terms of production capacity, has been in operation since 2008. We also own a dry-bulk, deep-water marine terminal at the Port of Chesapeake (the "Chesapeake terminal"), and also export from the Ports of Panama City, FL and Mobile, AL under agreements that reduce our storage and shiploading costs and enables us to reliably supply our customers. All of our facilities are located in geographic regions with low input costs and favorable transportation logistics. Owning these cost-advantaged, fully-contracted assets in a rapidly expanding industry provides us with a platform to generate stable and growing cash flows.
Demand for utility-grade wood pellets is expected to grow at a compound annual growth rate ("CAGR") of approximately 16% from 2015 to 2020, according to Hawkins Wright, an independent market consultant with expertise in the international forest products and bioenergy industries. This growth is being driven by the conversion of coal-fired power generation and combined heat and power plants to co-fired or dedicated biomass-fired plants and new builds, principally in Northern Europe and, increasingly, in South Korea and Japan.
1
These investments are attractive due to a combination of factors: they enable power generators to profitably extend the permitted lives of plants that provide critical baseload power generation; they help countries meet regulations regarding greenhouse gas ("GHG") emissions and renewable energy usage; and they can be implemented quickly and cost-effectively relative to other sources of renewable energy.
We believe our strategy to operate fully-contracted, industrial-scale and cost-advantaged production plants and to control critical delivery infrastructure will enable us to maintain and grow our revenue and cash flow. Supporting these assets are our long-term, take-or-pay off-take contracts. As of October 1, 2016, our off-take contracts provide for sales of 2.3 million MT of wood pellets in 2016 and have a weighted average remaining term of 9.6 years and a contracted product sales backlog of $4.7 billion. In addition, we expect the continued execution of our growth strategy, which is focused in part on acquiring fully-contracted replicas of our long-lived production plants and deep-water marine terminals from our sponsor, will produce stable and growing cash flows. We are one of the longest-standing participants in the industry with a proven track record of fully re-contracting our assets and extending the term of our contracted position, with contracts that now extend as far as 2034.
Our sponsor, a portfolio company of the Riverstone Funds, has granted us a right of first offer ("ROFO") to acquire certain assets that it may elect to sell through May 2020. On December 11, 2015, we acquired Enviva Pellets Southampton, LLC from a joint venture between our sponsor and affiliates of John Hancock Life Insurance Company (the "Hancock JV"). The acquisition (the "Southampton Drop-Down") included the Southampton plant, a 500,000 MTPY take-or-pay off-take contract with Drax Power Limited ("Drax") and a matching shipping contract, each of which expire in December 2025.
Additionally, the ROFO applies to (i) a contracted wood pellet production plant located in Sampson County, NC (the "Sampson plant") (ii) a deep-water marine terminal located in Wilmington, NC (the "Wilmington terminal"), (iii) a production plant under development and located near Hamlet, North Carolina (the "Hamlet plant") and (iv) any similar assets that our sponsor may develop or acquire in the future and determine to sell during the term of the ROFO. The Sampson plant, Wilmington terminal and Hamlet plant are held through the Hancock JV. Our sponsor has the right to compel the Hancock JV to sell assets to us if certain investment returns are achieved.
Offer to acquire the Sampson plant and related contracts and assets
The Hancock JV has completed construction of the Sampson plant and operations teams assumed control of the plant in August 2016. Recently, our sponsor provided us with an offer to acquire (i) the entity which owns the Sampson plant (or the Sampson plant itself and related assets), (ii) our sponsor's ten-year, 420,000 MTPY off-take contract with an affiliate of DONG Energy Thermal Power A/S, a Danish power generator ("DONG Energy"), (iii) a 15-year, 95,000 MTPY off-take agreement with the Hancock JV and (iv) a third party shipping contract. We refer to this transaction in this offering memorandum as the "Sampson Acquisition." We currently expect the final purchase price for the Sampson Acquisition to be between $170 million and $180 million.
The board of directors of our general partner has formed a Conflicts Committee comprised solely of independent directors to negotiate the pricing and other terms of the Sampson Acquisition. See "Risk Factors—Risks related to the Sampson Acquisition—We have not entered
2
into a definitive agreement with the Hancock JV in respect of the Sampson Acquisition and there can be no assurance that we will enter into such agreement." If the Sampson Acquisition is negotiated and completed, we expect to use a portion of the net proceeds of this offering, together with cash on hand, or net proceeds of approximately $29.4 million from sales of additional equity, to fund the consideration payable by us in connection with the Sampson Acquisition. We and our sponsor are also considering whether the consideration for the Sampson Acquisition should include an equity component as an alternative to sales of additional equity, and both we and our sponsor would have to agree to any such equity component. No assurances can be given that we will complete the Sampson Acquisition.
Based on the facility's design and installed capacity, we expect the Sampson plant to produce approximately 500,000 MTPY in 2017 and reach its full production capacity of approximately 600,000 MTPY in 2019. We expect that the Sampson plant will generate approximately $22 million in adjusted EBITDA in 2017 and approximately $27 million of adjusted EBITDA in 2019 when we expect full run-rate capacity will be achieved, and will incur annual maintenance capital expenditures of approximately $0.8 million.
If completed, the Sampson Acquisition will bring our total production capacity to approximately 2.8 million MTPY in 2017 and the Sampson plant would be contracted under our portfolio off-take contracts that would have a weighted average remaining term of 9.7 years with a contracted product sales backlog of $5.7 billion as of January 1, 2017.
Our relationship with our sponsor
Riverstone/Carlyle Renewable and Alternative Energy Fund II, L.P. and certain affiliated entities (collectively, the "Riverstone Funds") became the majority owners of our sponsor in March 2010. As of June 30, 2016, the Riverstone Funds have invested $348.5 million of equity in our sponsor.
Our sponsor owns approximately 10.3% of our common units, all of our subordinated units and our general partner. Our general partner owns our incentive distribution rights, which entitle our general partner to increasing percentages of our cash distribution above certain targets. As a result, our sponsor is incentivized to facilitate our access to accretive acquisition and organic growth opportunities, including those pursuant to the ROFO it granted to us in connection with our IPO.
In November 2014, our sponsor entered into the Hancock JV with Hancock Natural Resource Group, Inc. ("HNRG") and certain other affiliates of John Hancock Life Insurance Company. Our sponsor is the managing member and operator of the Hancock JV and manages the development, construction and commissioning of the Hancock JV's development projects.
About our sponsor's owner
Riverstone is an energy and power-focused private investment firm founded in 2000 by David M. Leuschen and Pierre F. Lapeyre, Jr. with approximately $34.0 billion of equity capital raised. Riverstone conducts buyout and growth capital investments in the exploration and production, midstream, oilfield services, power and renewable sectors of the energy industry. With offices in New York, London, Houston and Mexico City, the firm has committed approximately $30.0 billion to 120 investments in North America, Latin America, Europe, Africa and Asia.
3
About HNRG
HNRG is one of the world's largest timberland investment managers, with approximately $11.6 billion and nearly 6.5 million acres of timberlands under management as of June 30, 2016. HNRG is a wholly-owned subsidiary of Manulife Financial Corporation, a leading Canadian financial services group with approximately $718 billion of assets under management and administration as of June 30, 2016.
Our assets and operations
We are a vertically integrated producer and distributor of utility-grade wood pellets. We procure wood fiber from thousands of landowners and other suppliers, dry and process that fiber into wood pellets at our production plants and transport those products to deep-water marine terminals where they are stored and then distributed ratably under long-term agreements to our principally Northern European customers.
Our production plants, logistics and storage capabilities
We own and operate six industrial-scale production plants located in the Mid-Atlantic and Gulf Coast regions of the United States, geographic areas in which wood fiber resources are plentiful and readily available. These production plants currently have a combined wood pellet production capacity of 2.3 million MTPY, representing approximately 17.6% of total industrial pellet market demand in 2015. These facilities are designed to run 24 hours per day, 365 days per year, although we schedule up to 15 days of maintenance for our plants during each calendar year.
The following exhibit provides an overview of the production plants that we own:
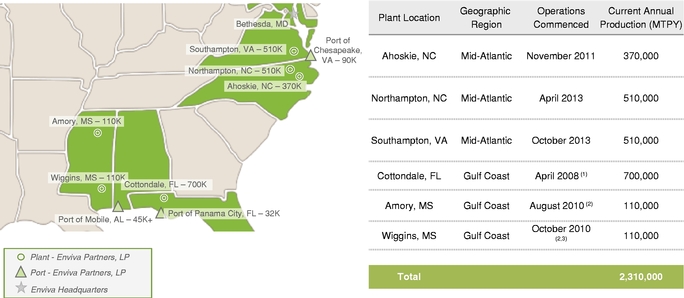
(1) Our sponsor acquired the Cottondale plant in January 2015, and the plant was contributed to us in April 2015.
(2) Represents the date of acquisition of the plant from an unaffiliated third party.
(3) We purchased a 50% controlling interest in the entity that owns the Wiggins plant in October 2010, and subsequently contributed capital in exchange for additional interests that increased our ownership interest to a 67% controlling interest.
4
We acquired our first production plant in Amory, MS in late 2010 and, with modest incremental capital, quickly expanded its production by approximately 300%. Shortly thereafter, we acquired our second production plant in Wiggins, MS and we more than doubled its production during the ensuing year. Our experience in engineering, expanding and operating these assets helped prepare us to design, construct and commission our first new-build production plant on a former sawmill site in Ahoskie, NC. The Ahoskie plant's design and standardized set of processing equipment became the basis for our "build-and-copy" approach, which we successfully employed in 2012 and 2013 to construct our production plant in Northampton, NC and the Southampton, VA plant. Our sponsor acquired our Cottondale plant in January 2015 and contributed it to us in April 2015.
Production from our Ahoskie, Northampton and Southampton plants is exported through our Chesapeake terminal, which includes two purpose-built concrete storage domes with specialized product quality and safety control technologies. We export the production of our Amory and Wiggins plants from a third-party deep-water marine terminal in Mobile, AL (the "Mobile terminal") under a long-term contract. At the Mobile terminal, flexible barge-based storage and shiploading provide a cost-effective solution for the smaller product volumes we produce in that region. Additionally, production from the Cottondale plant is also exported through a third-party terminal in Panama City, FL (the "Panama City terminal") under a long-term contract.
We are able to maintain a low and stable cost structure due to the location of our production plants, our control of key infrastructure in our supply chain, our industrial-scale operations, our operating expertise and the standardization of our assets. Our production plants are strategically located in the Southeastern U.S., which gives us access to plentiful, low-cost wood fiber. Our in-house procurement team has established supplier relationships that enable us to reliably procure low-cost raw materials over long periods of time. In addition, our ownership of the Chesapeake terminal, and agreements to use the Ports of Panama City, FL and Mobile, AL, enable us to significantly reduce our shipping and logistics costs, and our long-term, fixed-price shipping contracts further stabilize our cost position. Our industrial-scale operations give us economies of scale, and our operating expertise allows us to lower manufacturing costs. The use of common equipment across our production plants enables us to maintain regional spare parts inventories and to develop cost-efficient training programs. We believe that our low-cost structure results in a high operating margin relative to others in our industry.
Our contracts
We have take-or-pay off-take contracts that supply utility-grade wood pellets to creditworthy counterparties, including large European power generators such as Drax, MGT Teesside Limited ("MGT"), Lynemouth Power Limited ("Lynemouth Power") and ENGIE (formerly known as GDF SUEZ Energy Management Trading). These contracts are predominantly U.S. dollar-denominated, but we expect to mitigate the impact of foreign currency fluctuations with currency derivatives and other offsets.
Under our existing off-take contracts, we are required to deliver pellet quantities approximately equal to all of the production capacity of our production plants. As of October 1, 2016, we had approximately $4.7 billion of product sales backlog for firm contracted product sales to major power generators. Backlog represents the revenue to be recognized under existing contracts assuming deliveries occur as specified in the contract. Our
5
off-take contracts provided for sales of 2.3 million metric tons of wood pellets in 2016 and have a weighted average remaining term of 9.6 years. Each contract provides for a base price subject to an annual inflation-based adjustment or price escalator. The majority of our production is sold under contracts that include terms designed to mitigate increases in raw material and distribution costs and protect us from certain changes in law.
As our current off-take contracts expire, we will seek to re-contract our capacity with a combination of renewals with existing customers, the assumption of additional contracts from our sponsor and the entry into contracts with new customers. For example, in May 2016, we entered into an 800,000 MTPY off-take contract to supply wood pellets to Lynemouth Power (the "Lynemouth Contract"), which plans to convert its coal-fired power station in the United Kingdom (the "UK") to consume wood pellets instead of coal. The Lynemouth Contract commences in the third quarter of 2017, ramps to full supply in 2018, and continues through the first quarter of 2027. Additionally, in August 2016, our contract with the Hancock JV (the "EVA-MGT contract") to supply 375,000 MPTY to the Hancock JV to satisfy a portion of its contracted volume to the Tees Renewable Energy Plant (the "Tees REP") became firm. This contract commences in 2019, ramps to full supply in 2021, and continues through 2034.
Our existing off-take contracts are predominantly U.S. dollar-denominated. Under the 800,000 MTPY Lynemouth Contract, 160,000 MTPY are denominated in British Pound Sterling. The EVA-MGT contract is also denominated in British Pound Sterling. While the foreign currency denominated volumes are a small portion of the production capacity, we have mitigated and expect to continue to mitigate the impact of foreign currency fluctuations with currency derivatives and other offsets.
As described under "—Our growth strategy" below, we believe global demand for utility-grade wood pellets will increase substantially, and we and our sponsor are in active discussions with current and prospective customers for contracts for substantial incremental production volumes.
Industry overview
Policymakers in many countries around the world, particularly in Europe, are grappling with an "energy trilemma": how to meet legally binding renewable energy and carbon reduction targets in a manner that is affordable and ensures the security of their electricity systems. In certain European Union ("EU") countries and the UK, there is a growing shortage of baseload generation capacity resulting from binding obligations to reduce GHG and other harmful emissions. The Renewable Energy Directive forms the legally binding target of 2020, and EU member states are legally required to reduce aggregate GHG emissions by 20% relative to the EU's GHG emissions in 1990. In addition to being required to substantially reduce aggregate GHG emissions, EU member states are legally required to achieve targets that, by 2020, would result in 20% of all energy supplied to the final consumer, which is referred to as "final energy consumption," coming from renewable sources. Like the UK, most EU member states are still significantly short of achieving their respective 2020 renewable targets, with renewable energy accounting for 16.0% of final energy consumption in the EU in 2014 (the latest year for which such data is currently available), four percentage points short of the 2020 mandate.
Our principal product, utility-grade wood pellets, is used as a substitute for coal in both dedicated and co-fired power generation and combined heat and power plants. It enables major power generators to profitably generate electricity in a manner that reduces the overall
6
cost of compliance with mandatory GHG emissions limits and renewable energy targets while also allowing countries to diversify their sources of electricity supply.
Unlike wind and solar power generation, wood pellet-fired plants are capable of meeting baseload electricity demand and are dispatchable (that is, power output can be switched on or off or adjusted based on demand). Shortages in baseload and dispatchable generation capacity are exacerbated by the growing use of wind and solar energy to generate electricity. Wind and solar generation, which only produce power when the wind is blowing or the sun is shining, present different challenges for electricity grid operators. The intermittent nature of these sources of electricity has resulted in wide swings in available capacity. Therefore, power generators and grid operators need back-up capacity that can fill the generation gap that results when these intermittent sources are unavailable and that also can be scaled back when intermittent sources are generating power. Additionally, according to Aurora Energy Research (2013), biomass conversion is increasingly perceived as the cost-effective, essential complement to other renewable energy sources, with a total cost of energy of 107 £/MWh. In comparison, the total costs of energy for offshore wind, onshore wind and solar energy are 149 £/MWh, 115 £/MWh and 167 £/MWh, respectively.
The capital costs required to convert a coal plant to co-fire biomass, or to burn biomass exclusively, are a fraction of the capital costs associated with implementing offshore wind and most other renewable technologies. Furthermore, the relatively quick process of converting coal-fired plants to biomass-fired generation is an attractive benefit for power generators whose generation assets are no longer viable as coal plants due to the expiration of operating permits or the introduction of taxes or other restrictions on fossil fuel usage or emissions of GHGs and other pollutants.
As a result, utilities and major power generators in Europe and Asia are making long-term, profitable investments in conversions and new builds of assets that either co-fire wood pellets with coal or are fully dedicated wood pellet-fired plants. Such developments help countries achieve mandatory reductions in GHG emissions and increases in renewable energy usage at a lower cost to consumers and taxpayers than other forms of energy generation that qualify as renewable.
The graphs on the following page depict the renewable energy consumption, in 2014, of certain EU member states and the shortfalls against their respective 2020 renewable energy
7
targets and their expected demand for industrial pellets through 2020. The shortfalls assume no change in final energy consumption between 2014 and 2020.
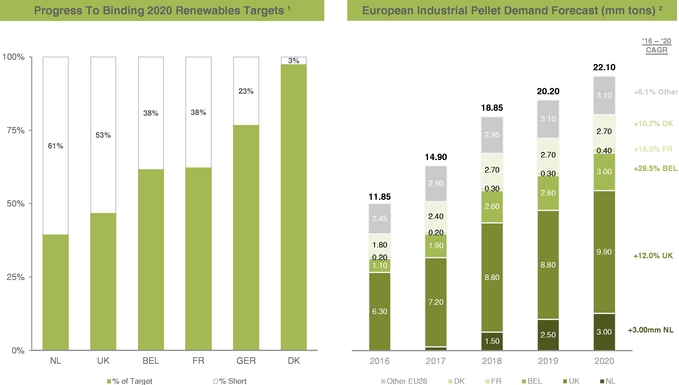
(1) Source: Eurostat News Release: "Share of renewables in energy consumption in the EU rose further to 16% in 2014" dated February 10, 2016.
(2) Source: Hawkins Wright: "The Outlook for Wood Pellets—Demand, Supply, Costs and Prices; Second quarter 2016" dated June 30, 2016.
Renewable energy initiatives in Europe and Asia
To reconcile competing priorities and deliver the required mix of secure, renewable and lower-carbon technologies at reduced cost, policymakers have tended to rely on private capital investment. To continue to attract the capital required for energy and infrastructure investments over the long term, governments are sensitive to investors' primary concern that the rules in place when an investment is made will be preserved for the duration of that investment, even if the rules governing future investments may change. In an environment of evolving policy frameworks for new projects, heads of governments, finance ministries and energy ministries are committed to "grandfathering," the principle of retaining the preexisting policy framework in place for a particular set of capital investments, recognizing that a stable regulatory regime is important to a country's wider reputation as an investment destination at a time of strong international competition for inward investment.
Denmark. Denmark's commitment to renewable energy generation is evidenced by its legally binding goal to derive 35% of all energy generation from renewable sources by 2020 (versus the EU-wide goal of 20%) and its long term political goal to have its entire energy supply (electricity, heating, industry and transportation) sourced from renewable energy by 2050. Denmark provides carbon and energy tax exemptions for biomass derived heat and additional financial incentives for electricity based on biomass. Currently, there are 9 large scale biomass projects totaling 2,179 MW operating or under construction in Denmark.
8
Belgium. Belgium's commitment to renewable energy generation is long-standing. Producers of electricity from renewable sources, including biomass, are issued Green Certificates ("GCs") (based on mega-watt hour) which are used to demonstrate compliance with regional renewable energy generation obligations. GCs can also be obtained on the open market. Failure to present the required number of GCs may result in a financial penalty. The 556MW Langerlo power station has plans to convert to biomass by 2018, requiring 1.8 million MTPY. Additionally, the Wallonia regional government has launched a tender for 200MW of biomass capacity.
United Kingdom. The UK, through the Climate Change Act of 2008, became the first country to create a long term binding law to reduce GHG emissions. The Climate Change Act of 2008 mandates a 50% reduction in GHG emissions by 2025 and an 80% reduction in GHG emissions by 2050, in each case, relative to 1990 levels. The 5th carbon budget, released after the Brexit referendum vote, updated this goal to 57% reduction in carbon emissions by 2030. Further, the UK has independent plans to close all unabated coal-fired power plants by 2025. In 2013, the UK government introduced its Electricity Market Reform policy to (i) incentivize investment in secure, low carbon electricity by providing long-term revenue stabilization for renewable electricity generators, primarily through the Contracts for Differences, (CfD) mechanism and (ii) improve the security of electricity supply. The UK's largest coal fired power station operated by Drax has converted three of its six plants from coal to biomass. There are additional large scale projects under development, including the planned conversion of the 420MW Lynemouth power station in 2017 and the new build 299MW MGT Power plant in 2019.
Netherlands. In the Netherlands, the Stimulation of Sustainable Energy Production ("SDE+") support policy was introduced in 2011 as the country's renewable energy incentive program. Under the auction program, the government grants a premium above the wholesale price of electricity to the renewable electricity generator, payable for up to 15 years. In 2016, the Netherlands increased its 2016 auction budget for new renewable energy programs from €3.5 billion to €8.0 billion under the SDE+. In the first round of auctions in 2016, €1.5 billion of incentive payments were awarded for biomass generation.
Japan. In Japan, there is an increasing focus on reducing carbon emissions and replacing nuclear power following the Fukushima disaster. Renewable energy generation is supported by the country's feed-in-tariff ("FIT") system implemented in 2012. This system provides 20 year support for renewable electricity generation, starting from the date the electricity supply is "turned on" under a supply contract. There are multiple biomass projects currently identified in various stages of development in Japan, including a mix of co-firing, dedicated biomass and conversions.
South Korea. In South Korea, the Renewable Portfolio Standard was introduced in 2012, setting defined percentages of renewable energy required to be produced by 13 generating companies which previously relied on coal assets. The required ratio is currently 3.5%, increasing to 6% by 2020. Further, on January 1, 2015, the South Korean government launched a nationwide cap-and-trade program on carbon emissions with the goal of reducing GHG emissions by 37% below the "business as usual" scenario for 2030 (which equates to a 22% reduction versus 2012 emissions levels). With this backdrop, South Korea's generating companies continue to purchase regular quantities of biomass through open tenders.
9
Worldwide demand for wood pellets
Worldwide demand for utility-grade wood pellets is projected to grow significantly. According to Hawkins Wright, the demand for utility-grade wood pellets is estimated to have been 10.9 million MTPY in 2014 and 13.2 million MTPY in 2015 and is expected to grow to 14.0 million MTPY in 2016, 17.5 million MTPY in 2017, 22.4 million MTPY in 2018 and 24.7 million MTPY in 2019. This represents a CAGR of approximately 16% from 2015 to 2020. Europe is expected to constitute the most significant portion of forecasted demand. According to Eurostat data, the European Union's imports of wood pellets have grown rapidly over recent years, from 1.7 million MT in 2009 to 8.1 million MT in 2014, which equates to a CAGR of 36%. The principal non-EU suppliers are the U.S. and Canada. In Japan, significant growth in wood pellet demand is expected to continue through 2030, when demand is expected to be about 10.0 million MTPY. In South Korea, demand is expected to grow to 2.9 million MTPY in 2020.
Although worldwide demand for utility-grade wood pellets is expected to be 27.3 million MTPY by 2020, production capacity as of June 30, 2016 is estimated by Hawkins Wright to be only 17.5 million MTPY. Identified wood pellet projects presently under construction or that have committed sources of financing are expected to raise production capacity to only 19.7 million MTPY by the end of 2018.
The resulting 7.6 million MTPY gap between identified supply and forecasted 2020 demand will require the development of substantial additional sources of supply, thereby creating considerable growth opportunities for us.
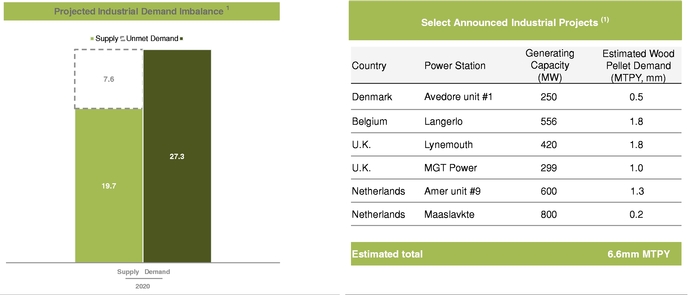
(1) Source: Hawkins Wright: "The Outlook for Wood Pellets—Demand, Supply, Costs and Prices; Second quarter 2016" dated June 30, 2016; Note 19.7 million MTPY of supply comprises current capacity plus capacity under construction or financed for completion by 2018.
A substantial number of additional wood pellet production plants, as well as associated export terminals and logistics infrastructure, must be built if the gap between forecasted demand and identified supply is to be closed. Assuming a typical investment cost of approximately $220 per MT of wood pellet production capacity, approximately $1.7 billion will need to be invested in such plants by 2020. Due to its abundant forest resources, low wood fiber cost and established
10
logistics infrastructure, the Southern U.S., where our production plants are located, is currently the preeminent wood pellet producing region.
There also continues to be significant growth in the demand for wood pellets to heat homes and commercial buildings and to produce process heat at industrial sites. Global wood pellet consumption for residential- and commercial-scale heating is estimated by Hawkins Wright to have been 13.7 million MT in 2014 and 14.6 million MT in 2015, and this is projected by Hawkins Wright to grow to approximately 15.2 million MT in 2016, 15.9 million MT in 2017, 16.6 million MT in 2018, 17.3 million MT in 2019 and 18.0 million MT in 2020, which represents a CAGR of 4.3% from 2015 to 2020. As the markets develop and commoditize, there will continue to be opportunities for utility-grade wood pellet producers to serve this growing demand.
National governments are also taking decisive steps to ensure that only sustainable biomass is used as an energy source, including by implementing rigorous sustainability rules. For example, in the UK, all power generators using solid biomass have been required to report against a set of sustainability criteria since April 2013. Industry organizations are also developing their own voluntary sustainability principles. The Sustainable Biomass Partnership, a coalition of major European utilities, is working closely with European governments, wood pellet producers and other stakeholders to develop sustainability standards. Wood pellet producers demonstrate their commitment to sustainable forest management practices through adherence to an independent third party audit of their activities under the stringent standards of the world's foremost forestry certification bodies, such as the Forest Stewardship Council™, the Programme for the Endorsement of Forest Certification and the Sustainable Forestry Initiative®. We have created a first-of-its kind, proprietary Track and Trace program to track the origin and characteristics of fiber that we use. We intend to publish this information, providing unprecedented transparency into our fiber sourcing activities.
Our growth strategy
As the largest supplier by production capacity in the industry, and because of our relationships with major Northern European and Asian customers, we believe that we are well positioned to capture a significant portion of expected future demand growth.
There are several opportunities for us to grow our business:
- •
- First, we expect to increase cash flow from existing assets and improve our margins through increased scale and optimization in the operation
of our production plants and within our supply chain.
- •
- Second, to promote our growth, our sponsor has granted us a right of first offer to acquire any wood pellet production plants and associated
deep-water marine terminals that it may develop and determine to sell during the term of the ROFO.
- •
- Third, we will continue to seek to grow our business through third-party acquisitions. We intend to pursue future acquisition opportunities only when they are supported by our own or acquired off-take contracts, and we do not plan to acquire assets that are in development or early stages of construction.
11
We also intend to capitalize on our existing relationships with customers to capture a significant portion of growing worldwide demand. Our sales force is in active contract negotiations with creditworthy counterparties for additional long-term supply. We expect to continue to expand our geographic reach to further serve South Korean and Japanese demand. In addition, the wood pellets produced from our plants are suitable for uses other than industrial power generation, including commercial and residential heating, manufactured wood products and chemicals. We will continue to evaluate these markets as they develop and will pursue favorable sales opportunities.
Business strategies
Our primary business objective is to generate stable and growing cash flows. We intend to accomplish this objective by executing the following strategies:
- •
- Fully contracting our production with creditworthy customers on terms that provide
predictable, growing cash flows. We have long-term, take-or-pay off-take contracts with creditworthy counterparties, including large European
power generators. Many of our contracts have commercial protections designed to mitigate the impact of changes in inflation, raw material costs, distribution costs and certain other costs, thereby
increasing the stability of our cash flows. Given our market position and track record, we believe we will be able to continue to obtain contracts in the future with creditworthy customers that
provide for geographic and customer diversification.
- •
- Growing our business through drop-down and third-party
acquisitions. We believe that our current scale of operations and relationship with our sponsor provide us with a platform for growth through
accretive acquisitions that are complementary to our existing portfolio of assets. Our sponsor has granted us a ROFO to acquire any wood pellet production plants and associated deep-water marine
terminals it may develop in the future and determine to sell during the term of the ROFO. We refer to acquisitions from our sponsor or the Hancock JV as "drop-down" acquisitions. We also believe that
we are well-positioned to acquire production plants and deep-water marine terminals from third parties as a result of our knowledge of the industry, operating expertise, control of existing deep-water
marine terminals and access to capital. We intend to pursue acquisition opportunities only when they are supported by our own or acquired long-term off-take contracts.
- •
- Expanding margins through operational
excellence. We can expand our margins by generating incremental revenues through increased production at our existing production plants and from
price adjustments for delivery of superior quality products. Our operational excellence is derived from our focus on plant reliability and uptime, raw material conversion efficiency, optimization of
raw material mix and a management philosophy of continuous improvement.
- •
- Maintaining sound financial practices. We intend to maintain a conservative capital structure that, when combined with our stable, contracted cash flows, should afford us access to capital at a competitive cost. Consistent with our disciplined financial approach, over the long term, we intend to fund our expansion and acquisition projects through a combination of debt and equity issuances. We believe this approach will provide us the flexibility to pursue accretive acquisitions and organic growth projects as they become available.
12
Competitive strengths
As a leader in an industry with significant projected demand growth, we believe we have developed the following competitive strengths that will enable us to successfully execute our growth strategy and achieve our primary business objective:
- •
- Our low-cost position. We believe
we have a cost-advantaged position in our industry for the following reasons:
- •
- Strategically located production plants and deep-water marine
terminals. Our production plants are strategically located in the Southeastern U.S., one of the most attractive wood fiber regions in the world
due to its abundance of commercial, working forests, growing timber inventories and logistics infrastructure. Approximately 56% of the world's utility-grade wood pellet production capacity is located
in North America. Consequently, we believe that we are able to access raw materials more cheaply and reliably than competitors whose operations are located in other regions. Furthermore, the proximity
of our production plants to the Chesapeake terminal, the Mobile terminal and the Panama City terminal results in low "to-port" transportation costs. Finally, we are able to secure favorable long-term,
fixed price, predominately US dollar-denominated shipping contracts due to our terminals' locations in relation to trade flows between Europe and the Americas.
- •
- Large scale of operations. We
benefit from economies of scale at each level of our procurement, production, logistics and terminaling operations, which enable us to spread our fixed costs over wood pellet volumes substantially
greater than the average producer in our industry.
- •
- Deep process know-how. As the
largest and one of the most established operators in the industry, we and our sponsor have designed, engineered, built and expanded multiple production plants and a deep-water marine terminal for our
products. Our operational experience helps us maintain uptime, throughput, overall performance and cost efficiency at levels we believe few of our competitors can replicate.
- •
- Vertical integration. We have
made investments to control key areas of our supply chain, in particular our in-house wood fiber procurement activities and our Chesapeake terminal:
- •
- In-house wood fiber
procurement. We have built an in-house procurement team of 26 employees with an average of over 22 years of experience developing
national, regional and local relationships with current and potential wood fiber suppliers. As of 2007, more than 60% of Southern U.S. timber resources were owned by individuals and small companies.
As a result of the fragmented nature of tract ownership, our team procures raw materials from thousands of landowners, loggers and timber industry participants, with no individual landowner
representing a material fraction of any of our production plants' needs. Direct access to, and quality relationships with, this fragmented ownership base enable us to reliably procure low-cost wood
fiber.
- •
- Terminal operations. We own or control critical storage and logistics assets capable of exporting industrial-scale quantities of wood pellets in an economic manner. Because access to this infrastructure is limited, our ownership of the Chesapeake terminal secures our ability to export approximately half of our total production and enables us to
13
generate incremental margin from third parties by managing throughput of their products. Owning the Chesapeake terminal also reduces our storage and loading costs and allows us to directly control inventory and preserve the quality of our products. Finally, because we maintain control over shipping schedules by virtue of our ownership of the Chesapeake terminal and our contractual arrangements at third party ports, we minimize the risk of incurring demurrage costs associated with shiploading delays and the working capital associated with inventory.
- •
- Quality and reliability of our
products. The uninterruptible nature of baseload power generation requires consistent delivery of high-quality fuel that meets or exceeds
customer specifications. Our production processes, in-house control labs and testing procedures, as well as our storage and logistics network, ensure the quality of our products until they reach our
customers. In addition, our customers are subject to stringent requirements regarding the sustainability of the fuels they procure. We believe we are a preferred supplier to the major customers in our
industry because of the quality and consistency of our products, the reliability of our deliveries and our ability to verify and document, through customer and third-party audits, that our products
meet our customers' regulatory sustainability obligations. We make wood pellets only with low-grade or leftover wood. On average, we receive about 34% of the volume of wood from an individual harvest
and we contribute about 9% of the economic value of an individual harvest. We have created a first-of-its kind, proprietary Track and Trace program to track the origin and characteristics of fiber
that we use. We intend to publish this information, providing unprecedented transparency into our fiber sourcing activities.
- •
- Our relationship with Enviva Holdings, a committed sponsor with well-capitalized
owners. Our sponsor is an experienced acquirer and developer of industrial-scale wood pellet production plants and deep-water marine terminals
and has acquired or developed all of the assets that constitute our business. Acting through the Hancock JV, our sponsor recently completed the construction of the Sampson plant. Our sponsor is also
nearing the completion of the construction of the Wilmington terminal and has permitted and commenced detailed design for the Hamlet plant. Our sponsor has granted us a ROFO to acquire these assets
and similar assets it may develop in the future and determine to sell during the term of the ROFO. We expect to pursue the acquisition of assets subject to the ROFO to the extent that they are
supported by long-term off-take contracts with creditworthy counterparties and have long useful lives, stable cost positions and advantaged locations. As the owner of approximately 10.3% of our common
units, all of our subordinated units, all of the incentive distribution rights and our general partner, our sponsor is incentivized to facilitate our access to accretive acquisition and organic growth
opportunities.
- •
- Experienced management. As recognized leaders at the forefront of our industry, the members of our management team have extensive experience in the commercial development and operation of wood pellet production plants and logistics assets throughout the U.S., Latin America, the Caribbean and Europe. They have developed strong relationships with our Northern European and Asian customer base. Members of our management team average approximately 18 years of relevant experience from the forestry, traditional wood products, midstream energy, engineering and construction and general industrial manufacturing sectors, in addition to experience at Fortune 500 companies and publicly
14
traded master limited partnerships. Our management team's ability to develop and maintain customer relationships, operate our business in a cost-effective manner and efficiently integrate acquisitions is crucial to the continued growth of our business.
Our sponsor's assets and development projects
The Hancock JV recently completed construction of the Sampson plant and operations teams assumed control of the plant in August 2016. For more information on the Sampson Acquisition, please read the section entitled "—Overview—Offer to acquire the Sampson plant and related contracts and assets," above.
Long-term, take-or-pay off-take contracts
The Hancock JV is party to a ten-year take-or-pay off-take contract with DONG Energy. This contract commenced September 1, 2016 and provides for sales of 355,000 MTPY for the first delivery year and 420,000 MTPY for years two through ten. DONG Energy's obligations under the contract are guaranteed by DONG Energy A/S. If the Sampson Acquisition is completed, we will acquire this contract.
The Hancock JV also has a take-or-pay off-take contract (the "MGT Contract") to supply MGT's Tees REP with nearly 1.0 million MTPY of wood pellets. Deliveries under the MGT Contract are expected to commence in 2019 and continue through 2034. Pursuant to the EVA-MGT contract, the Partnership will supply 375,000 MTPY of the Hancock JV's contracted volume to the Tees REP. If the Sampson Acquisition is completed, we will acquire a contract for an additional 95,000 MTPY with the Hancock JV that it will resell to the Tees REP.
In addition to these contracts, our sponsor's sales force is in active contract negotiations with creditworthy counterparties for additional long-term supply.
Sponsor development projects
Wilmington terminal. The Hancock JV is nearing completion of the construction of a deep-water marine export terminal in the Port of Wilmington, North Carolina. To construct and complete this facility, the Hancock JV entered into a long-term lease agreement of a site owned by the North Carolina State Ports Authority. The Wilmington terminal is contracted for shipments of approximately 1.0 million MTPY, including production from the Sampson plant and third party wood pellet volumes, and the Wilmington terminal will also service the production from the Hamlet plant described below. The first shipments out of the Wilmington port are expected to occur in October 2016. Our sponsor expects the Wilmington terminal to generate incremental adjusted EBITDA of approximately $7.0 million (which we expect to increase to approximately $13.0 million once the Hamlet plant is fully operational) and incur approximately $0.3 million of maintenance capital expenditures annually.
The foregoing estimates of annual adjusted EBITDA and maintenance capital expenditures for the Sampson plant and the Wilmington terminal are based on numerous estimates and assumptions made by us that are inherently uncertain, and are subject to significant risks and uncertainties, all of which are difficult to predict and many of which are beyond our control.
Hamlet plant. Our sponsor has permitted and commenced detailed design for a production plant located near Hamlet, North Carolina, which is strategically sited in an attractive wood fiber basket and will be constructed using our "build and copy" approach, including
15
substantially the same design and equipment as the Sampson plant. Production from the fully-financed and fully-contracted Hamlet plant will be terminaled under a long-term agreement with the Wilmington terminal.
Other development projects. In addition to the projects discussed above, our sponsor is pursuing the development of additional deep-water marine terminals and production plants. Our sponsor has entered into a Memorandum of Understanding with the Mississippi Development Authority regarding the development of new dry-bulk storage and deep-water terminaling capacity for wood pellets in the Port of Pascagoula, MS, which would service new, regionally proximate production plants, including one production plant in Lucedale, MS.
Although we expect to continue to have the opportunity to acquire assets from our sponsor or the Hancock JV in the future, there can be no assurance that our sponsor or the Hancock JV will be successful in completing their development projects or that our sponsor will decide to sell, or compel the Hancock JV to sell, assets or completed development projects to us.
Recent developments
At-the-market equity offering program
On August 8, 2016, we commenced an at-the-market equity offering program, whereby we may sell from time to time, our common units up to an aggregate offering amount of $100,000,000. We intend to use the net proceeds of any sales pursuant to the program for general partnership purposes, including repayment of debt, acquisitions, capital expenditures and working capital. Our at-the-market equity offering program is being made pursuant to a separate registration statement and related prospectus supplement and this offering memorandum is not part of such offering program, nor is this offering memorandum an offer to sell or a solicitation of an offer to buy any common units.
Amendment to Senior Secured Credit Facilities
On or prior to the closing of this offering, we will enter into a second amendment to the credit agreement governing our Senior Secured Credit Facilities (the "Credit Agreement Amendment"). The Credit Agreement Amendment increases the size of our revolving credit facility from $25.0 million to $100.0 million, which increase is conditioned upon the repayment of the A-2 and A-4 tranches of term loan indebtedness outstanding under the Senior Secured Credit Facilities. We intend to use a portion of the net proceeds of this offering, together with cash on hand or cash from additional sales of equity, to repay such term loan indebtedness, and, as a result, the increase of the size of our revolving credit facility is dependent upon the closing of the Sampson Acquisition and the release of proceeds from the escrow account.
We refer to the Credit Agreement Amendment, the Sampson Acquisition, this offering and the use of net proceeds therefrom collectively in this offering memorandum as the "Transactions."
Contemplated equity offerings prior to the consummation of the Sampson Acquisition
We expect to issue approximately $30.0 million of equity in connection with the Transactions, potentially under our existing at-the-market equity offering, in an underwritten offering or directly to investors. We and our sponsor are considering in the alternative whether the consideration for the Sampson Acquisition should include an equity component, and both we and our sponsor would have to agree to any such equity component. Any such offering will be
16
subject to market conditions and may not be consummated in advance of the Sampson Acquisition or at all. Neither this offering, the release of the proceeds from escrow in connection with the closing of the Transactions, nor the Sampson Acquisition is contingent on the completion of any such equity offering. Any such equity offering will be made pursuant to a separate registration statement or in transactions exempt from registration under the Securities Act, and this offering memorandum is not part of any such offering or sale, nor is this offering memorandum an offer to sell or a solicitation of an offer to buy any common units or other equity of the Partnership.
Currency and interest rate hedges
We have executed foreign currency derivatives to hedge, and expect to continue to hedge, a portion of our foreign currency exchange rate risk associated with our exposure to fluctuations in the U.S. dollar-to-British Pound Sterling exchange rates through sales under our Lynemouth Contract and EVA-MGT Contract. In addition, we have entered into an interest rate swap to fix the effective interest rate of a portion of our long-term debt.
Preliminary financial results for the third quarter of 2016
The following amounts are estimates of certain key financial results that we expect for the three months ended September 30, 2016:
- •
- Estimated net revenues of between $115.0 million and $116.0 million;
- •
- Estimated net income of between $12.5 million and $13.0 million;
- •
- Estimated adjusted gross margin of between $29.0 and $30.0;
- •
- Estimated adjusted EBITDA of between $25.0 million and $26.0 million; and
- •
- Estimated distributable cash flow of between $21.0 million and $21.5 million.
We have provided ranges for the preliminary estimated financial results described above because our financial closing procedures for the three months ended September 30, 2016 are not complete. We currently expect that our final results will be within the ranges described above. The preliminary estimated financial results presented above are subject to the completion of our quarter-end financial closing procedures. Our closing procedures for the three months ended September 30, 2016 will not be complete, and our financial results for the three months ended September 30, 2016 will not be publicly available, until after the expected completion of this offering. The information presented above should not be considered a substitute for unaudited quarterly financial statements.
The preliminary information presented in this "Recent developments" section has been prepared by and is the responsibility of management and reflects management's estimates based solely upon information available to us as of the date of this offering memorandum. Our actual results may differ materially from these estimated ranges. For example, during the course of the preparation of the respective financial statements and related notes, additional items that would require material adjustments to be made to the preliminary estimated financial information presented above may be identified. Our independent registered public accounting firm, KPMG LLP, has not audited, reviewed, compiled or performed any procedures on this preliminary information. Accordingly, KPMG LLP does not express an opinion or any other form of assurance with respect thereto. Accordingly, you should not place undue reliance upon these preliminary estimates. These preliminary results should be read in conjunction with "Management's discussion and analysis of financial condition and results of operations," in
17
particular "—Results of operations" and the consolidated financial statements and related notes contained in this offering memorandum and "Summary historical financial and operating data—Non-GAAP financial measures."
The following table reconciles our range of estimated adjusted EBITDA and distributable cash flow to estimated net income for the three months ended September 30, 2016:
| |
|
|
|
|
|||||||
|---|---|---|---|---|---|---|---|---|---|---|---|
| | | | | | | | | | | | |
| |
Three months ended September 30, 2016 |
||||||||||
| | | | | | | | | | | | |
| |
(estimated data) (in millions) |
||||||||||
Reconciliation of adjusted EBITDA and distributable cash flow to net income (loss): |
|||||||||||
Net income (loss) |
between | $ | 12.5 | and | $ | 13.0 | |||||
Add: |
|||||||||||
Depreciation and amortization |
between | 6.7 | and | 6.8 | |||||||
Interest expense |
between | 3.3 | and | 3.4 | |||||||
Early retirement of debt obligation |
between | — | and | — | |||||||
Purchase accounting adjustment to inventory |
between | — | and | — | |||||||
Non-cash unit compensation expense |
between | 1.1 | and | 1.2 | |||||||
Income tax expense |
between | — | and | — | |||||||
Asset impairments and disposals |
between | 1.4 | and | 1.6 | |||||||
Acquisition transaction expenses |
between | — | and | — | |||||||
| | | | | | | | | | | | |
Adjusted EBITDA |
between | $ | 25.0 | and | $ | 26.0 | |||||
| | | | | | | | | | | | |
Less: |
|||||||||||
Interest expense net of amortization of debt issuance costs and original issue discount |
between | 3.0 | and | 3.1 | |||||||
Maintenance capital expenditures |
between | 1.0 | and | 1.4 | |||||||
Distributable cash flow attributable to Enviva Partners, LP |
between | $ | 21.0 | and | $ | 21.5 | |||||
| | | | | | | | | | | | |
The following table reconciles our range of estimated adjusted gross margin to estimated gross margin for the three months ended September 30, 2016:
| |
|
|
|
|
|||||||
|---|---|---|---|---|---|---|---|---|---|---|---|
| | | | | | | | | | | | |
| |
Three months ended September 30, 2016 |
||||||||||
| | | | | | | | | | | | |
| |
(estimated data) (in millions) |
||||||||||
Reconciliation of adjusted gross margin to gross margin: |
|||||||||||
Gross margin |
between | $ | 22.3 | and | $ | 23.2 | |||||
Depreciation and amortization |
between | 6.7 | and | 6.8 | |||||||
| | | | | | | | | | | | |
Adjusted gross margin |
between | $ | 29.0 | and | $ | 30.0 | |||||
| | | | | | | | | | | | |
Summary of conflicts of interest and fiduciary duties
Although our relationship with our sponsor may provide significant benefits to us, it may also become a source of potential conflicts. For example, our sponsor and the Hancock JV are not restricted from competing with us. In addition, the executive officers and certain of the
18
directors of our general partner also serve as officers or directors of our sponsor, and these officers and directors face conflicts of interest, including conflicts of interest regarding the allocation of their time between us and our sponsor and the Hancock JV.
Our general partner has a contractual duty to manage us in a manner that it believes is not adverse to our interest. However, the officers and directors of our general partner have fiduciary duties to manage our general partner in a manner beneficial to our sponsor, the owner of our general partner. As a result, conflicts of interest may arise in the future between us or our unitholders, on the one hand, and our sponsor and our general partner, on the other hand.
Our partnership agreement limits the liability of and replaces the fiduciary duties owed by our general partner to our unitholders.
Principal executive offices
Our principal executive offices are located at 7200 Wisconsin Avenue, Suite 1000, Bethesda, MD 20814, and our telephone number is (301) 657-5560. Our website address is http://www.envivapartners.com. Our periodic reports and other information are filed with or furnished to the U.S. Securities and Exchange Commission ("SEC") available free of charge through our website as soon as reasonably practicable after those reports and other information are electronically filed with or furnished to the SEC. Information on our website or any other website is not incorporated by reference into this offering memorandum and does not constitute a part of this offering memorandum.
19
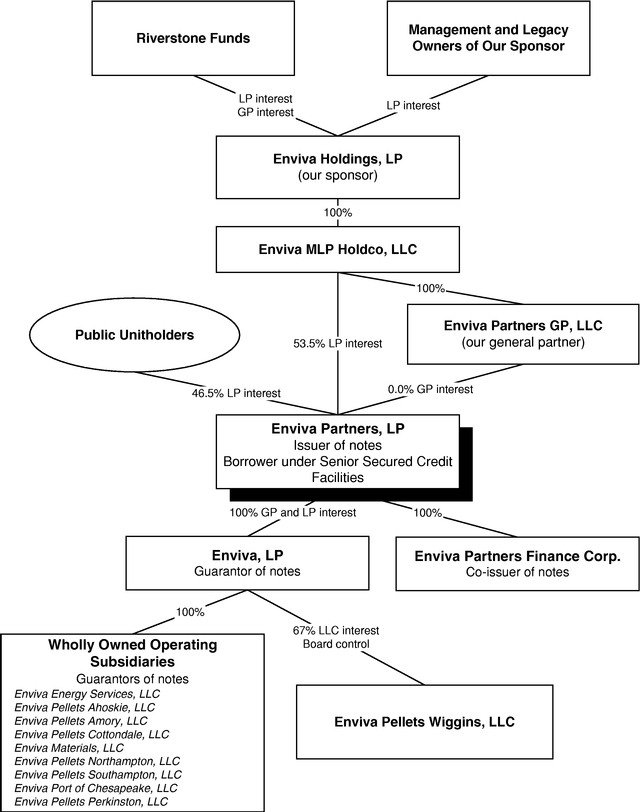
Organizational structure
The following is a simplified diagram of our ownership structure after giving effect to this offering and the related transactions.
20
The summary below describes the principal terms of the notes. Certain of the terms and conditions described below are subject to important limitations and exceptions. The "Description of Notes" section of this offering memorandum contains a more detailed description of the terms and conditions of the notes.
| Issuers | Enviva Partners, LP and Enviva Partners Finance Corp. | |
Enviva Partners Finance Corp., a Delaware corporation, is a wholly-owned subsidiary of the Partnership that has been formed for the sole purpose of being a co-issuer of some of our indebtedness, including the notes offered hereby. Enviva Partners Finance Corp. has no operations of any kind and has no revenue other than as may be incidental to its activities as a co-issuer of the notes offered hereby. |
||
Notes offered |
$300.00 million aggregate principal amount of % Senior Notes due 2021. |
|
Interest |
The notes will accrue interest from , 2016 at the rate of % per year. Interest on the notes will be payable semi-annually in arrears on each and , commencing on , 2017. |
|
Maturity date |
, 2021. |
|
Guarantees |
The notes will initially be guaranteed on a senior unsecured basis by all of our existing subsidiaries (other than Enviva Partners Finance Corp. and Enviva Pellets Wiggins, LLC) and by our future restricted subsidiaries that guarantee certain of our indebtedness, including under our Senior Secured Credit Facilities. |
|
Security |
Prior to the Escrow Release Date, the notes will be secured solely by a first-priority security interest in the escrow account. After the Escrow Release Date, the notes will be unsecured. |
21
| Ranking | The notes and the guarantees will be general unsecured obligations of the issuers and the guarantors and will be pari passu in right of payment with all of the issuers' and the guarantors' existing and future senior indebtedness. The notes and the guarantees will be senior in right of payment to any of the issuers' and the guarantors', respectively, future subordinated indebtedness, if any. The notes will be structurally subordinated in right of payment to all indebtedness of any of the issuers' non-guarantor subsidiaries. The notes and the guarantees will be effectively subordinated to the issuers' and the guarantors', respectively, existing and future secured obligations, including all borrowings under the Senior Secured Credit Facilities and guarantees thereof, to the extent of the value of the assets securing such indebtedness. As of June 30, 2016, as adjusted to give effect to the Transactions, our outstanding senior indebtedness would have been approximately $382.2 million, of which $82.2 million would have been secured, and approximately $96.0 million would have been available for additional borrowings under our revolving credit facility. For further discussion, see "Description of other indebtedness." | |
Optional redemption |
At any time prior to , 2018, we may redeem up to 35% of the aggregate principal amount of the notes, at a redemption price equal to % of the principal amount, plus accrued and unpaid interest, if any, to the redemption date, with an amount of cash not greater than the net proceeds from one or more equity offerings, provided that at least 65% of the aggregate principal amount of the notes issued in this offering remains outstanding immediately after the occurrence of such redemption (excluding notes held by us and our subsidiaries) and redemption occurs within 120 days of the date of the closing of such equity offering. |
|
In addition, we may redeem some or all of the notes on or after , 2018 at the redemption prices set forth in this offering memorandum, plus accrued and unpaid interest, if any, to the redemption date. The redemption prices are described under "Description of Notes—Optional Redemption." |
||
Prior to , 2018, we may, at our option, redeem the notes in whole or in part, at a redemption price equal to the principal amount of the notes plus a "make-whole" premium and accrued and unpaid interest, if any, to the redemption date. |
22
| Offer to repurchase | If we or our restricted subsidiaries sell assets, or experience a change of control followed by a rating decline, unless we have previously or concurrently exercised our right to redeem all of the notes as described under "—Optional redemption," we may be required to offer to repurchase the notes at the prices set forth under "Description of Notes—Repurchase at the option of holders." | |
Escrow of proceeds; Special mandatory redemption |
At the closing of this offering, the issuers will deposit into an escrow account the gross proceeds of this offering, to be held by the JPMorgan Chase Bank, N.A., acting as escrow agent, pursuant to an escrow agreement to be entered into between the issuers and the trustee. The escrowed funds will be held in an escrow account pending negotiation and completion of the Sampson Acquisition. The escrow agent will release all escrowed funds to us or at our direction upon delivery by us to the escrow agent, with a copy to the trustee, no later than the Outside Date, of an officers' certificate to the effect that all conditions to the completion of the Sampson Acquisition have been satisfied or waived or are capable of being immediately satisfied and that the Sampson Acquisition will be consummated concurrently with or promptly after the release of the escrowed funds, among other conditions. |
|
If the conditions to the release of the escrowed funds have not occurred by the Outside Date, or on any date prior to the Outside Date we shall have determined that the escrow release conditions will not be satisfied by the Outside Date, then the notes will be subject to a special mandatory redemption at a redemption price payable in cash equal to 100.0% of the initial issue price of the notes, plus accrued and unpaid interest to the mandatory redemption date. |
||
Certain covenants |
The indenture governing the notes will contain covenants that will limit our ability and the ability of our restricted subsidiaries to, among other things: |
|
|
• incur additional indebtedness; |
|
|
• make investments; |
|
|
• sell assets; |
|
|
• incur certain liens; |
23
|
• pay distributions or dividends on equity or purchase, redeem or otherwise acquire equity; |
|
|
• enter into transactions with affiliates; and |
|
|
• consolidate, merge or sell all or substantially all of our assets. |
|
These covenants will be subject to important exceptions and qualifications, which are described under the heading "Description of Notes" in this offering memorandum. |
||
At any time after the notes are rated investment grade by both Moody's and S&P (provided at such time no default or event of default has occurred and is continuing under the indenture), many of the foregoing covenants will be suspended. See "Description of Notes—Covenant Suspension." |
||
Exchange offer; registration rights |
In connection with the issuance of the notes, we and the guarantors will agree to file a registration statement with the SEC so that you can exchange the notes purchased in this private placement for registered notes that have substantially identical terms as the notes and exchange the related guarantees for registered guarantees having substantially the same terms as the original guarantees. In this offering memorandum, we refer to such registered notes as the "exchange notes." We will use commercially reasonable efforts to cause the exchange to be completed within 365 days after the issuance of the notes. We and the guarantors will also agree to file a shelf registration statement for the resale of the notes and guarantees if we cannot effect the exchange offer within the time period listed above and in certain other circumstances. We will be obligated to pay additional interest if we do not comply with this obligation within this time period. See "Exchange offer; registration rights." |
|
Transfer Restrictions |
We have not registered the notes under the Securities Act. The notes are subject to restrictions on transfer and may be offered only in transactions exempt from or not subject to the registration requirements of the Securities Act. See "Transfer restrictions." |
24
| Absence of a public market for the notes | The notes are a new issue of securities and there is currently no established market for them. If issued, the exchange notes generally will be freely transferable but will also be new securities for which there will not initially be a market. We do not intend to apply for a listing of the notes, or, if issued, the exchange notes, on any securities exchange or an automated dealer quotation system. Accordingly, there can be no assurance as to the development or liquidity of any market for the notes or exchange notes. The initial purchasers have advised us that they currently intend to make a market for the notes and, if issued, the exchange notes as permitted by applicable laws and regulations. However, they are not obligated to do so and may discontinue any such market making activities at any time without notice. | |
Denominations |
The notes will be issued in denominations of $2,000 and in integral multiples of $1,000 in excess thereof. |
|
Governing law |
The notes and the indenture will be governed by the laws of the State of New York. |
25
| Use of proceeds | We estimate that we will receive net proceeds of approximately $293.0 million from this offering after deducting initial purchasers' discounts and commissions and our estimated offering expenses. At the closing of this offering, the issuers will deposit into an escrow account the gross proceeds of this offering, to be held by the escrow agent pending negotiation and completion of the Sampson Acquisition. If the conditions to the release of the escrowed funds has not occurred by the Outside Date, or on any date prior to the Outside Date we shall have determined that the escrow release conditions will not be satisfied by the Outside Date, then the notes will be subject to a special mandatory redemption at a redemption price payable in cash equal to 100.0% of the initial issue price of the notes, plus accrued and unpaid interest to the mandatory redemption date. If the Sampson Acquisition is completed, we expect to use a portion of the net proceeds, together with cash on hand or net proceeds from sales of additional equity, to fund the consideration payable by us in connection with the Sampson Acquisition, including the purchase price to be negotiated and determined by the conflicts committee of our general partner, and the remainder to repay (a) $100.4 million of borrowings outstanding under the A-2 and A-4 tranches of term loan indebtedness under our Senior Secured Credit Facilities and (b) $24.6 million of additional indebtedness under our Senior Secured Credit Facilities. We and our sponsor are also considering whether the consideration for the Sampson Acquisition should include an equity component as an alternative to sales of additional equity, and both we and our sponsor would have to agree to any such equity component. | |
Risk factors |
You should consider all of the information contained in or incorporated by reference into this offering memorandum before making an investment in the notes. In particular, you should consider the factors described under "Risk factors," beginning on page 32 and incorporated by reference in this offering memorandum. |
26
Summary historical financial and operating data
The following table sets forth summary historical financial and operating data as of and for the six months ended June 30, 2016 and June 30, 2015, and the years ended December 31, 2015, 2014 and 2013. The summary financial data as of and for the six months ended June 30, 2016 and June 30, 2015 has been derived from the unaudited financial statements of Enviva Partners, LP, which are included in our Quarterly Report on Form 10-Q for the quarter ended June 30, 2016. Our Quarterly Report on Form 10-Q for the quarter ended June 30, 2016 is incorporated herein by reference. The summary financial data as of and for the years ended December 31, 2015, 2014 and 2013 has been derived from the audited financial statements of Enviva Partners, LP, which are included in our Annual Report on Form 10-K for the year ended December 31, 2015. Our Annual Report on Form 10-K for the year ended December 31, 2015 is incorporated herein by reference.
The summary financial data for the twelve months ended June 30, 2016 were calculated by subtracting the data for the six months ended June 30, 2015 from the audited financial statements for the year ended December 31, 2015 and then adding the corresponding data for the six months ended June 30, 2016.
We accounted for the Southampton Drop-Down as a combination of entities under common control at historical cost in a manner similar to a pooling of interests. Accordingly, the financial statements for the periods prior to the Southampton Drop-Down were retrospectively recast to reflect the acquisition as if it had occurred on April 9, 2015, the date Southampton was originally conveyed to the Hancock JV. The effect of this recast is to include the financial results and results of operations of Southampton as if the conveyance of Southampton to the Hancock JV had never occurred.
The summary historical financial and operating data should be read together with, and is qualified in its entirety by reference to, our historical financial statements and the accompanying notes and "Management's discussion and analysis of financial condition and results of operations", which are set forth in our Quarterly Report on Form 10-Q for the quarter ended June 30, 2016 and our Annual Report on Form 10-K for the year ended December 31, 2015 and incorporated by reference herein. The summary historical financial and
27
operating data presented in this offering memorandum may not be indicative of future performance.
| |
|
|
|
|
|
|
|||||||||||||
|---|---|---|---|---|---|---|---|---|---|---|---|---|---|---|---|---|---|---|---|
| | | | | | | | | | | | | | | | | | | | |
| |
|
Six months ended June 30, | |
|
|
||||||||||||||
| |
Twelve months ended June 30, 2016 |
Year ended December 31, | |||||||||||||||||
| |
|
2015 (Recast) |
|||||||||||||||||
| |
2016 |
2015 |
2014 |
2013 |
|||||||||||||||
| | | | | | | | | | | | | | | | | | | | |
| |
(Predecessor) (in thousands, except per metric ton) |
||||||||||||||||||
Statement of Operations Data: |
|||||||||||||||||||
Product sales |
$ | 449,896 | $ | 219,692 | $ | 220,776 | $ | 450,980 | $ | 286,641 | $ | 176,051 | |||||||
Other revenue |
10,466 | 7,269 | 3,197 | 6,394 | 3,495 | 3,836 | |||||||||||||
| | | | | | | | | | | | | | | | | | | | |
Net revenue |
460,362 | 226,961 | 223,973 | 457,374 | 290,136 | 179,887 | |||||||||||||
Costs of goods sold, excluding depreciation and amortization |
362,085 | 177,599 | 180,575 | 365,061 | 251,058 | 152,720 | |||||||||||||
Depreciation and amortization |
28,203 | 13,995 | 16,484 | 30,692 | 18,971 | 11,827 | |||||||||||||
| | | | | | | | | | | | | | | | | | | | |
Total cost of goods sold |
390,288 | 191,594 | 197,059 | 395,753 | 270,029 | 164,547 | |||||||||||||
| | | | | | | | | | | | | | | | | | | | |
Gross margin |
70,074 | 35,367 | 26,914 | 61,621 | 20,107 | 15,340 | |||||||||||||
General and administrative expenses |
19,376 | 9,409 | 8,393 | 18,360 | 10,792 | 16,150 | |||||||||||||
Loss on disposal of assets |
2,081 | — | — | 2,081 | 340 | 223 | |||||||||||||
| | | | | | | | | | | | | | | | | | | | |
Income (loss) from operations |
48,617 | 25,958 | 18,521 | 41,180 | 8,975 | (1,033 | ) | ||||||||||||
Other income (expense): |
|||||||||||||||||||
Interest expense |
(12,063 | ) | (6,220 | ) | (4,708 | ) | (10,551 | ) | (8,724 | ) | (5,460 | ) | |||||||
Related party interest expense |
(567 | ) | (510 | ) | (1,097 | ) | (1,154 | ) | — | — | |||||||||
Early retirement of debt obligation |
— | — | (4,699 | ) | (4,699 | ) | (73 | ) | — | ||||||||||
Other income |
1,224 | 271 | 26 | 979 | 22 | 1,019 | |||||||||||||
| | | | | | | | | | | | | | | | | | | | |
Total other expense, net |
(11,406 | ) | (6,459 | ) | (10,478 | ) | (15,425 | ) | (8,775 | ) | (4,441 | ) | |||||||
| | | | | | | | | | | | | | | | | | | | |
Income (loss) before income tax expense |
37,211 | 19,499 | 8,043 | 25,755 | 200 | (5,474 | ) | ||||||||||||
Income tax (benefit) expense |
(44 | ) | — | 2,667 | 2,623 | 15 | 23 | ||||||||||||
| | | | | | | | | | | | | | | | | | | | |
Net income (loss) |
37,255 | 19,499 | 5,376 | 23,132 | 185 | (5,497 | ) | ||||||||||||
| | | | | | | | | | | | | | | | | | | | |
Less net loss attributable to noncontrolling partners' interests |
74 | 48 | 16 | 42 | 79 | 58 | |||||||||||||
| | | | | | | | | | | | | | | | | | | | |
Net income (loss) attributable to Enviva Partners, LP |
$ | 37,329 | $ | 19,547 | $ | 5,392 | $ | 23,174 | $ | 264 | $ | (5,439 | ) | ||||||
| | | | | | | | | | | | | | | | | | | | |
Less: Predecessor loss to May 4, 2015 (prior to IPO) |
$ | — | $ | — | $ | (2,132 | ) | $ | (2,132 | ) | |||||||||
Less: Pre-acquisition income from April 10, 2015 to December 10, 2015 from operations of Enviva Pellets Southampton Drop-Down allocated to General Partner |
4,425 | — | 1,839 | 6,264 | |||||||||||||||
| | | | | | | | | | | | | | | | | | | | |
Enviva Partners, LP partners' interest in net income from May 4, 2015 to December 31, 2015 |
$ | 32,904 | $ | 19,547 | $ | 5,685 | $ | 19,042 | |||||||||||
| | | | | | | | | | | | | | | | | | | | |
Statement of Cash Flow Data: |
|||||||||||||||||||
Net cash provided by (used in): |
|||||||||||||||||||
Operating activities |
$ | 85,922 | $ | 53,641 | $ | 33,937 | $ | 66,218 | $ | 29,434 | $ | (7,557 | ) | ||||||
Investing activities |
(10,321 | ) | (4,586 | ) | (6,014 | ) | (11,749 | ) | (14,664 | ) | (115,799 | ) | |||||||
Financing activities |
(136,186 | ) | (31,424 | ) | 51,876 | (52,886 | ) | (17,736 | ) | 115,235 | |||||||||
28
| | | | | | | | | | | | | | | | | | | | |
| |
|
Six months ended June 30, | |
|
|
||||||||||||||
|---|---|---|---|---|---|---|---|---|---|---|---|---|---|---|---|---|---|---|---|
| |
Twelve months ended June 30, 2016 |
Year ended December 31, | |||||||||||||||||
| |
|
2015 (Recast) |
|||||||||||||||||
| |
2016 |
2015 |
2014 |
2013 |
|||||||||||||||
|
| | | | | | | | | | | | | | | | | | |
| |
(Predecessor) (in thousands, except per metric ton) |
||||||||||||||||||
Other Financial Data: |
|||||||||||||||||||
Adjusted EBITDA(1) |
$ | 83,268 | $ | 41,957 | $ | 35,961 | $ | 77,272 | $ | 28,348 | $ | 12,101 | |||||||
Adjusted gross margin per metric ton(1) |
$ | 40.76 | $ | 41.83 | $ | 37.97 | $ | 38.89 | $ | 25.91 | $ | 29.18 | |||||||
Maintenance capital expenditures(2) |
4,042 | 1,383 | 1,700 | 4,359 | 515 | — | |||||||||||||
Distributable cash flow(1) |
68,219 | 34,736 | 29,331 | 62,814 | 21,130 | 7,650 | |||||||||||||
Operating Data: |
|||||||||||||||||||
Total metric tons sold |
2,411 | 1,180 | 1,143 | 2,374 | 1,508 | 931 | |||||||||||||
Balance Sheet Data (at period end): |
|||||||||||||||||||
Cash and cash equivalents |
$ | 19,806 | $ | 80,391 | $ | 2,175 | $ | 592 | $ | 3,558 | |||||||||
Total assets |
$ | 577,362 | $ | 659,623 | 574,547 | 384,489 | 400,003 | ||||||||||||
Long-term debt and capital lease obligations (including current portion) |
206,739 | 178,565 | 213,198 | 94,075 | 100,524 | ||||||||||||||
Total liabilities |
254,951 | 209,071 | 248,395 | 109,961 | 128,592 | ||||||||||||||
Partners' capital |
322,411 | 450,552 | 326,152 | 274,528 | 271,411 | ||||||||||||||
| | | | | | | | | | | | | | | | | | | | |
(1) For more information, please read the section entitled "Management's discussion and analysis of financial condition and results of operations—Non-GAAP financial measures."
(2) Maintenance capital expenditures are cash expenditures made to maintain our long-term operating capacity or net income.
How we evaluate our operations
Adjusted gross margin per metric ton
We use adjusted gross margin per metric ton to measure our financial performance. We define adjusted gross margin as gross margin excluding depreciation and amortization included in cost of goods sold. We believe adjusted gross margin per metric ton is a meaningful measure because it compares our off-take pricing to our operating costs for a view of profitability and performance on a per metric ton basis. Adjusted gross margin per metric ton will primarily be affected by our ability to meet targeted production volumes and to control direct and indirect costs associated with procurement and delivery of wood fiber to our production plants and the production and distribution of wood pellets.
Adjusted EBITDA
We view adjusted EBITDA as an important indicator of performance. We define adjusted EBITDA as net income or loss excluding depreciation and amortization, interest expense, taxes, early retirement of debt obligations, non-cash unit compensation expense, asset impairments and disposals and certain items of income or loss that we characterize as unrepresentative of our ongoing operations. Adjusted EBITDA is a supplemental measure used by our management and other users of our financial statements, such as investors, commercial banks and research analysts, to assess the financial performance of our assets without regard to financing methods or capital structure.
29
Distributable cash flow
We define distributable cash flow as adjusted EBITDA less maintenance capital expenditures and interest expense net of amortization of debt issuance costs and original issue discount. We use distributable cash flow as a performance metric to compare cash generating performance of the Partnership from period to period and to compare the cash generating performance for specific periods to the cash distributions (if any) that are expected to be paid to our unitholders. We do not rely on distributable cash flow as a liquidity measure.
Non-GAAP financial measures
Adjusted gross margin per metric ton, adjusted EBITDA and distributable cash flow are not financial measures presented in accordance with accounting principles generally accepted in the United States ("GAAP"). We believe that the presentation of these non-GAAP financial measures provides useful information to investors in assessing our financial condition and results of operations. Our non-GAAP financial measures should not be considered as alternatives to the most directly comparable GAAP financial measures. Each of these non-GAAP financial measures has important limitations as an analytical tool because they exclude some, but not all, items that affect the most directly comparable GAAP financial measures. You should not consider adjusted gross margin per metric ton, adjusted EBITDA or distributable cash flow in isolation or as substitutes for analysis of our results as reported under GAAP. Our definitions of these non-GAAP financial measures may not be comparable to similarly titled measures of other companies, thereby diminishing their utility.
This offering memorandum includes our management's estimates of incremental adjusted EBITDA generated by each of the Sampson plant and the Wilmington terminal, which are based on numerous assumptions that are inherently uncertain and subject to significant business, economic, financial, regulatory, and competitive risks and uncertainties that could cause actual results and amounts to differ materially from those estimates. A reconciliation of estimated incremental adjusted EBITDA to GAAP net income is not provided because forward-looking GAAP net income generated by each of the Sampson plant and Wilmington terminal is not accessible and reconciling information is not available without unreasonable effort. The amount of interest expense with respect to each of the Sampson plant and Wilmington terminal is not accessible or estimable at this time. The amount of actual interest expense, as the case may be, incurred could be significant, such that the actual amount of net income generated the Sampson plant or Wilmington terminal could vary substantially from the respective amounts of estimated incremental adjusted EBITDA.
30
The following table presents a reconciliation of adjusted gross margin per metric ton to the most directly comparable GAAP financial measure for each of the periods indicated.
| |
|
|
|
|
|
|
|||||||||||||
|---|---|---|---|---|---|---|---|---|---|---|---|---|---|---|---|---|---|---|---|
| | | | | | | | | | | | | | | | | | | | |
| |
|
Six months ended June 30, | |
|
|
||||||||||||||
| |
Twelve months ended June 30, 2016 |
Year ended December 31, | |||||||||||||||||
| |
|
2015 (Recast) |
|||||||||||||||||
| |
2016 |
2015 |
2014 |
2013 |
|||||||||||||||
| | | | | | | | | | | | | | | | | | | | |
| |
(Predecessor) (in thousands, except per metric ton) |
||||||||||||||||||
Reconciliation of adjusted gross margin per metric ton to gross margin: |
|||||||||||||||||||
Metric tons sold |
2,411 | 1,180 | 1,143 | 2,374 | 1,508 | 931 | |||||||||||||
Gross margin |
$ | 70,074 | $ | 35,367 | $ | 26,914 | $ | 61,621 | $ | 20,107 | $ | 15,340 | |||||||
Depreciation and amortization |
28,203 | 13,995 | 16,484 | 30,692 | 18,971 | 11,827 | |||||||||||||
| | | | | | | | | | | | | | | | | | | | |
Adjusted gross margin |
$ | 98,277 | $ | 49,362 | $ | 43,398 | $ | 92,313 | $ | 39,078 | $ | 27,167 | |||||||
| | | | | | | | | | | | | | | | | | | | |
Adjusted gross margin per metric ton |
$ | 40.76 | $ | 41.83 | $ | 37.97 | $ | 38.89 | $ | 25.91 | $ | 29.18 | |||||||
| | | | | | | | | | | | | | | | | | | | |
The following table presents a reconciliation of each of adjusted EBITDA and distributable cash flow to the most directly comparable GAAP financial measure for each of the periods indicated.
| |
|
|
|
|
|
|
|||||||||||||
|---|---|---|---|---|---|---|---|---|---|---|---|---|---|---|---|---|---|---|---|
| | | | | | | | | | | | | | | | | | | | |
| |
|
Six months ended June 30, | |
|
|
||||||||||||||
| |
Twelve months ended June 30, 2016 |
Year ended December 31, | |||||||||||||||||
| |
|
2015 (Recast) |
|||||||||||||||||
| |
2016 |
2015 |
2014 |
2013 |
|||||||||||||||
| | | | | | | | | | | | | | | | | | | | |
| |
(Predecessor) (in thousands) |
||||||||||||||||||
Reconciliation of adjusted EBITDA and distributable cash flow to net income (loss): |
|||||||||||||||||||
Net income (loss) |
$ | 37,255 | $ | 19,499 | $ | 5,376 | $ | 23,132 | $ | 185 | $ | (5,497 | ) | ||||||
Add: |
|||||||||||||||||||
Depreciation and amortization |
28,244 | 14,013 | 16,507 | 30,738 | 19,009 | 11,887 | |||||||||||||
Interest expense |
12,630 | 6,730 | 5,805 | 11,705 | 8,724 | 5,460 | |||||||||||||
Early retirement of debt obligation |
— | — | 4,699 | 4,699 | 73 | — | |||||||||||||
Purchase accounting adjustment to inventory |
— | — | 697 | 697 | — | — | |||||||||||||
Non-cash unit compensation expense |
2,021 | 1,500 | 183 | 704 | 2 | 5 | |||||||||||||
Income tax expense |
(44 | ) | — | 2,667 | 2,623 | 15 | 23 | ||||||||||||
Asset impairments and disposals |
2,210 | 156 | 27 | 2,081 | 340 | 223 | |||||||||||||
Acquisition transaction expenses |
952 | 59 | — | 893 | — | — | |||||||||||||
| | | | | | | | | | | | | | | | | | | | |
Adjusted EBITDA |
$ | 83,268 | $ | 41,957 | $ | 35,961 | $ | 77,272 | $ | 28,348 | $ | 12,101 | |||||||
| | | | | | | | | | | | | | | | | | | | |
Less: |
|||||||||||||||||||
Interest expense net of amortization of debt issuance costs and original issue discount |
11,007 | 5,838 | 4,930 | 10,099 | 6,703 | 4,451 | |||||||||||||
Maintenance capital expenditures |
4,042 | 1,383 | 1,700 | 4,359 | 515 | — | |||||||||||||
| | | | | | | | | | | | | | | | | | | | |
Distributable cash flow attributable to Enviva Partners, LP |
$ | 68,219 | $ | 34,736 | $ | 29,331 | $ | 62,814 | $ | 21,130 | $ | 7,650 | |||||||
| | | | | | | | | | | | | | | | | | | | |
Less: Distributable cash flow attributable to incentive distribution rights |
413 | 413 | — | — | |||||||||||||||
| | | | | | | | | | | | | | | | | | | | |
Distributable cash flow attributable to Enviva Partners, LP limited partners |
$ | 67,806 | $ | 34,323 | $ | 29,331 | $ | 62,814 | |||||||||||
| | | | | | | | | | | | | | | | | | | | |
31
FY 2016 Outlook and Guidance
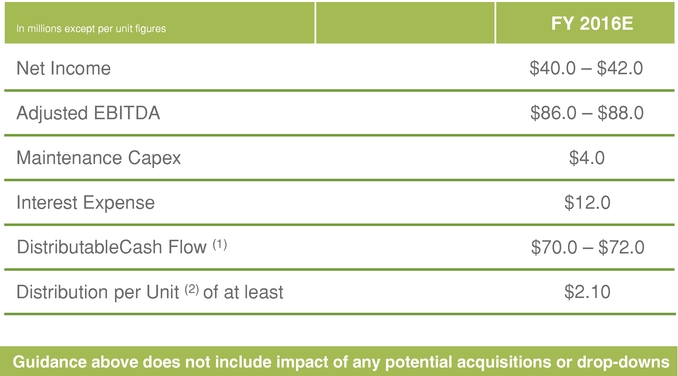
Note: Provided above guidance on August 4, 2016; see slide 47 for Adjusted EBITDA and Distributable Cash Flow reconciliations
- (1)
- Prior to any distributions paid to our general partner
- (2)
- Common and subordinated unit
|
|
|
|
| These materials are not to be downloaded or distributed. These materials are only available to QIBs and non-U.S. persons. |
Non-GAAP Financial Measures Reconciliation (Cont.)
The following table provides a reconciliation of the estimated range of distributable cash flow and adjusted EBITDA to the estimated range of net income, in each case for the twelve months ending December 31, 2016 (in millions except per unit figures). Guidance provided August 4, 2016:
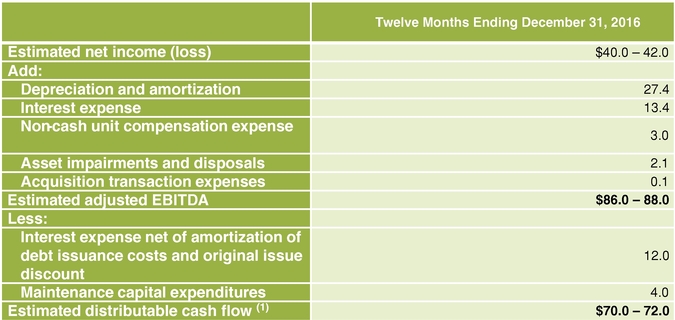
- (1)
- Prior to any distributions paid to our general partner
|
|
|
|
| These materials are not to be downloaded or distributed. These materials are only available to QIBs and non-U.S. persons. |
Summary
Enviva Partners, LP
The offering
Summary historical financial and operating data