Attached files
| file | filename |
|---|---|
| 8-K - CALGON CARBON CORP. 8-K - CALGON CARBON Corp | a51295467.htm |
Exhibit 99.1
Wedbush Sustainability & Infrastructure Conference March 9, 2016

Safe Harbor Statement Today’s presentation contains historical information and forward-looking statements. Forward-looking statements typically contain words such as “expect,” “believe,” “estimate,” “anticipate,” or similar words indicating that future outcomes are uncertain. Statements looking forward in time, including statements regarding future growth and profitability, price increases, cost savings, product lines, enhanced competitive posture and acquisitions, are included in the company’s most recent Annual Report pursuant to the “safe harbor” provision of the Private Securities Litigation Reform Act of 1995. They involve known and unknown risks and uncertainties that may cause the company’s actual results in future periods to be materially different from any future performance suggested herein. Further, the company operates in an industry sector where securities values may be volatile and may be influenced by economic and other factors beyond the company’s control. Some of the factors that could affect future performance of the company are changes in, or delays in the implementation of, regulations that cause a market for our products, acquisitions, higher energy and raw material costs, costs of imports and related tariffs, labor relations, capital and environmental requirements, changes in foreign currency exchange rates, borrowing restrictions, validity of patents and other intellectual property, and pension costs. In the context of the forward-looking information provided in this presentation, please refer to the discussions of risk factors and other information detailed in, as well as the other information contained in the company’s most recent Annual Report.
Agenda Calgon Carbon’s Products and ServicesFinancial OverviewDrivers of Sales GrowthMercury RemovalNorth American Drinking WaterReactivationBallast Water TreatmentDrivers of Value CreationCost Improvement ProgramInvesting in Existing PlantsRevenue Growth Focus M&ACapital Allocation Program

Company Profile
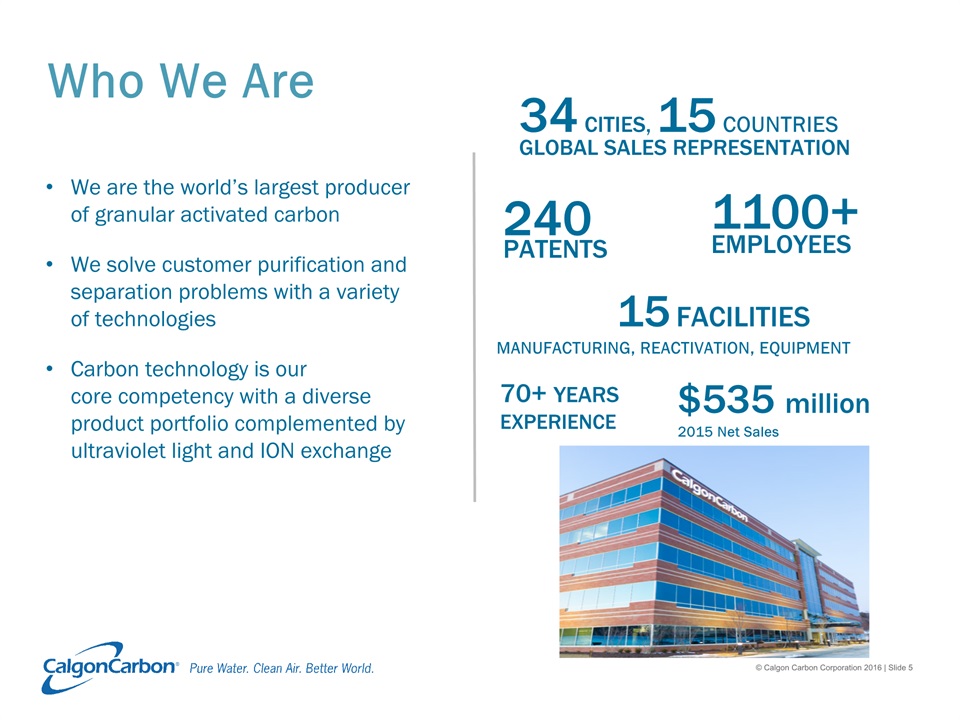
Who We Are We are the world’s largest producer of granular activated carbon We solve customer purification and separation problems with a variety of technologiesCarbon technology is our core competency with a diverse product portfolio complemented by ultraviolet light and ION exchange 15 FACILITIESMANUFACTURING, REACTIVATION, EQUIPMENT 70+ YEARS EXPERIENCE 1100+ EMPLOYEES 240 PATENTS 34 CITIES, 15 COUNTRIESGLOBAL SALES REPRESENTATION $535 million2015 Net Sales

What We Do Develop, manufacture and supply activated carbon, other media and treatment systems to: Reduce environmental impact and allow waste water reuse or disposal Remove and recover contaminants from air emissions Purify food products Protect your personal environment Provide clean, safe drinking water Enhance critical stages in chemical manufacture
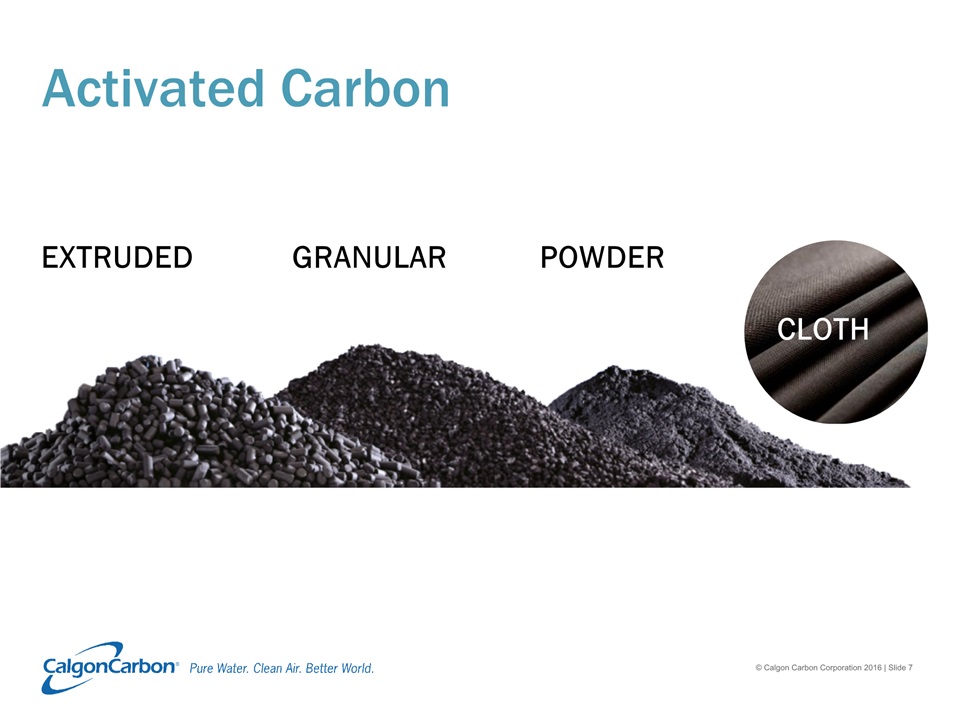
GRANULAR EXTRUDED POWDER Activated Carbon CLOTH
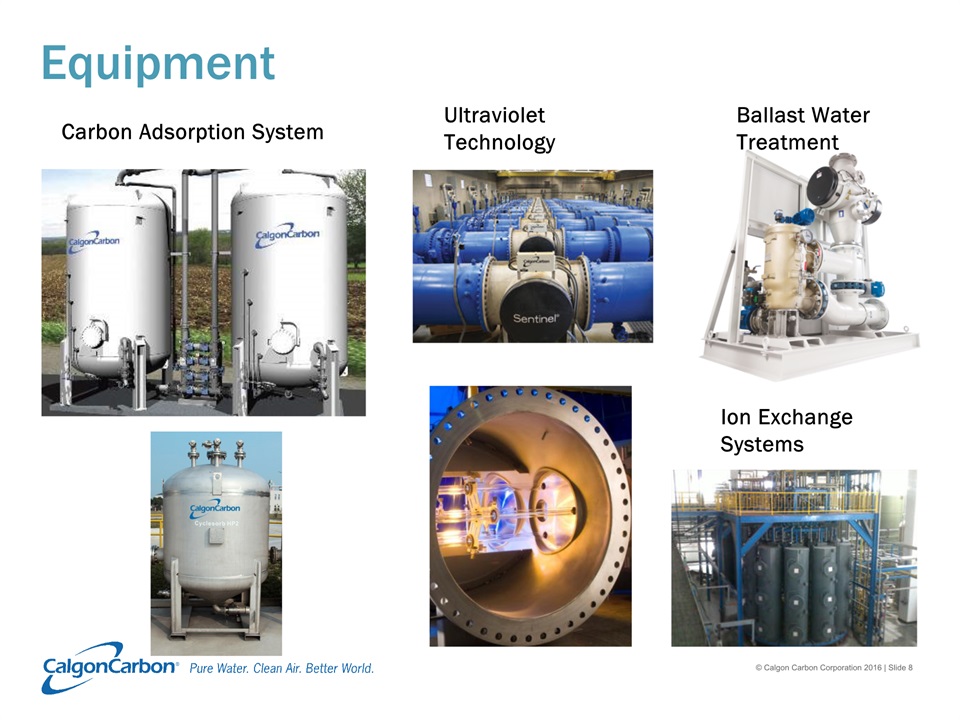
Equipment Carbon Adsorption System Ultraviolet Technology Ion Exchange Systems Ballast Water Treatment

Columbus, OH North Tonawanda, NY Pittsburgh, PA (HQ) Catlettsburg, KY Pearlington, MS Neville Island, PA Gila Bend, AZ Columbus, OH Blue Lake, CA Mexico City, Mexico São Paulo, Brazil Houghton-le-Spring, UK Ashton-in-Makerfield, UK Tipton, UK Grays, UK (HQ) Feluy, Belgium Suzhou, Jiangsu Province, China Fukui, Fukui Prefecture, Japan Singapore (HQ) Global Presence Finldlay Twp. PA US Sales Representation:San Francisco, CAChicago, ILBaton Rouge, LALake Charles, LALouisville, KYNew York, NYPortland, ORCleveland, OHHarrisburg, PAPhiladelphia, PAPittsburgh, PAHouston, TXCharlottesville, VASeattle, WAAppleton, WI Global Sales Representation Manufacturing Locations Regional Offices / HQ
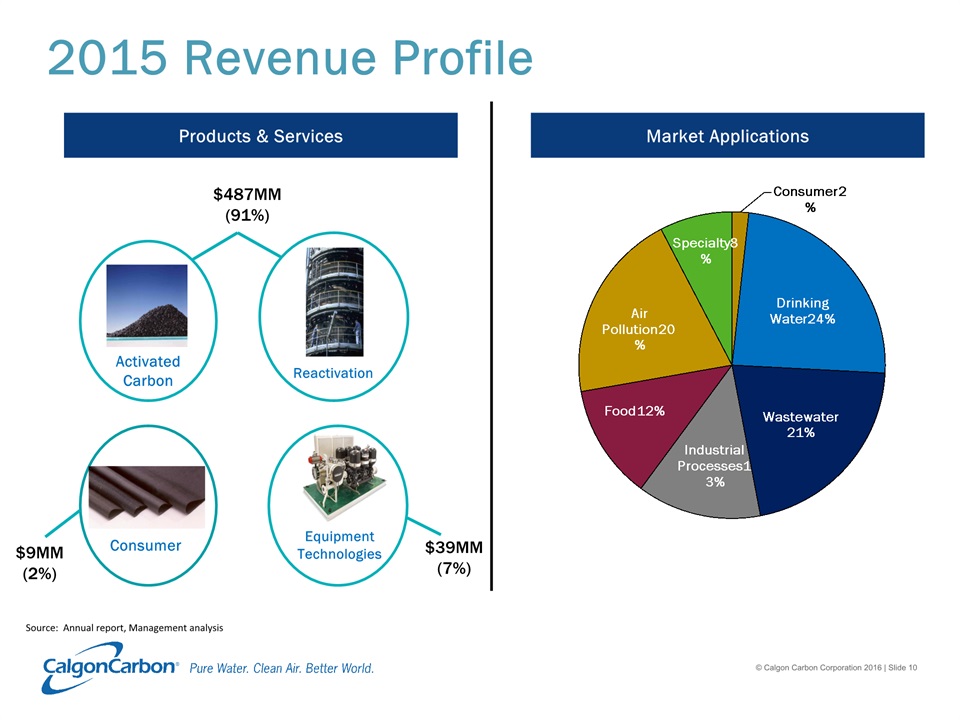
Activated Carbon Reactivation Equipment Technologies Consumer $487MM(91%) $39MM(7%) $9MM(2%) Market Applications Products & Services 2015 Revenue Profile Source: Annual report, Management analysis
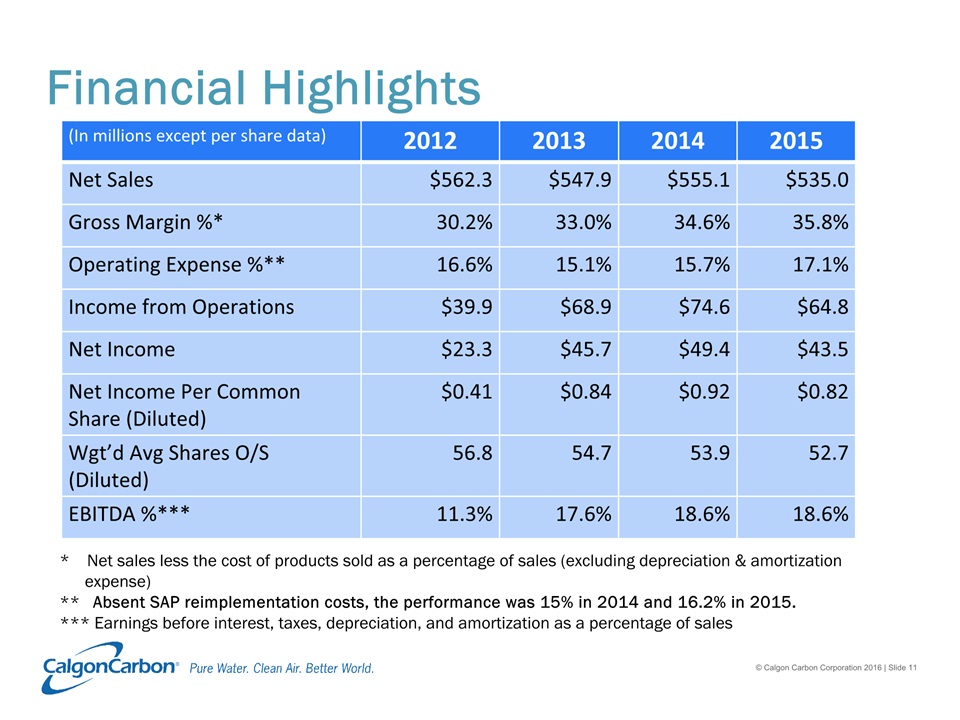
Financial Highlights (In millions except per share data) 2012 2013 2014 2015 Net Sales $562.3 $547.9 $555.1 $535.0 Gross Margin %* 30.2% 33.0% 34.6% 35.8% Operating Expense %** 16.6% 15.1% 15.7% 17.1% Income from Operations $39.9 $68.9 $74.6 $64.8 Net Income $23.3 $45.7 $49.4 $43.5 Net Income Per Common Share (Diluted) $0.41 $0.84 $0.92 $0.82 Wgt’d Avg Shares O/S (Diluted) 56.8 54.7 53.9 52.7 EBITDA %*** 11.3% 17.6% 18.6% 18.6% * Net sales less the cost of products sold as a percentage of sales (excluding depreciation & amortization expense)** Absent SAP reimplementation costs, the performance was 15% in 2014 and 16.2% in 2015.*** Earnings before interest, taxes, depreciation, and amortization as a percentage of sales

Drivers of Sales GrowthMercury RemovalNorth American Drinking WaterReactivationBallast Water Treatment
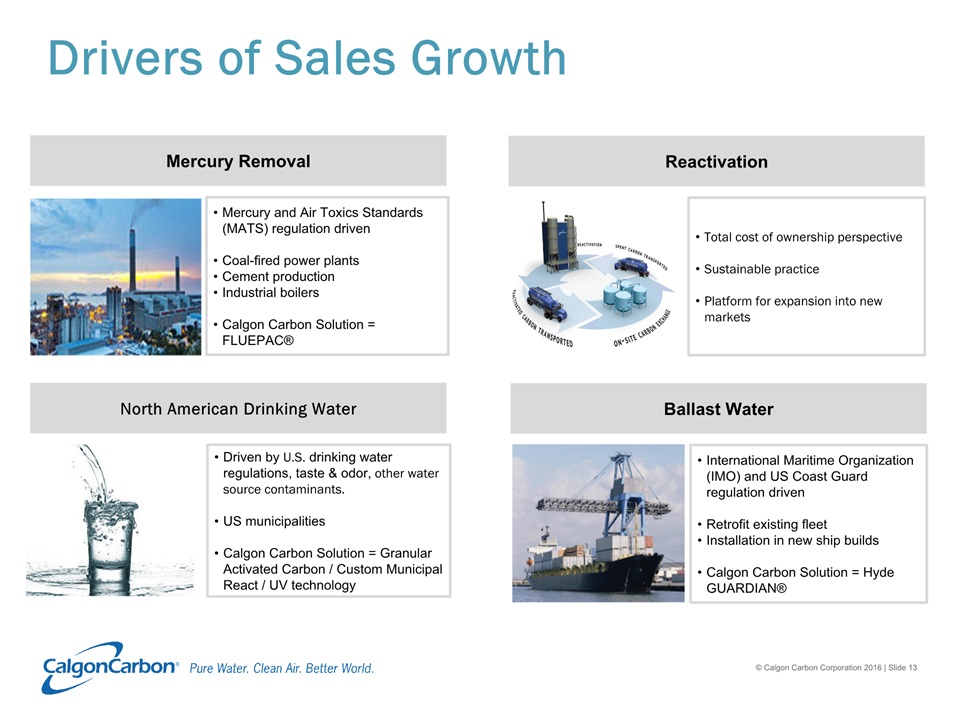
Drivers of Sales Growth Mercury Removal North American Drinking Water Ballast Water Mercury and Air Toxics Standards (MATS) regulation driven Coal-fired power plantsCement productionIndustrial boilersCalgon Carbon Solution = FLUEPAC® Driven by U.S. drinking water regulations, taste & odor, other water source contaminants.US municipalitiesCalgon Carbon Solution = Granular Activated Carbon / Custom Municipal React / UV technology International Maritime Organization (IMO) and US Coast Guard regulation drivenRetrofit existing fleetInstallation in new ship builds Calgon Carbon Solution = Hyde GUARDIAN® Reactivation Total cost of ownership perspectiveSustainable practicePlatform for expansion into new markets
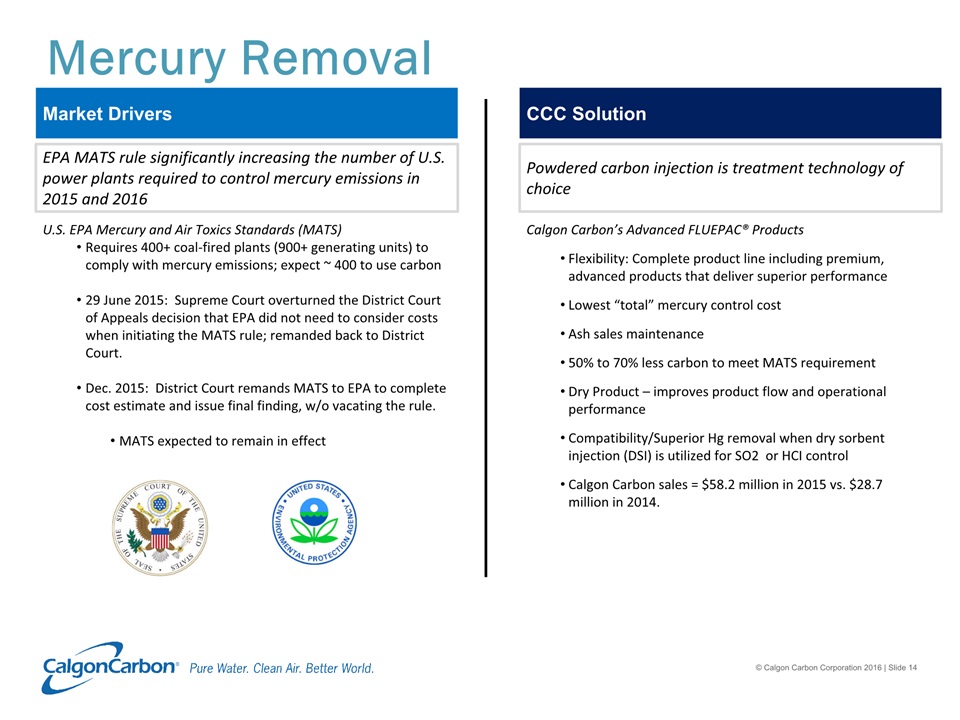
Mercury Removal EPA MATS rule significantly increasing the number of U.S. power plants required to control mercury emissions in 2015 and 2016 U.S. EPA Mercury and Air Toxics Standards (MATS) Requires 400+ coal-fired plants (900+ generating units) to comply with mercury emissions; expect ~ 400 to use carbon29 June 2015: Supreme Court overturned the District Court of Appeals decision that EPA did not need to consider costs when initiating the MATS rule; remanded back to District Court.Dec. 2015: District Court remands MATS to EPA to complete cost estimate and issue final finding, w/o vacating the rule. MATS expected to remain in effect Powdered carbon injection is treatment technology of choice Calgon Carbon’s Advanced FLUEPAC® Products Flexibility: Complete product line including premium, advanced products that deliver superior performanceLowest “total” mercury control costAsh sales maintenance50% to 70% less carbon to meet MATS requirementDry Product – improves product flow and operational performanceCompatibility/Superior Hg removal when dry sorbent injection (DSI) is utilized for SO2 or HCI controlCalgon Carbon sales = $58.2 million in 2015 vs. $28.7 million in 2014. Market Drivers CCC Solution

Mercury Market Segmentation1 Annual market size based on Standard (Gen 1) product demandTotal annual market value is estimated at ~ $245 - $270MM by 20171CCC expects to ultimately secure at least 30% share of the market value2015 revenue: $58.2M; 2014 revenue $28.7M Note 1 – Assumes EPA issues final finding on MATS, and MATS remains in effect. April 2016MATS Compliance+(100-140) MM Std. Pounds(Total: 290-400 MM Std. Pounds)* April 2015MATS Compliance+(70-100) MM Std. Pounds(Total: 190-260 MM Std. Pounds)

North American Drinking Water Issues Regulatory Situation Granular AC Opportunity Taste & odor control.Water supplied from vulnerable surface water sources.Disinfection byproducts (DPB) formed by chlorine reacting with natural organic matter in the water.Drought conditions leading to sourcing water from contaminated groundwater sources. U.S. EPA Safe Drinking Water Act reg’s limit DBPs in drinking water (Stage 1 – 1998, Stage 2 – 2005).Majority in compliance by July 2015Drinking Water Protection Act (Aug 2015). EPA to develop plan to assess and manage risks of algal toxins in public water systems.Many contaminants to be reviewed. Only ~10% of water systems have installed GAC Multiple benefits: a barrier defense for drinking water against DBPs, taste & odor, chemical spills, algal blooms and other contaminants .Many municipalities currently treat DBPs with chloramines – possibly subject to future EPA regulation. US / Canada Market Potential Installed GAC – M lbs Current Status Market Potential Stage 3 DBP - - Potential GAC Opportunity Source: Management analysis *** Note: Reflects current market drivers ~4.5% CAGR

Reactivation Lower costs than using virgin carbonCertified destruction of the adsorbed materials (which may be classified as hazardous)No landfill liabilitiesLower cost than incinerationSustainability benefitsGenerates only 20% of the CO2 vs. the production of virgin carbonAssured supply of carbonExpert Field Service support and logistics Benefits Reactivation Sites Fukui, Japan Food, Industrial Suzhou, China Industrial, municipal (conversion of muni kiln to industrial in process) Tipton, UK Municipal Feluy, Belgium Municipal, Industrial North Tonawanda, NY Municipal Pittsburgh, PA Industrial RCRA Columbus, OH Municipal, Industrial Catlettsburg, KY Industrial RCRA Gila Bend, AZ Municipal Blue Lake, CA (idle) Municipal Approximately 158 municipal water systems use Custom Municipal Reactivation (CMR) in North America; 22 water systems added in 2015 Grays, UK Municipal
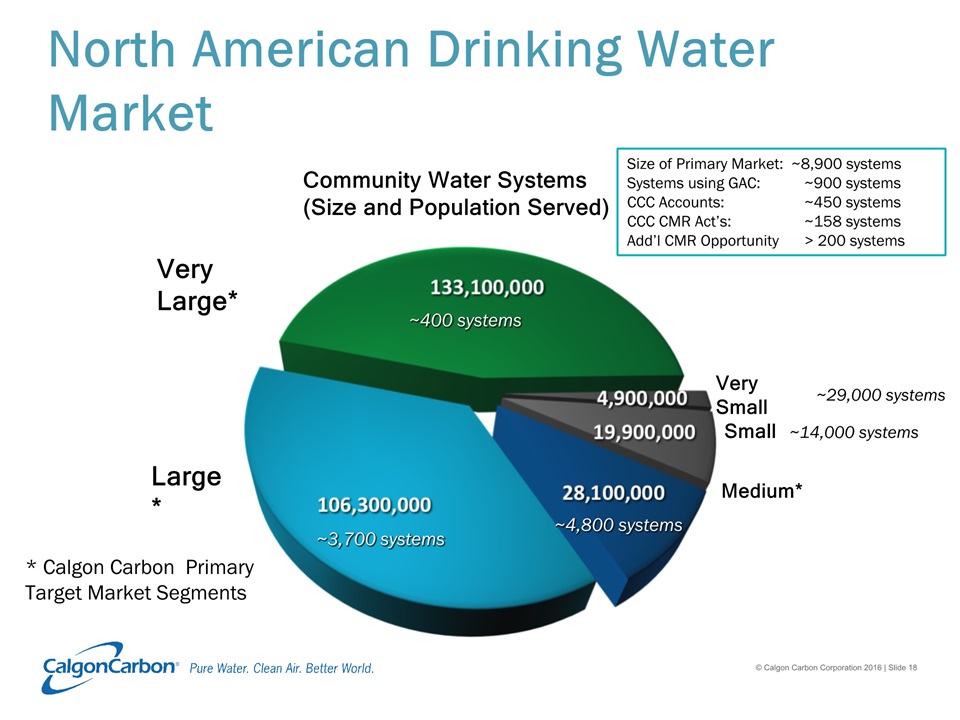
North American Drinking Water Market Community Water Systems (Size and Population Served) Large* Very Large* Small Medium* Very Small ~400 systems ~3,700 systems ~4,800 systems ~29,000 systems ~14,000 systems * Calgon Carbon Primary Target Market Segments Size of Primary Market: ~8,900 systemsSystems using GAC: ~900 systemsCCC Accounts: ~450 systemsCCC CMR Act’s: ~158 systemsAdd’l CMR Opportunity > 200 systems
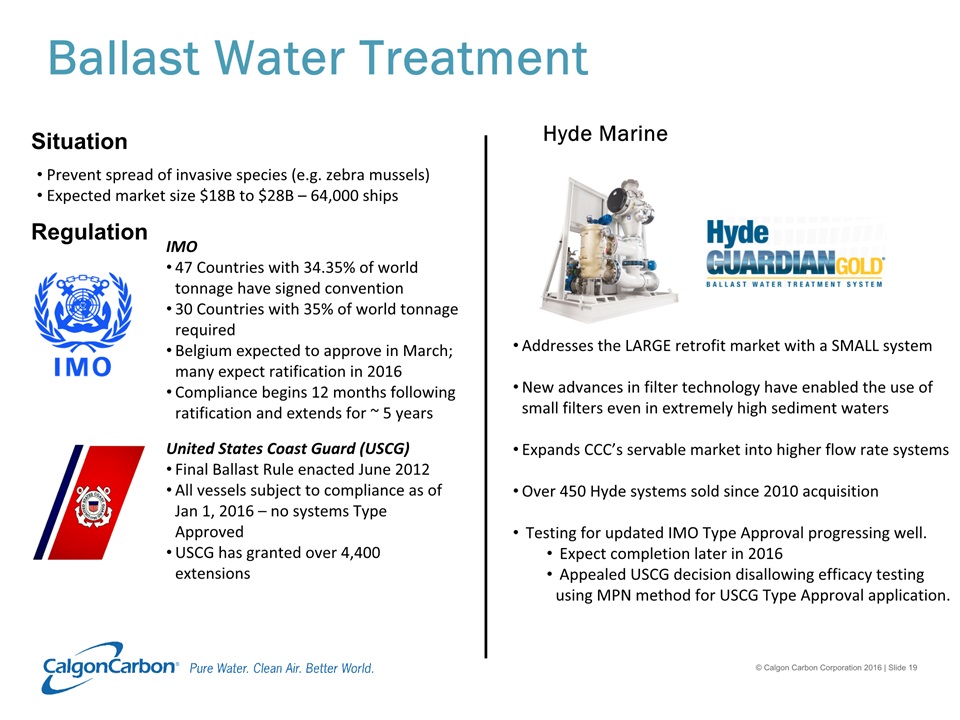
Ballast Water Treatment Prevent spread of invasive species (e.g. zebra mussels) Expected market size $18B to $28B – 64,000 ships Regulation IMO47 Countries with 34.35% of world tonnage have signed convention30 Countries with 35% of world tonnage requiredBelgium expected to approve in March; many expect ratification in 2016Compliance begins 12 months following ratification and extends for ~ 5 years United States Coast Guard (USCG)Final Ballast Rule enacted June 2012All vessels subject to compliance as of Jan 1, 2016 – no systems Type ApprovedUSCG has granted over 4,400 extensions Situation Hyde Marine Addresses the LARGE retrofit market with a SMALL systemNew advances in filter technology have enabled the use of small filters even in extremely high sediment watersExpands CCC’s servable market into higher flow rate systemsOver 450 Hyde systems sold since 2010 acquisition Testing for updated IMO Type Approval progressing well. Expect completion later in 2016 Appealed USCG decision disallowing efficacy testing using MPN method for USCG Type Approval application.

Value Creation Drivers
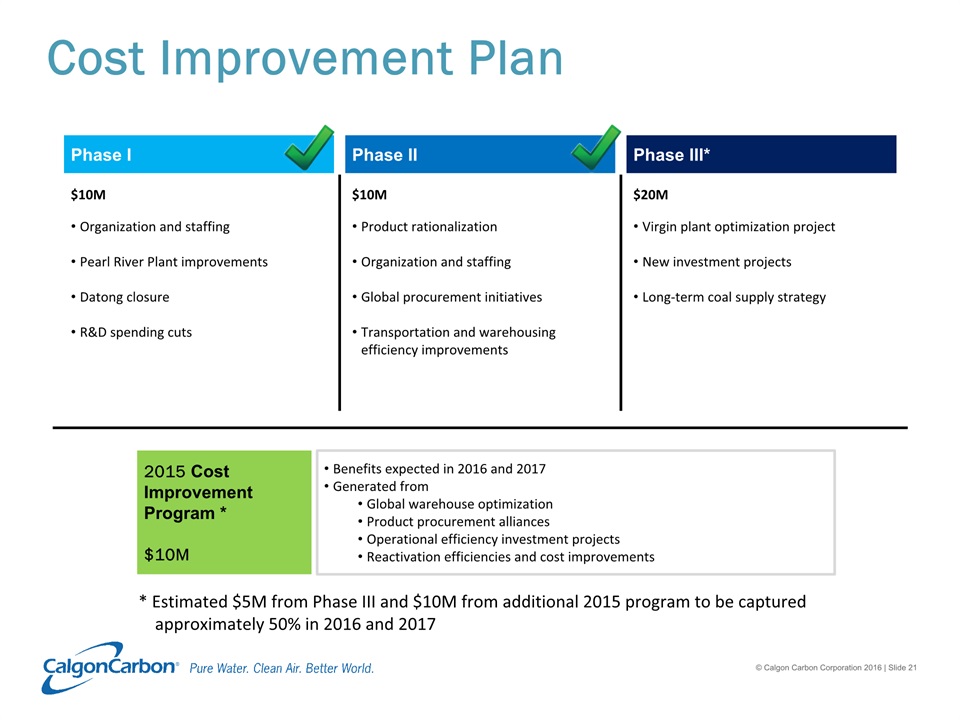
Cost Improvement Plan Phase I Phase II Phase III* Organization and staffingPearl River Plant improvementsDatong closureR&D spending cuts Product rationalizationOrganization and staffingGlobal procurement initiativesTransportation and warehousing efficiency improvements Virgin plant optimization projectNew investment projectsLong-term coal supply strategy $10M $10M $20M 2015 Cost Improvement Program *$10M Benefits expected in 2016 and 2017Generated fromGlobal warehouse optimizationProduct procurement alliancesOperational efficiency investment projectsReactivation efficiencies and cost improvements * Estimated $5M from Phase III and $10M from additional 2015 program to be captured approximately 50% in 2016 and 2017
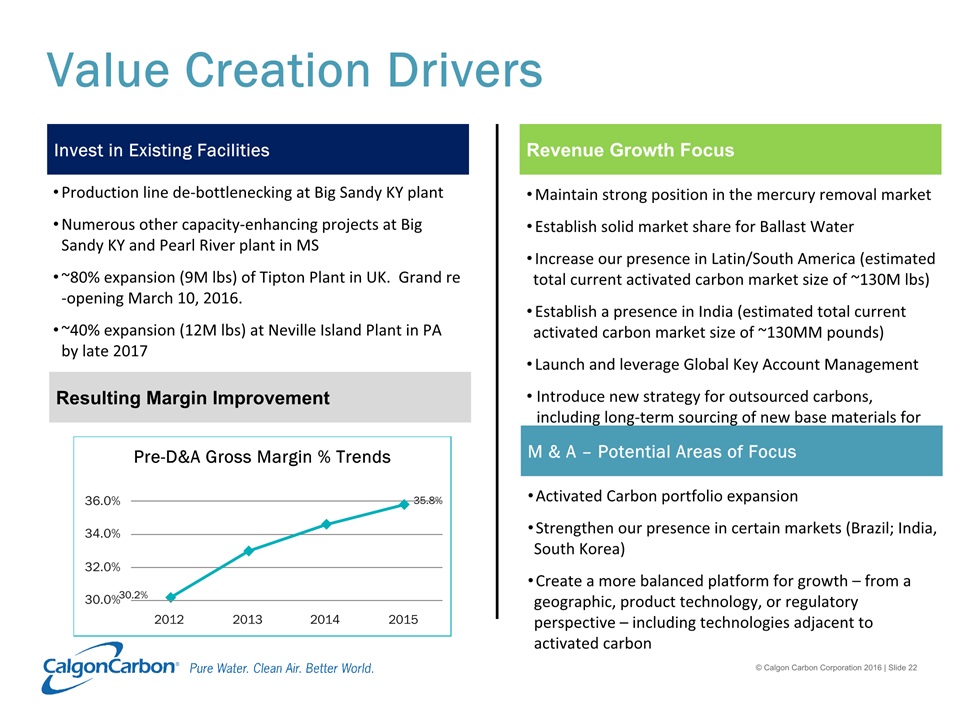
Value Creation Drivers Revenue Growth Focus Invest in Existing Facilities Production line de-bottlenecking at Big Sandy KY plantNumerous other capacity-enhancing projects at Big Sandy KY and Pearl River plant in MS~80% expansion (9M lbs) of Tipton Plant in UK. Grand re-opening March 10, 2016.~40% expansion (12M lbs) at Neville Island Plant in PA by late 2017 Resulting Margin Improvement Maintain strong position in the mercury removal marketEstablish solid market share for Ballast WaterIncrease our presence in Latin/South America (estimated total current activated carbon market size of ~130M lbs)Establish a presence in India (estimated total current activated carbon market size of ~130MM pounds)Launch and leverage Global Key Account ManagementIntroduce new strategy for outsourced carbons, including long-term sourcing of new base materials for new markets M & A – Potential Areas of Focus Activated Carbon portfolio expansionStrengthen our presence in certain markets (Brazil; India, South Korea)Create a more balanced platform for growth – from a geographic, product technology, or regulatory perspective – including technologies adjacent to activated carbon 30.2% 35.8%
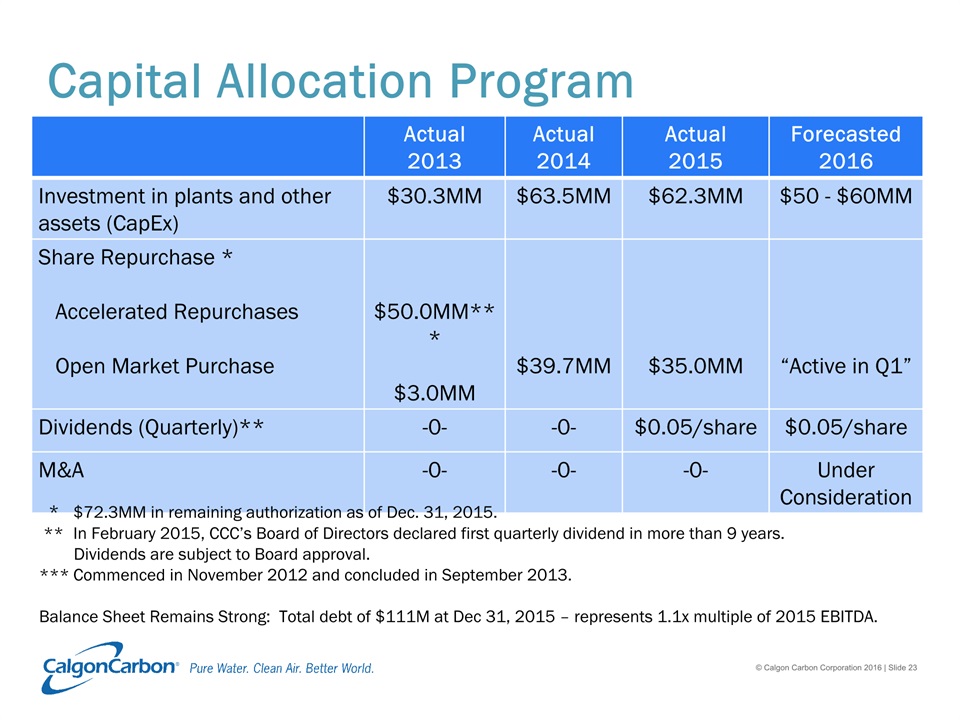
Capital Allocation Program Actual2013 Actual2014 Actual2015 Forecasted2016 Investment in plants and other assets (CapEx) $30.3MM $63.5MM $62.3MM $50 - $60MM Share Repurchase * Accelerated Repurchases Open Market Purchase $50.0MM***$3.0MM $39.7MM $35.0MM “Active in Q1” Dividends (Quarterly)** -0- -0- $0.05/share $0.05/share M&A -0- -0- -0- Under Consideration * $72.3MM in remaining authorization as of Dec. 31, 2015. ** In February 2015, CCC’s Board of Directors declared first quarterly dividend in more than 9 years. Dividends are subject to Board approval.*** Commenced in November 2012 and concluded in September 2013.Balance Sheet Remains Strong: Total debt of $111M at Dec 31, 2015 – represents 1.1x multiple of 2015 EBITDA.
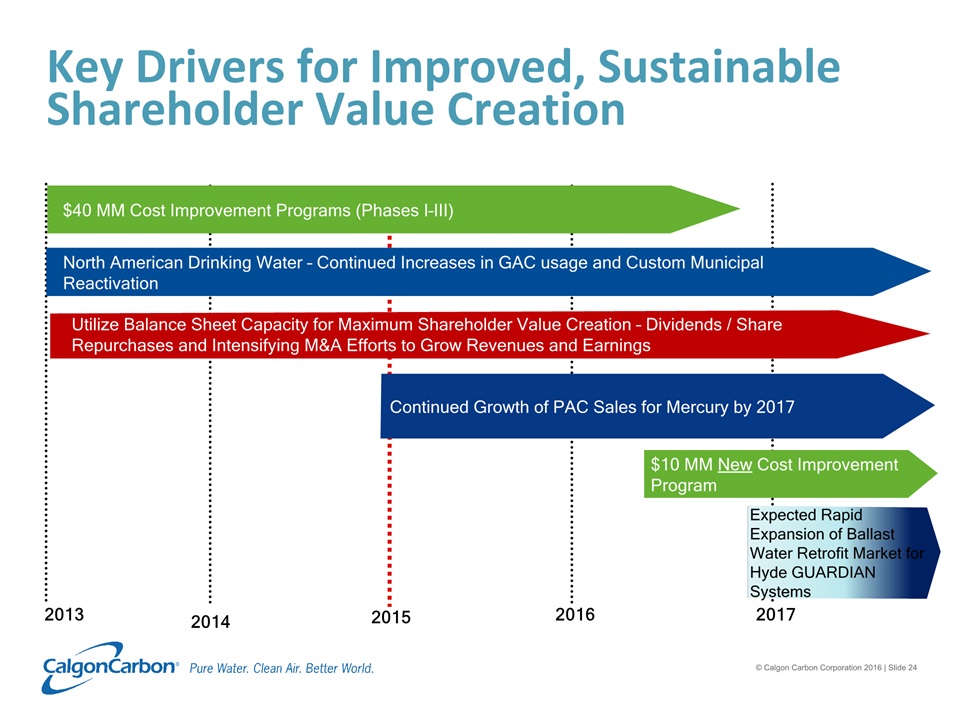
Key Drivers for Improved, Sustainable Shareholder Value Creation 2013 2014 2015 2016 2017 Expected Rapid Expansion of Ballast Water Retrofit Market for Hyde GUARDIAN Systems Utilize Balance Sheet Capacity for Maximum Shareholder Value Creation – Dividends / Share Repurchases and Intensifying M&A Efforts to Grow Revenues and Earnings $40 MM Cost Improvement Programs (Phases I–III) North American Drinking Water – Continued Increases in GAC usage and Custom Municipal Reactivation $10 MM New Cost Improvement Program Continued Growth of PAC Sales for Mercury by 2017
Thank You