Attached files
| file | filename |
|---|---|
| 8-K - 8-K - ESTERLINE TECHNOLOGIES CORP | d92436d8k.htm |
| EX-99.1 - EX-99.1 - ESTERLINE TECHNOLOGIES CORP | d92436dex991.htm |
 Q4
2015 Supplemental Financial Information November 19, 2015
Exhibit 99.2 |
 1 This presentation may contain "forward-looking statements" within the meaning of the Private Securities Litigation Reform Act of 1995. These statements relate to future events or our future
financial performance. In some cases, you can identify forward-looking statements
by terminology such as “anticipate,” “believe,”
“continue,” “could,” “estimate,” “expect,” “intend,” “may,” “might,” “plan,” “potential,” “predict,” “should” or “will,” or the negative of such terms, or other
comparable terminology. These forward-looking statements are
only predictions based on the current intent and expectations of the
management of Esterline, are not guarantees of future performance or
actions, and involve risks and uncertainties that are difficult to predict and may
cause Esterline’s or its industry’s actual results,
performance or achievements to be materially different from any future
results, performance or achievements expressed or implied by the forward-looking statements. Esterline's actual results and the timing and outcome of events may differ materially
from those expressed in or implied by the forward-looking statements due to risks
detailed in Esterline's public filings with the Securities and Exchange
Commission including its most recent Annual Report on Form
10-K. This presentation may also contain references to non-GAAP financial information subject to Regulation G. The reconciliations of each non-GAAP financial measure to its comparable GAAP measure as
well as further information on management’s use of non-GAAP financial
measures are included in Esterline’s press release dated November
19, 2015, included as Exhibit 99.1 to Form 8-K filed with the SEC on
the same date, as well as in this presentation. Q4
2015 Supplemental Financial Information |
 Q4
2015 Supplemental Financial Information Operational
Highlights •
Held eight Continuous Improvement Academies
– Over 220 leaders trained in 2015 • First facility-wide E3 transformation completed – ECCS (Korry) Everett site • Strategic sourcing initiative: – Wave 2 implementation stage – Wave 3 identification of addressable spend and savings 2 |
 Q4
2015 Supplemental Financial Information Current Market
Conditions Commercial Aerospace
•
Solid fundamentals: Strong OE backlog, New airframe entry-into-service
in 2016+, Good airline profitability
•
Near term challenges from flat production on key programs, some new airframe
delays and customer inventory rationalization
Defense • No significant uptick except for production increases in F-35 and A400M Industrial • Challenging global market conditions, including low oil prices and weak European economy • Bright spots in niche markets such as high-end medical, human-machine interface and UK nuclear 3 |
 Q4
2015 Supplemental Financial Information Q4 2015 Financial
Results* •
Sales of $350 million, up 12%
– Organic sales flat – Additional week in Q4-15 (9-week
vs 8-week stub period) – $20 million from DAT acquisition offset by $21 million FX impact • GAAP EPS of $0.69 – Adjusted EPS of $1.33** (excludes certain discrete items)
4 **See Page 1 regarding non-GAAP financial measures * Q4 2015 was a two month fiscal quarter ended October 2, 2015. Comparison is versus the two months ended September 26, 2014. |
 Q4
2015 Supplemental Financial Information FY 2015 Financial
Results* •
Sales of $1.77 billion, down 1.5%
– Organic sales flat – $88 million from acquisition (primarily DAT) offset by $103 million FX impact • GAAP EPS of $3.10 – Adjusted EPS of $4.67** (excludes certain discrete items)
•
FY free cash flow** conversion 159% of net earnings
5 **See Page 1 regarding non-GAAP financial measures * FY 2015 was an eleven month fiscal year ended October 2, 2015. Comparison is versus the eleven months ended September 26, 2014. |
 Q4
2015 Supplemental Financial Information 2015* Year-over-Year (YOY)
Summary 6
Dollars in millions, except EPS
Q4 2015 Q4 2014 Change FY 2015 FY 2014 Change Sales $ 350 $ 313 $ 37 $ 1,774 $ 1,801 ($27) Gross Margin $ 114 $ 102 $ 12 $ 589 $ 625 ($36) As a % of sales 32.7% 32.6% 0.1% 33.2% 34.7% (1.5%) Earnings from continuing operations $ 21 $ 20 $ 1 $ 97 $ 134 ($37) Earnings per diluted share (continuing ops) $0.69 $0.63 $ 0.06 $ 3.10 $ 4.12 ($1.02) * Q4 2015 was a two month fiscal quarter ended October 2, 2015. Fiscal 2015 was an eleven month year ended
October 2, 2015. Comparisons to 2014 are for the two months and eleven months
ended September 26, 2014. |
 Q4
2015 Supplemental Financial Information 2015* Earnings
Adjustment 7
Dollars in millions, except EPS
EPS adjustments are net of tax
Q4 Earnings from Continuing Ops EPS FY Earnings from Continuing Ops EPS GAAP $ 21 $ 0.69 $ 97 $3.10 • Accelerated integration 2 0.05 10 0.31 • Incremental compliance 3 0.12 15 0.49 • DAT net loss and closing expenses 5 0.16 18 0.58 • Bond redemption costs 9 0.31 9 0.30 • Long-term contract adjustments - - 8 0.25 • Pension expense - - 2 0.08 • Non-income tax gain - - (13) (0.44) Adjusted ** $ 40 $ 1.33 $146 $4.67 **See Page 1 regarding non-GAAP financial measures * Q4 2015 was a two month fiscal quarter ended October 2, 2015. Fiscal 2015 was an eleven month year ended October 2, 2015.
|
 Q4
2015 Supplemental Financial Information 2015* Sales Change
(YOY) Items
Q4 Sales FY Sales 2014* $ 313 $ 1,801 • Foreign currency translation (17) (84) • FX forward contract loss (4) (18) • Acquisitions (primarily DAT) 20 88 • Additional week in Q4-15 39 - • Sales volume (1) (13) 2015* $ 350 $ 1,774 Dollars in millions 8 * Q4 2015 was a two month fiscal quarter ended October 2, 2015. Fiscal 2015 was an eleven month year ended
October 2, 2015. Comparisons to 2014 are for the two months and eleven months
ended September 26, 2014. |
 Q4
2015 Supplemental Financial Information 2015* Segment Sales Change
(YOY) Q4 Total
Change Q4 Organic¹
Q4 FX Q4 Acquisition FY Total Change FY Organic¹
FY FX FY Acquisition Avionics & Controls 34% 9% (5%) 18% 9% <(1%) (3%) 12% Sensors & Systems 6% 6% (12%) - (8%) 2% (11%) 1% Advanced Materials (10%) (21%) (2%) - (7%) (5%) (2%) - Total 12% <(1%) (7%) 6% (1%) <(1%) (6%) 5% ¹ Organic sales growth represents the total reported increase
within the company’s continuing operations less the impact of all foreign currency translation and hedging activities and acquisitions. 9 * Q4 2015 was a two month fiscal quarter ended October 2, 2015. Fiscal 2015 was an eleven month year ended
October 2, 2015. Comparisons to 2014 are for the two months and eleven months
ended September 26, 2014. |
 Q4
2015 Supplemental Financial Information 2015* Gross Margin Change
(YOY) Items
Q4 Gross Margin FY Gross Margin 2014* $ 102 $ 625 • FX Impact (8) (27) • DAT acquisition (FY: $28 million from operations less $7 million purchase accounting) 1 21 • Sales volume / mix 5 (15) • Additional week in Q4-15 13 - • Higher mfg. costs / Inventory reserves / EAC / Other adjustments 1 (15) 2015* $ 114 $ 589 Dollars in millions 10 * Q4 2015 was a two month fiscal quarter ended October 2, 2015. Fiscal 2015 was an eleven month year ended
October 2, 2015. Comparisons to 2014 are for the two months and eleven months
ended September 26, 2014. |
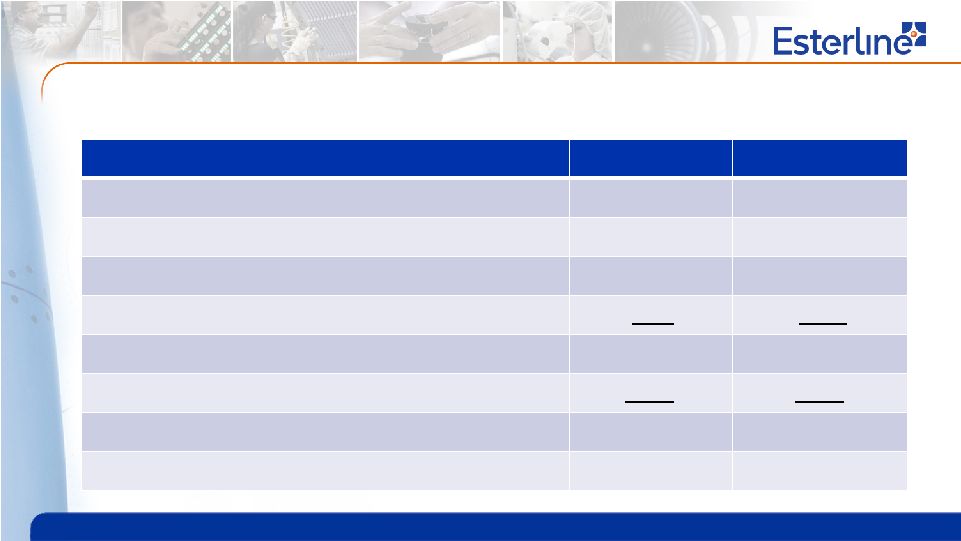
 Q4
2015 Supplemental Financial Information Adjusted Gross Margin and
EBIT See Appendix for supporting details
Avionics & Controls
Sensors & Systems Advanced Materials Total ESL Q4 2015 Gross Margin (Adjusted)* 36.0% 33.6% 33.7% 34.6% Q4 2014 Gross Margin (Adjusted)* 30.7% 34.8% 33.7% 33.0% FY 2015 Gross Margin (Adjusted)* 34.6% 35.6% 32.4% 34.5% FY 2014 Gross Margin (Adjusted)* 36.5% 34.1% 34.2% 35.0% Q4 2015 EBIT (Adjusted)* 16.0% 14.7% 18.6% 14.5% Q4 2014 EBIT (Adjusted)* 11.0% 12.0% 21.9% 11.0% FY 2015 EBIT (Adjusted)* 14.3% 12.5% 20.3% 12.2% FY 2014 EBIT (Adjusted)* 14.8% 12.0% 22.6% 12.5% 11 Q4 2015 was a two month fiscal quarter and FY 2015 was an eleven month period, both ended October 2, 2015. Comparisons are against the same
periods ended September 26, 2014. * See Page 1 regarding non-GAAP
financial measures |
 Q4
2015 Supplemental Financial Information Free Cash Flow
Reconciliation FY 2015*
FY 2014* Net earnings attributable to Esterline $ 60 $ 74 • Depreciation ($45M) and amortization ($46M) 91 113 • Change in working capital (A/R, Inventory, A/P) (8) (45) • Other 1 20 Cash flow from operations $ 144 $ 162 • Capital expenditures (49) (40) Free cash flow** $ 95 $ 122 Cash conversion** 159% 164% Dollars in millions 12 * YTD 2015 and 2014 include 11 months of each fiscal year. **See Page 1 regarding non-GAAP financial measures |
 Q4
2015 Supplemental Financial Information Share Repurchase
Update # Shares
In thousands $ Value In millions $ Authorization Remaining In millions • FY 2014 269 $ 30.3 • Q1 2015 850 92.6 • Q2 2015 312 34.7 • Q3 2015 1,400 132.2 • Q4 2015* 0 0 Total spend since inception** 2,831 $ 289.8 $110.2 * Q4 2015 includes the two months ended October 2, 2015 ** $400 million total authorization for share repurchase 13 |
 Q4
2015 Supplemental Financial Information 2015 Income Statement (Restated for new fiscal calendar)
14 Dollars in millions, except EPS Q1 Q2 Q3 Q4 FY Sales $505 $447 $505 $545 $2,002 Gross Margin $180 $144 $169 $186 $679 Earnings from Continuing Ops $34 $29 $25 $40 $128 GAAP EPS (diluted, continuing ops) $1.06 $0.90 $0.79 $1.35 $4.11 # weeks 13 13 13 14* 53* * Fiscal 2016 has a 13-week fourth quarter and 52 weeks in the year. The following information is presented to assist with the analysis of future financial results using our new fiscal calendar.
This financial information reflects our fiscal 2015 actual results restated for the new
fiscal calendar (October 2014 – September 2015). Our new fiscal
calendar begins with the 2016 fiscal year starting on October 3, 2015. |
 Q4
2015 Supplemental Financial Information 2016 Guidance
2016 Guidance Sales $2.03B - $2.08B GAAP EPS (diluted, continuing ops) $4.60 - $4.90 Adjusted EPS* (diluted, continuing ops) $5.50 - $5.80 *See Page 1 regarding non-GAAP financial measures 15 2016 Adjusted EPS GAAP EPS (diluted, continuing
ops) $4.60 -
$4.90 Accelerated Integration $0.11 Incremental Compliance $0.47 DAT Integration $0.32 Adjusted EPS* (diluted, continuing
ops) $5.50 -
$5.80 |
 Q4
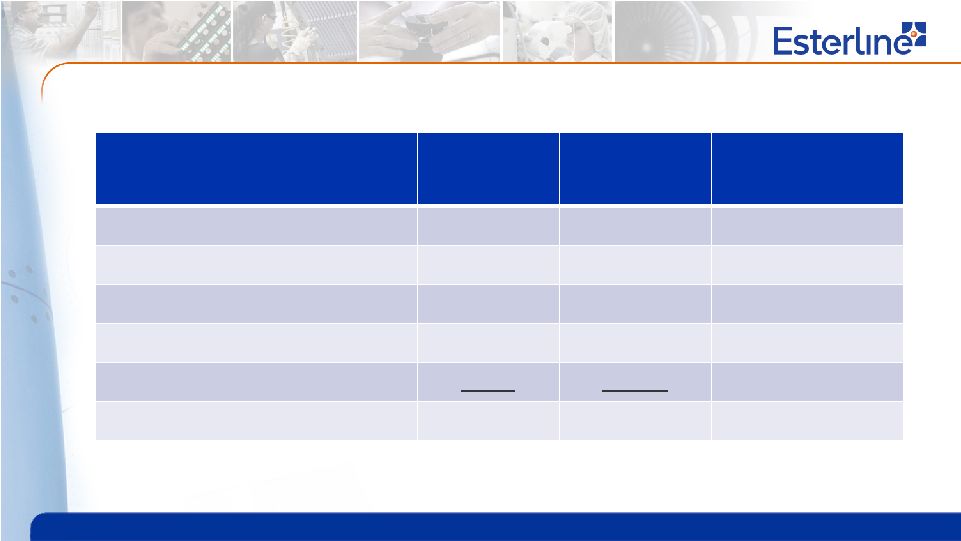
2015 Supplemental Financial Information Aerospace Growth and
Outlook 2015 Sales
Mix End Market 2015 Sales Growth* 2016 Sales Growth* Growth Drivers Beyond 2016 ~50% Commercial Aerospace Flat Low single digit Increased OE production rates: 737Max, A320Neo, 787, A350 Entry into service:, C919, E2, MRJ, C-Series Higher content: 777X ~30% Defense Flat Flat Increased OE production rates: F-35, A400M Entry into service: KC-390 ~80% Total Flat Low single digit ~10% Aftermarket (included in Commercial / Defense OE) Mid single digit Mid single digit Increased OE production rates Use Sensors aftermarket infrastructure for other ESL products 16 * Organic sales growth, excluding impacts from FX and acquisitions and adjusted for 11-month 2015 fiscal year.
|
 Q4
2015 Supplemental Financial Information Adjacent Markets
Outlook 2015 Sales
Mix End Market 2016 Expectations ~14% Industrial Opportunity for sales growth in high-end medical markets and “human- machine interface” products. Overall economic growth pressure in European and emerging markets. ~4% Gaming Lower sales due to extremely strong 2015. Some uncertainty continues due to customer consolidation. ~2% Energy Overall flat to lower sales. Opportunities in UK nuclear market. Continued
pressure on sales into oil & gas end markets.
~20% Total Low single digit growth 17 |
 Q4
2015 Supplemental Financial Information 2016 Guidance
Assumptions •
Interest expense ~ $30 million
– Annualized 2015 ~ $33 million – Fiscal 2016 starts with higher debt levels at lower interest rate • Tax rate ~ 21-22% (assumes expiration of the US R&D tax credit)
•
Average diluted shares outstanding ~ 29.6 million
18 |
 Q4
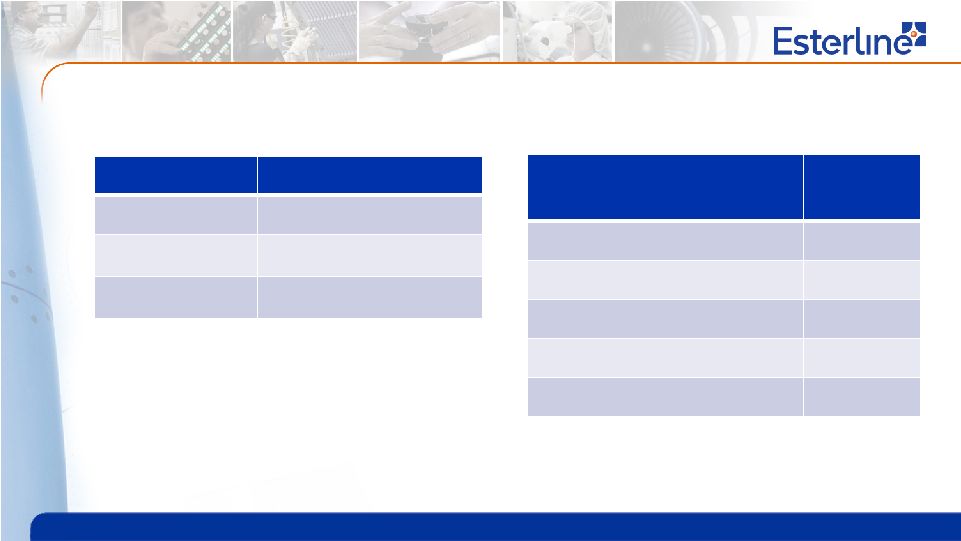
2015 Supplemental Financial Information Company-Wide Efficiency
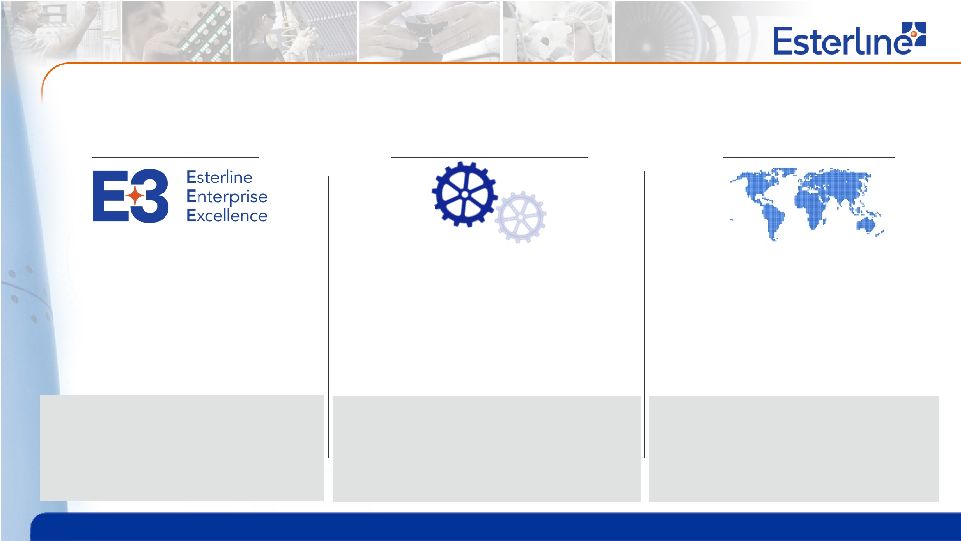
Initiatives Update Strategic Sourcing
Global Footprint INITIATIVE GOALS Achieve significant savings in material and services Implement standards and tools for sustainability • Remaining restructuring projects will complete in 2016 • Acquisition integrating well • Increasing competitive global presence • Savings ahead of plan • Savings tracker in place and automated • All commodities progressing well, executing to plan • Further projects being scoped and opportunities identified INITIATIVE GOALS Leverage global presence for growth Develop competitive cost structure Infrastructure supporting the Esterline Operating System 19 Ops Excellence • European launch for facility wide re-layout events • 8 Academies complete YTD – 224 leaders trained • Everett site “kaikaku” event complete INITIATIVE GOALS E3 transformation – entire facility New operating system deployed Leadership-driven, fully aligned operational improvements |
 Q4
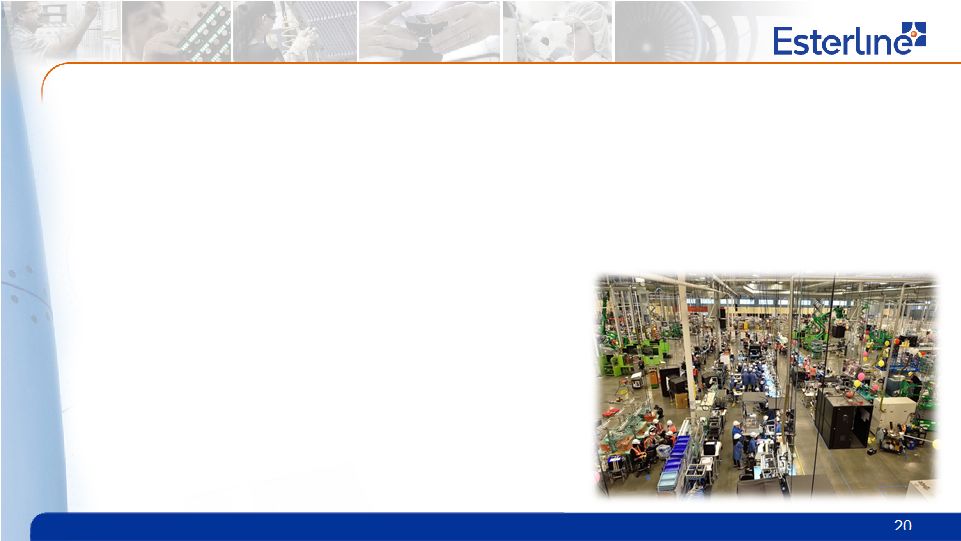
2015 Supplemental Financial Information E3 Transformation
– Everett
Facility 20 Kaikaku – Japanese for “radical change” • Re-layout of the entire manufacturing operation – Aligned fab. processes and physically linked them to main assembly lines • Key expected outcomes: – Double yearly revenue capacity – Reduce “days to manufacture” by 50% • Standard work makes process repeatable in other Esterline units • Part of a ~43-week process of transforming the entire value stream |
 Q4
2015 Supplemental Financial Information DAT* Integration
Update 2015 Highlights
•
Integration progressing well with three areas of challenge:
– IT, Export Compliance, Facility relocation • FY gross margins ~ 32% (excludes purchase accounting)
2016 Update • Continued progress on integration and synergies – Focus on incremental top-line growth and cost savings • DAT results integrated into platforms within Avionics & Controls segment in fiscal Q2 2016 21 * Defense, Aerospace and Training display business (DAT), acquired from Barco N.V. in the second quarter of our fiscal 2015.
|
 Q4
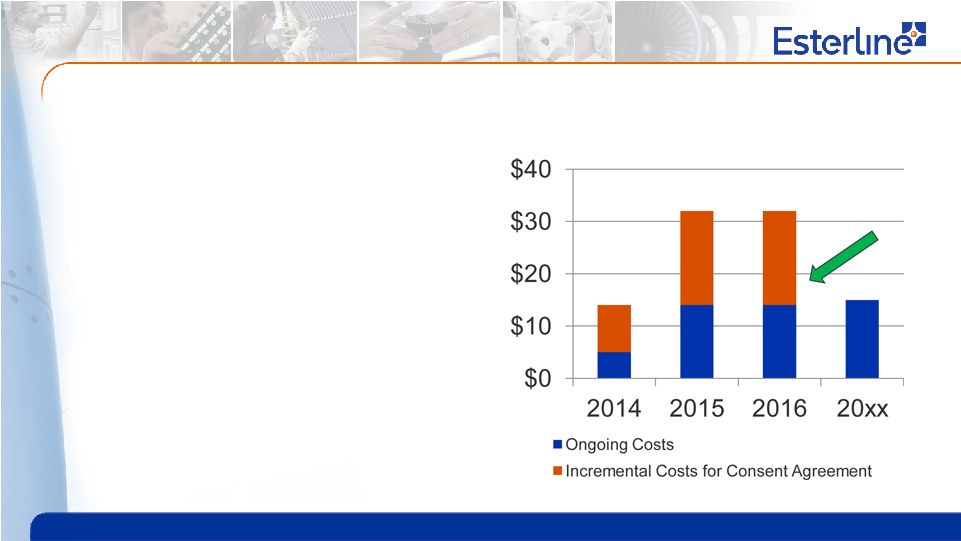
2015 Supplemental Financial Information Export Compliance
Update 22
• Mid-way through 3-year Consent Agreement (ends March 2017) • Enterprise-wide training, policies & procedures implemented • Next action: Internal audits Incremental costs will be $0 after consent agreement $ in millions |
 Q4
2015 Supplemental Financial Information Appendix
23 |
 Q4
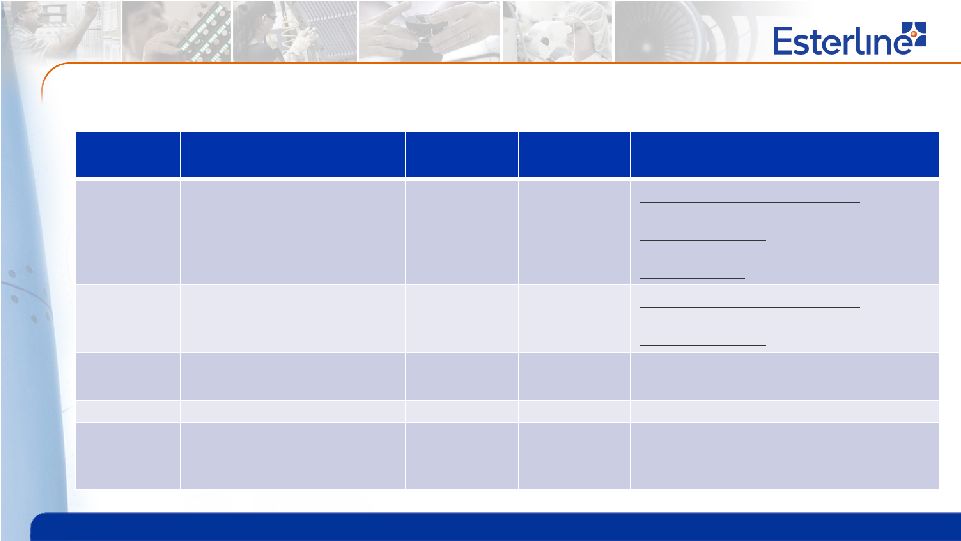
2015 Supplemental Financial Information Q4 2015* Adjusted Gross Margin and
EBIT 24
* Q4 2015 was a two month fiscal period ended October 2, 2015.
In thousands
Avionics
Sensors
AM
ESL
GAAP Sales
151,086
$
117,835
$
80,706
$
349,627
$
DAT Sales
(20,029)
-
-
(20,029)
Adjusted Sales
131,057
$
117,835
$
80,706
$
329,598
$
GAAP Gross Margin
47,720
$
39,377
$
27,068
$
114,165
$
Accelerated Integration
-
199
133
332
DAT Gross Margin
(553)
-
-
(553)
Adjusted Gross Margin
47,167
$
39,576
$
27,201
$
113,944
$
In thousands
Avionics
Sensors
AM
Corporate
ESL
GAAP EBIT
15,230
$
16,296
$
14,802
$
(9,099)
$
37,229
$
Accelerated Integration
65
1,035
247
249
1,596
Incremental Compliance
-
-
-
3,320
3,320
DAT Net Loss
5,609
-
-
-
5,609
Adjusted EBIT
20,904
$
17,331
$
15,049
$
(5,530)
$
47,754
$
Adjusted GM as a % of Adjusted Sales
36.0%
33.6%
33.7%
-
34.6%
Adjusted EBIT as a % of Adjusted Sales
16.0%
14.7%
18.6%
-
14.5% |
 Q4
2015 Supplemental Financial Information Q4 2014* Adjusted Gross Margin and
EBIT 25
* Q4 2014 was a two month fiscal period ended September 26, 2014.
In thousands
Avionics
Sensors
AM
ESL
GAAP Sales
112,412
$
110,719
$
90,069
$
313,200
$
GAAP Gross Margin
34,324
$
37,880
$
29,896
$
102,100
$
Accelerated Integration
209
651
446
1,306
Incremental Compliance
9
2
(27)
(16)
Adjusted Gross Margin
34,542
$
38,533
$
30,315
$
103,390
$
In thousands
Avionics
Sensors
AM
Corporate
ESL
GAAP EBIT
11,402
$
11,842
$
18,539
$
(11,934)
$
29,849
$
Accelerated Integration
705
1,255
976
194
3,130
Incremental Compliance
246
165
167
819
1,397
Adjusted EBIT
12,353
$
13,262
$
19,682
$
(10,921)
$
34,376
$
Adjusted GM as a % of Adjusted Sales
30.7%
34.8%
33.7%
-
33.0%
Adjusted EBIT as a % of Adjusted Sales
11.0%
12.0%
21.9%
-
11.0% |
 Q4
2015 Supplemental Financial Information FY 2015* Adjusted Gross Margin and
EBIT 26
* FY 2015 was an eleven month fiscal year ended October 2, 2015.
In thousands
Avionics
Sensors
AM
ESL
GAAP Sales
727,801
$
633,446
$
413,202
$
1,774,449
$
DAT Sales
(82,525)
-
-
(82,525)
Adjusted Sales
645,276
$
633,446
$
413,202
$
1,691,924
$
GAAP Gross Margin
234,922
$
221,218
$
133,253
$
589,393
$
Accelerated Integration
-
4,322
761
5,083
Long-Term Contract Adjustments
7,814
-
-
7,814
DAT Gross Margin
(19,329)
-
-
(19,329)
Adjusted Gross Margin
223,407
$
225,540
$
134,014
$
582,961
$
In thousands
Avionics
Sensors
AM
Corporate
ESL
GAAP EBIT
65,910
$
87,443
$
80,951
$
(77,319)
$
156,985
$
Accelerated Integration
705
7,146
2,778
1,093
11,722
Incremental Compliance
-
-
-
18,291
18,291
DAT Net Loss & Closing Expenses
16,048
-
-
6,000
22,048
Long-Term Contract Adjustments
9,934
-
-
-
9,934
Pension Expense
-
-
-
3,000
3,000
Non-Income Tax Gain
-
(15,656)
-
-
(15,656)
Adjusted EBIT
92,597
$
78,933
$
83,729
$
(48,935)
$
206,324
$
Adjusted GM as a % of Adjusted Sales
34.6%
35.6%
32.4%
-
34.5%
Adjusted EBIT as a % of Adjusted Sales
14.3%
12.5%
20.3%
-
12.2% |
 Q4
2015 Supplemental Financial Information FY 2014* Adjusted Gross Margin and
EBIT 27
* FY 2014 was an eleven month fiscal period ended September 26, 2015.
In thousands
Avionics
Sensors
AM
ESL
GAAP Sales
668,595
$
689,850
$
442,682
$
1,801,127
$
GAAP Gross Margin
241,826
$
232,446
$
150,442
$
624,714
$
Accelerated Integration
1,826
2,780
738
5,344
Incremental Compliance
315
298
64
677
Adjusted Gross Margin
243,967
$
235,524
$
151,244
$
630,735
$
In thousands
Avionics
Sensors
AM
Corporate
ESL
GAAP EBIT
92,227
$
73,653
$
94,450
$
(60,332)
$
199,998
$
Accelerated Integration
5,133
6,782
4,863
669
17,447
Incremental Compliance
1,435
2,672
744
3,451
8,302
Adjusted EBIT
98,795
$
83,107
$
100,057
$
(56,212)
$
225,747
$
Adjusted GM as a % of Adjusted Sales
36.5%
34.1%
34.2%
-
35.0%
Adjusted EBIT as a % of Adjusted Sales
14.8%
12.0%
22.6%
-
12.5% |