Attached files
| file | filename |
|---|---|
| 8-K - CURRENT REPORT - PALTALK, INC. | f8k102915_snapinteractive.htm |
Exhibit 99.1
Snap Interactive, Inc. (OTCQB: STVI) Investor Presentation October 2015
Safe Harbor 2 This presentation is for discussion purposes only. The material is based upon information that we consider reliable, but we do not represent that it is accurate or complete, and it should not be relied upon as such. Certain statements in this presentation constitute “forward - looking statements” relating to Snap Interactive, Inc. (“SNAP,” “Sna p Interactive” or the “Company”) made under the safe harbor provisions of the Private Securities Litigation Reform Act of 1995 that are based on cu rre nt expectations, estimates, forecasts and assumptions and are subject to risks and uncertainties. In some cases, you can identify these statements by words such as “may”, “might”, “will”, “should”, “expect”, “plan”, “anticipate”, “believe”, “estimate”, “predict”, “optimistic”, “potential”, “future” or “ continue,” and variations of such words and other comparable terminology. All forward - looking statements speak only as of the date on which they are made. Readers are specifica lly directed to the Company’s filings with the Securities and Exchange Commission for a description of certain risks, uncertainties and assumptions and to the discussion under “Risk Factors” in the Company’s most recently filed Annual Report on Form 10 - K, Quarterly Reports on Form 10 - Q and other Securities an d Exchange Commission filings. These risks and uncertainties, as well as other risks and uncertainties of which the Company is not aware of or whi ch the Company does not currently believe to be material, may cause actual future results to be materially different than those expressed by these forward - looking statements. In addition, there can be no assurance that actual results will meet expectations. Actual results could differ materially because of a number of factors, including, without limitation, factors such as: • The Company’s ability to generate and sustain increased revenue levels and achieve profitability in the future ; • The Company’s ability to release new applications; • The Company’s future growth and growth strategy; • The Company’s use of proceeds from a debt or equity financing; • The Company’s ability to repay indebtedness; • The Company’s ability to anticipate and respond to changing trends and preferences; • The Company’s heavy reliance on a limited number of third party platforms to run the Company’s application; • The intense competition in the online dating marketplace; • The Company’s reliance on its executive officers; and • The success of new applications and application features on user engagement, user conversion and our results of operations. The Company’s actual results, performance and achievements may differ materially from any future results, performance, or ach iev ements expressed or implied by such forward - looking statements. All forward - looking statements speak only as of the date on which they are made. We do not a ssume responsibility for the accuracy or completeness of any forward - looking statement and you should not rely on forward - looking statements as predictions o f future events. We do not undertake any obligation to update any forward - looking statement, whether written or oral, relating to the matters discussed her ein, except to the extent required by applicable securities laws .
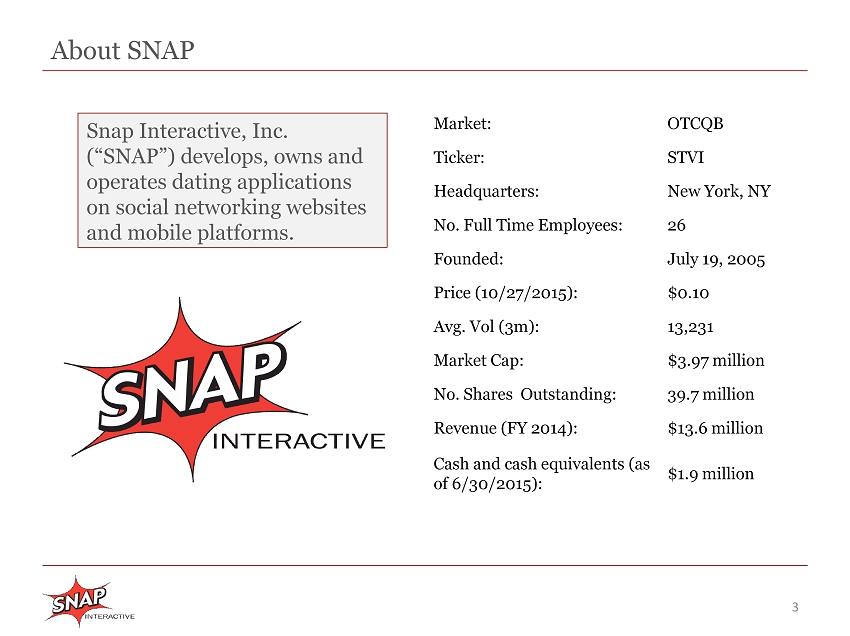
About SNAP 3 Snap Interactive, Inc . (“SNAP”) develops, owns and operates dating applications on social networking websites and mobile platforms. Market: OTCQB Ticker: STVI Headquarters: New York, NY No. Full Time Employees: 26 Founded: July 19, 2005 Price (10/27/2015): $0.10 Avg. Vol (3m): 13,231 Market Cap: $3.97 million No. Shares Outstanding: 39.7 million Revenue (FY 2014): $13.6 million Cash and cash equivalents (as of 6/30/2015): $1.9 million
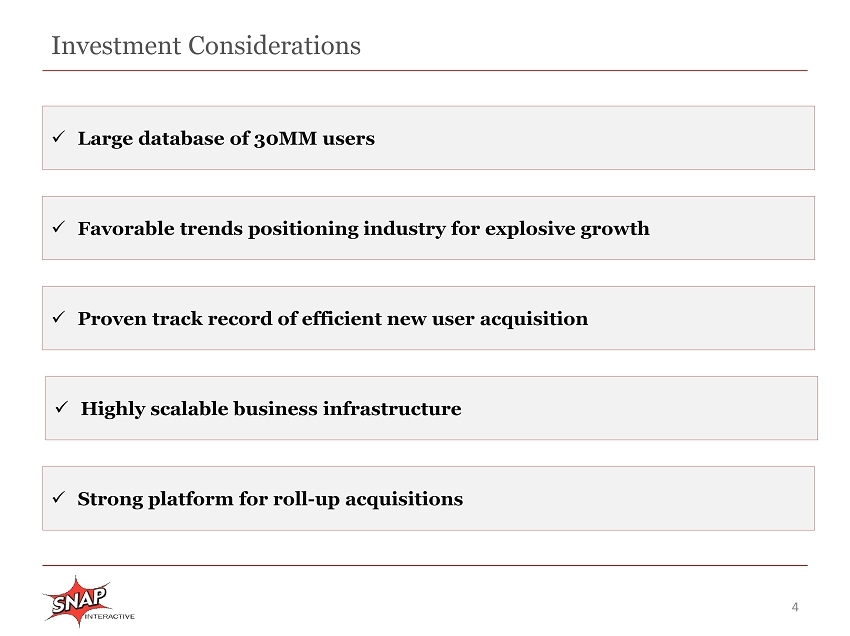
Investment Considerations 4 Middle Market Focus x Proven track record of efficient new u ser acquisition x Strong platform for roll - up acquisitions x Large database of 30MM users x Favorable trends positioning industry for explosive growth x Highly scalable business infrastructure
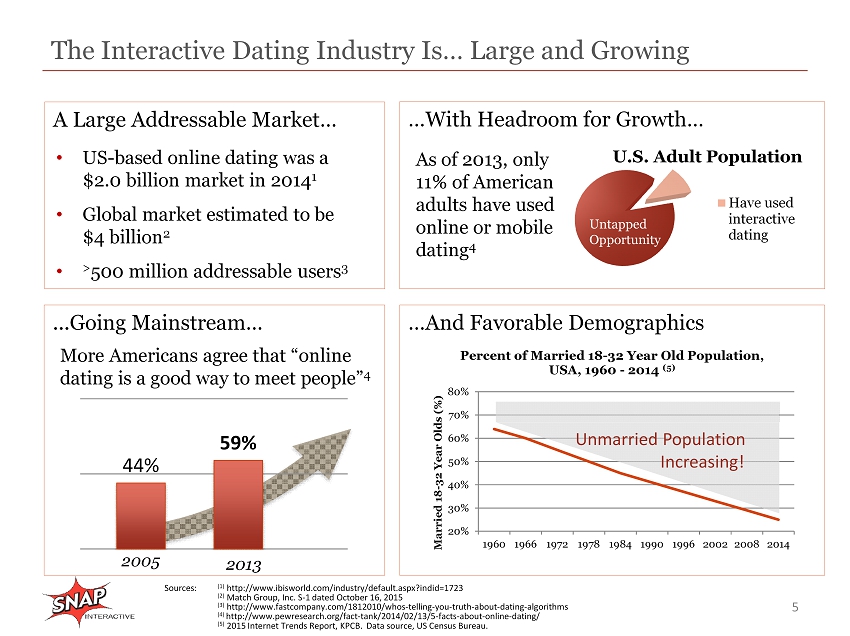
U.S. Adult Population Have used interactive dating The Interactive Dating Industry Is… Large and Growing 5 Sources: (1) http://www.ibisworld.com/industry/default.aspx?indid=1723 (2) Match Group, Inc. S - 1 dated October 16, 2015 (3) http://www.fastcompany.com/1812010/whos - telling - you - truth - about - dating - algorithms (4) http://www.pewresearch.org/fact - tank/2014/02/13/5 - facts - about - online - dating / (5) 2015 Internet Trends Report, KPCB. Data source, US Census Bureau. A Large Addressable Market… • US - based online dating was a $2.0 billion market in 2014 1 • Global market estimated to be $4 billion 2 • > 500 million addressable users 3 As of 2013, only 11% of American adults have used online or mobile dating 4 …With Headroom for Growth… Untapped Opportunity More Americans agree that “online dating is a good way to meet people” 4 ...Going Mainstream… …And Favorable Demographics 20% 30% 40% 50% 60% 70% 80% 1960 1966 1972 1978 1984 1990 1996 2002 2008 2014 Married 18 - 32 Year Olds (%) Percent of Married 18 - 32 Year Old Population, USA, 1960 - 2014 (5) 44% 59% 2005 2013 Unmarried Population Increasing!
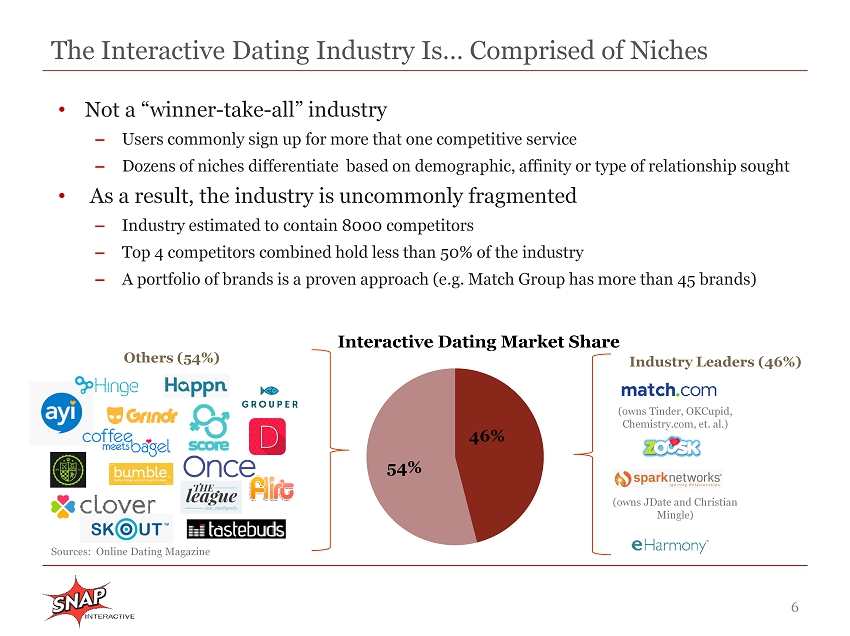
The Interactive Dating Industry Is… Comprised of Niches 6 • Not a “winner - take - all” industry – Users commonly sign up for more that one competitive service – Dozens of niches differentiate based on demographic, affinity or type of relationship sought • As a result, the industry is uncommonly fragmented – Industry estimated to contain 8000 competitors – Top 4 competitors combined hold less than 50% of the industry – A portfolio of brands is a proven approach (e.g. Match Group has more than 45 brands) 46% 54% Interactive Dating Market Share Industry Leaders (46%) (owns Tinder, OKCupid , Chemistry.com, et. al.) (owns JDate and Christian Mingle) Others (54%) Sources: Online Dating Magazine
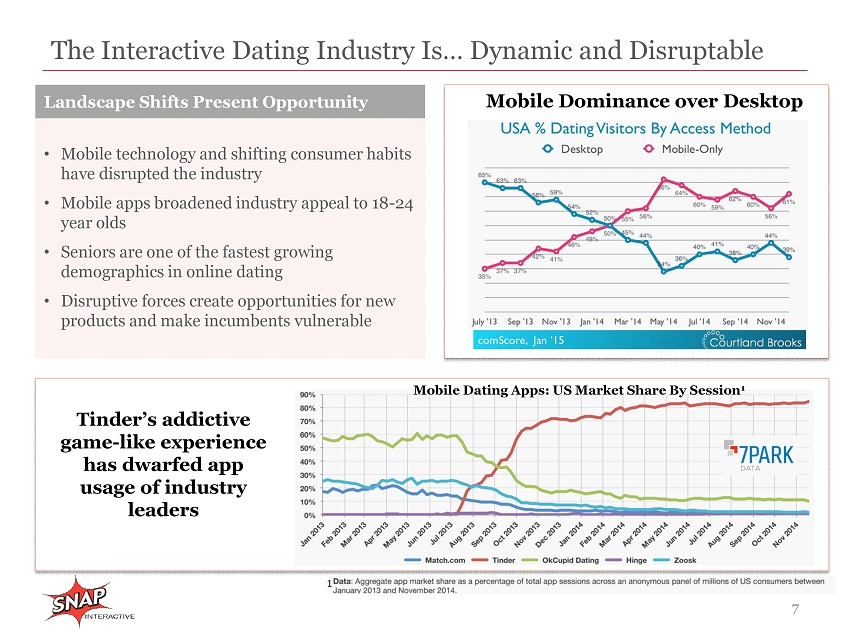
The Interactive Dating Industry Is… Dynamic and Disruptable 7 Mobile Dominance over Desktop 7 Tinder’s addictive g ame - like e xperience h as d warfed a pp u sage of industry l eaders Mobile Dating Apps: US Market Share By Session 1 1 • Mobile technology and shifting consumer habits have disrupted the industry • Mobile apps broadened industry appeal to 18 - 24 year olds • Seniors are one of the fastest growing demographics in online dating • Disruptive forces create opportunities for new products and make incumbents vulnerable Landscape Shifts Present Opportunity 7
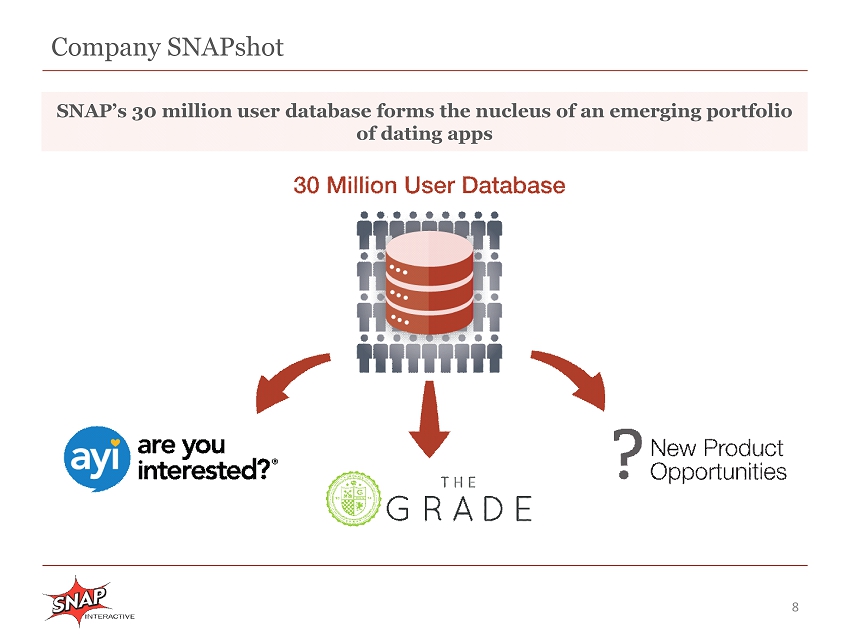
Company SNAPshot 8 SNAP’s 30 million user database forms the nucleus of an emerging portfolio of dating apps
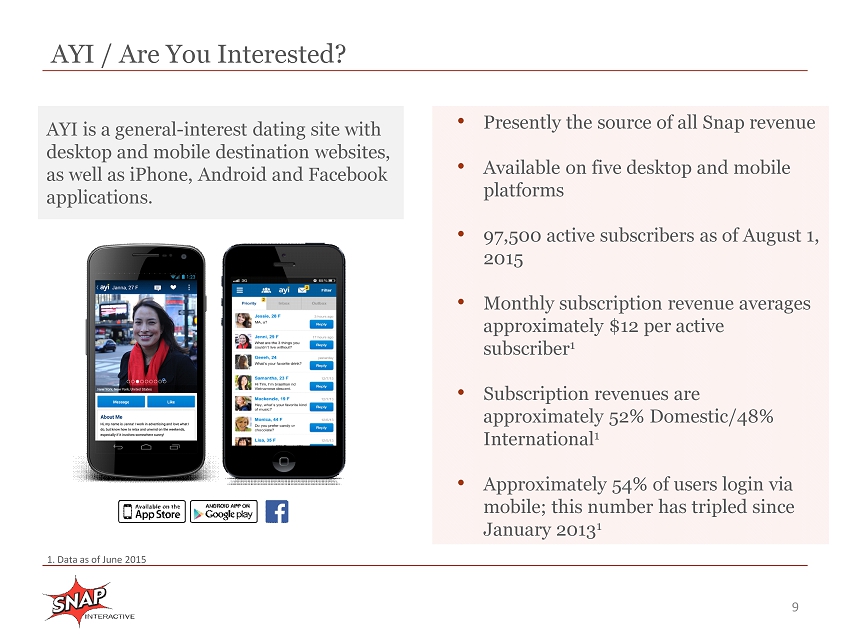
9 AYI is a general - interest dating site with desktop and mobile destination websites, as well as iPhone , Android and Facebook applications. • Presently the source of all Snap revenue • Available on five desktop and mobile platforms • 97,500 active subscribers as of August 1, 2015 • Monthly subscription revenue averages approximately $ 12 per active subscriber 1 • Subscription revenues are approximately 52% Domestic/48 % International 1 • Approximately 54% of users login via mobile; this number has tripled since January 2013 1 AYI / Are You Interested? 1. Data as of June 2015
10 AYI’s Platform Is Scalable and Can Be Replicated for New Apps • In AYI, SNAP has a mature, scalable infrastructure that is common to nearly all dating services – Direct marketing platform – Analytics – Billing infrastructure – Customer service – Fraud prevention – Email / notification platform • SNAP’s ability to replicate the AYI infrastructure to produce new products is a competitive advantage – New products can launch on all five platforms – Users may be cross - sold across products – Existing marketing channels can immediately support the new product – Monetization engine can be readily deployed
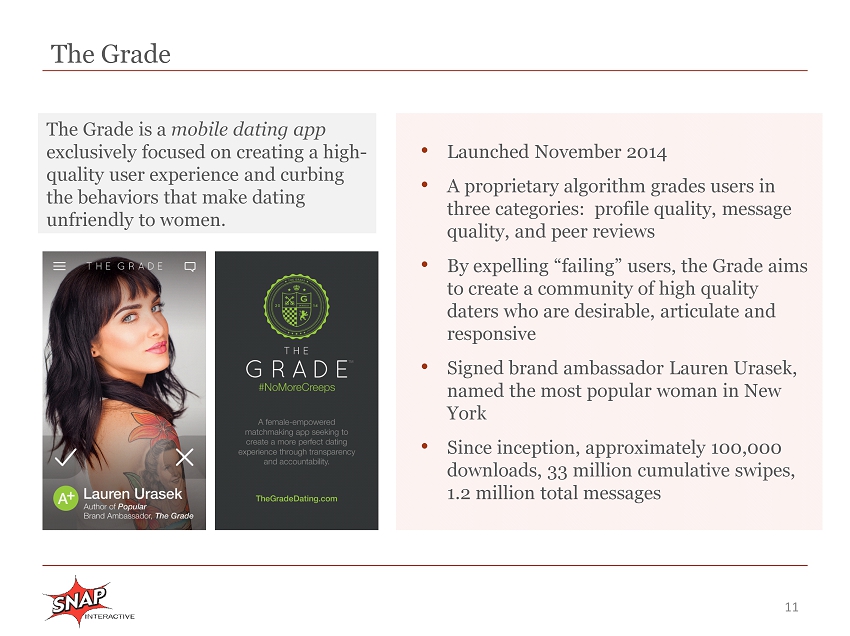
The Grade 11 The Grade is a mobile dating app exclusively focused on creating a high - quality user experience and curbing the behaviors that make dating unfriendly to women. • Launched November 2014 • A proprietary algorithm grades users in three categories: profile quality, message quality, and peer reviews • By expelling “failing” users, the Grade aims to create a community of high quality daters who are desirable, articulate and responsive • Signed brand ambassador Lauren Urasek , named the most popular woman in New York • Since inception, approximately 100,000 downloads, 33 million cumulative swipes, 1.2 million total messages
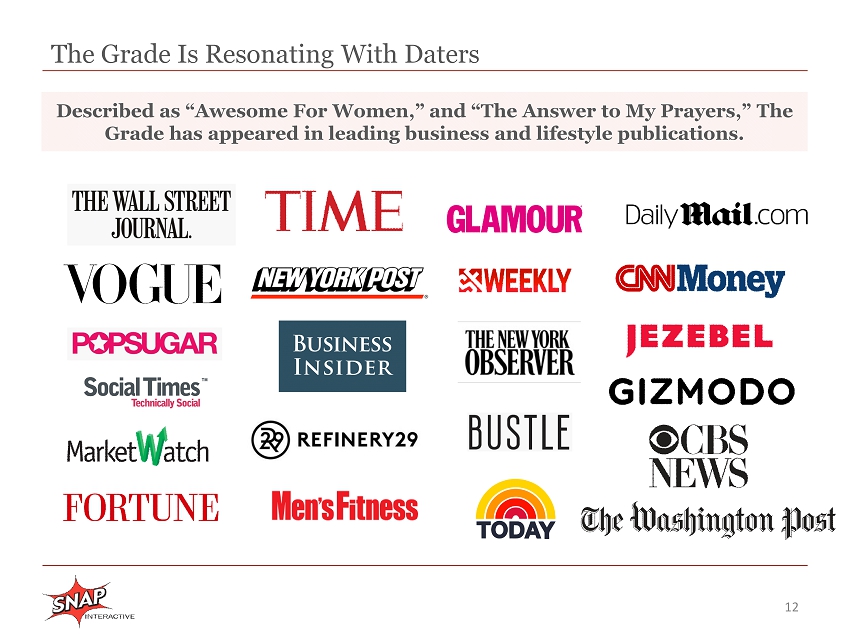
12 Described as “Awesome For Women,” and “The Answer to My Prayers,” The Grade has appeared in leading business and lifestyle publications. The Grade Is Resonating With Daters
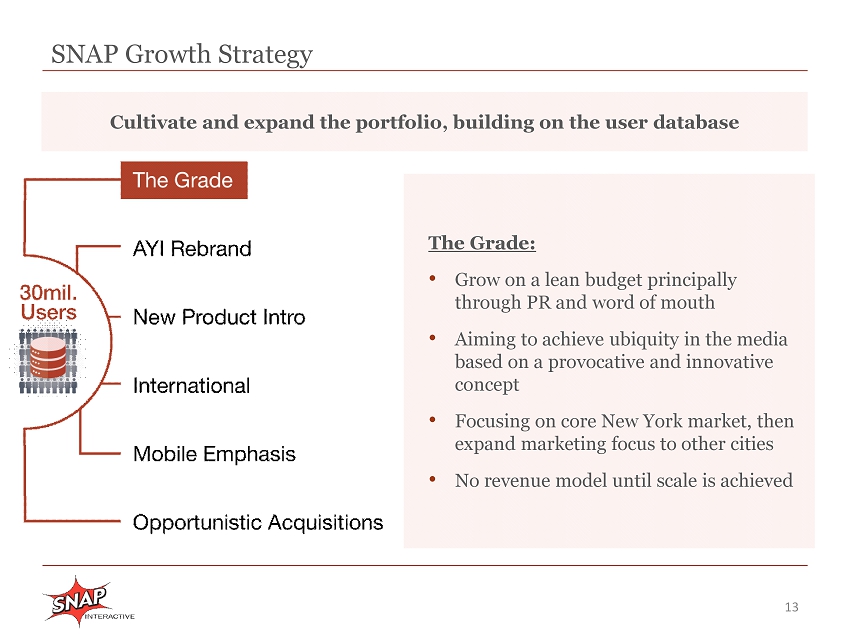
SNAP Growth Strategy 13 The Grade: • Grow on a lean budget principally through PR and word of mouth • Aiming to achieve ubiquity in the media based on a provocative and innovative concept • Focusing on core New York market, then expand marketing focus to other cities • No revenue model until scale is achieved Cultivate and expand the portfolio, building on the user database
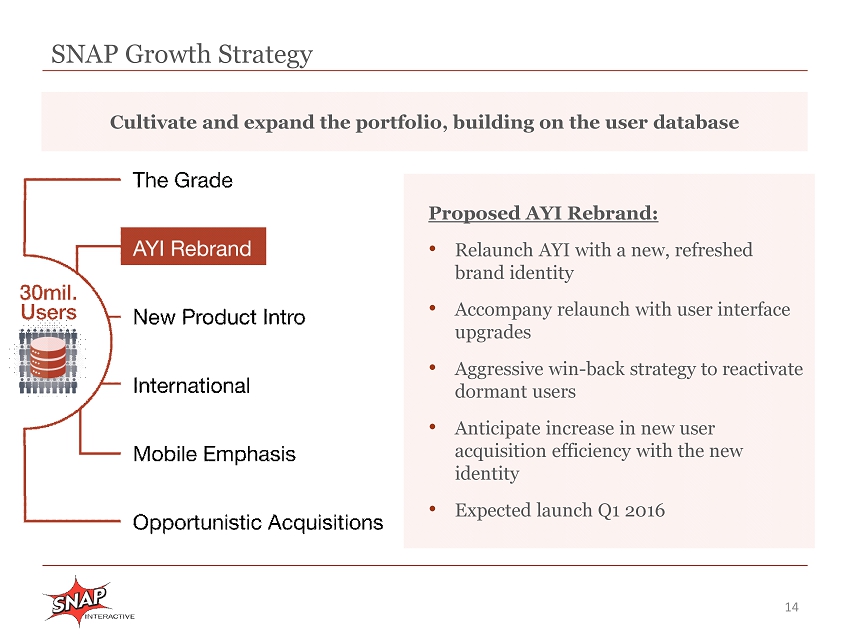
SNAP Growth Strategy 14 Proposed AYI Rebrand: • Relaunch AYI with a new, refreshed brand identity • Accompany relaunch with user interface upgrades • Aggressive win - back strategy to reactivate dormant users • Anticipate increase in new user acquisition efficiency with the new identity • Expected launch Q1 2016 Cultivate and expand the portfolio, building on the user database
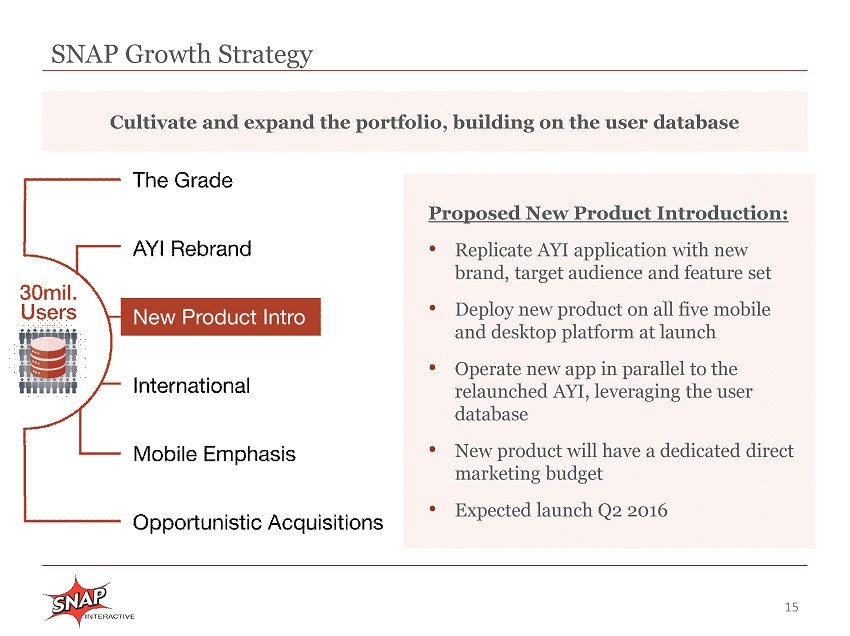
SNAP Growth Strategy 15 Proposed New Product Introduction: • Replicate AYI application with new brand, target audience and feature set • Deploy new product on all five mobile and desktop platform at launch • Operate new app in parallel to the relaunched AYI, leveraging the user database • New product will have a dedicated direct marketing budget • Expected launch Q2 2016 Cultivate and expand the portfolio, building on the user database
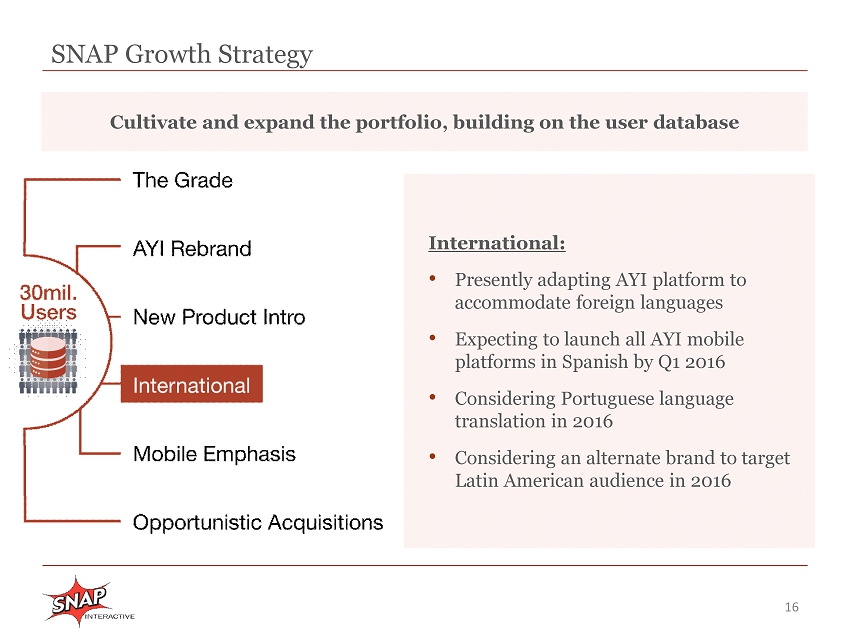
SNAP Growth Strategy 16 Cultivate and expand the portfolio, building on the user database International: • Presently adapting AYI platform to accommodate foreign languages • Expecting to launch all AYI mobile platforms in Spanish by Q1 2016 • Considering Portuguese language translation in 2016 • Considering an alternate brand to target Latin American audience in 2016
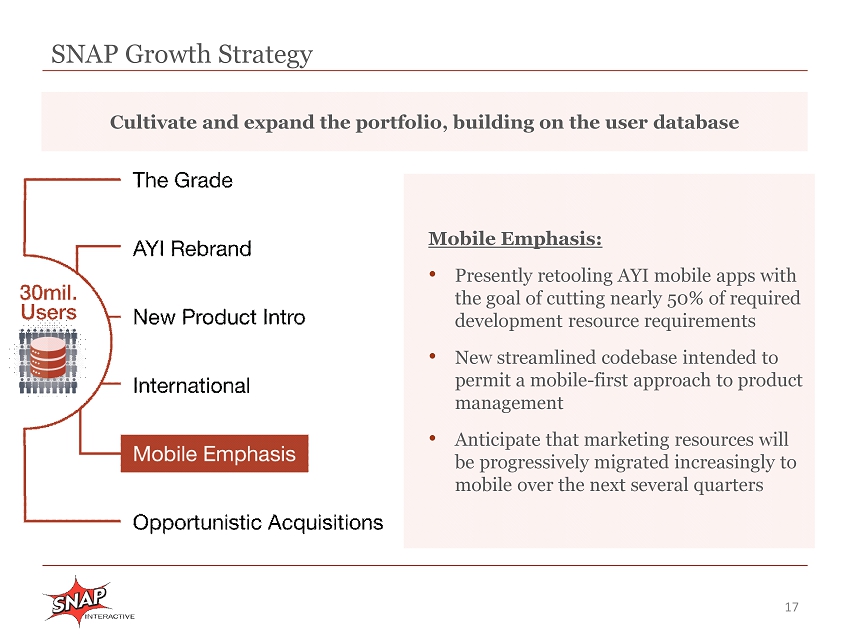
SNAP Growth Strategy 17 Cultivate and expand the portfolio, building on the user database Mobile Emphasis: • Presently retooling AYI mobile apps with the goal of cutting nearly 50% of required development resource requirements • New streamlined codebase intended to permit a mobile - first approach to product management • Anticipate that marketing resources will be progressively migrated increasingly to mobile over the next several quarters
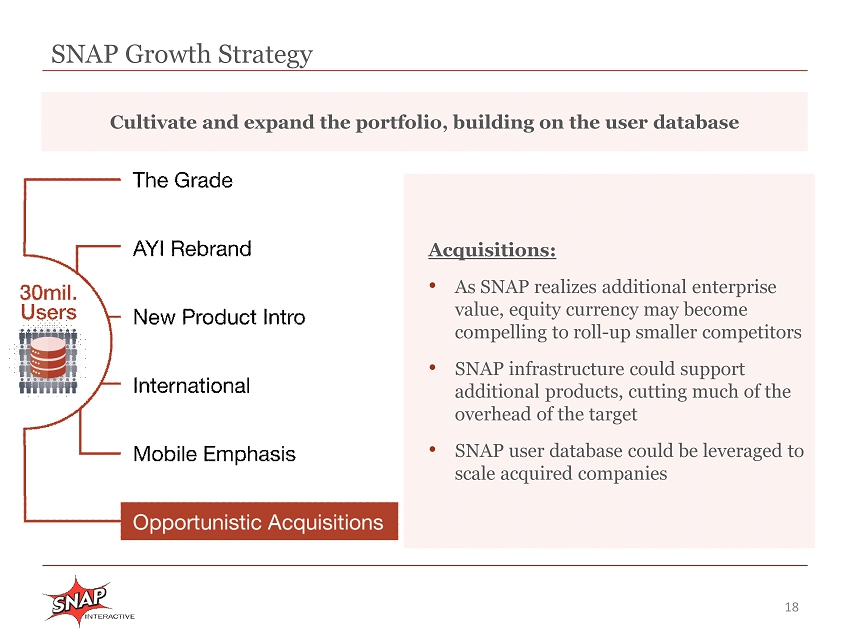
SNAP Growth Strategy 18 Cultivate and expand the portfolio, building on the user database Acquisitions: • As SNAP realizes additional enterprise value, equity currency may become compelling to roll - up smaller competitors • SNAP infrastructure could support additional products, cutting much of the overhead of the target • SNAP user database could be leveraged to scale acquired companies
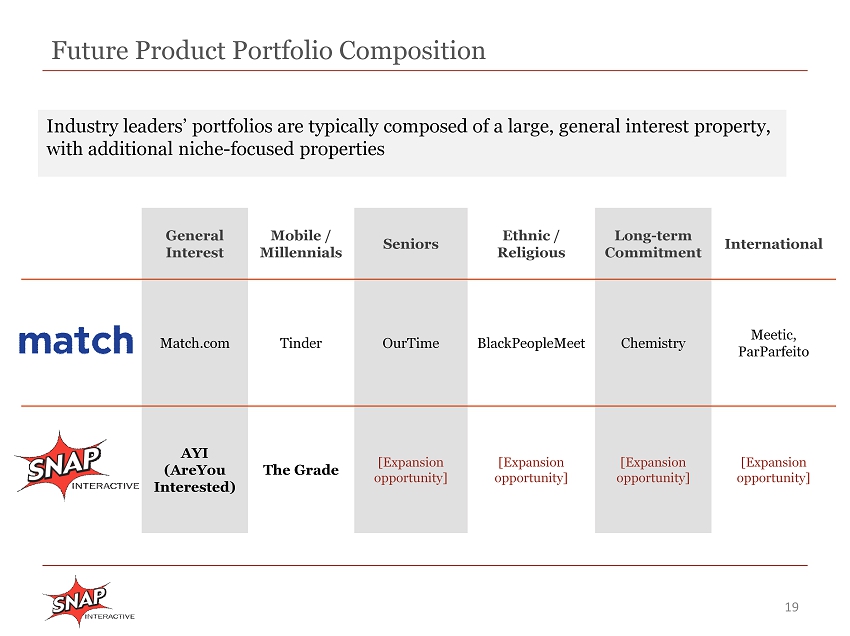
Future Product Portfolio Composition 19 General Interest Mobile / Millennials Seniors Ethnic / Religious Long - term Commitment International Match.com Tinder OurTime BlackPeopleMeet Chemistry Meetic , ParParfeito AYI ( AreYou Interested) The Grade [Expansion opportunity] [Expansion opportunity] [Expansion opportunity] [Expansion opportunity] Industry leaders’ portfolios are typically composed of a large, general interest property, with additional niche - focused properties
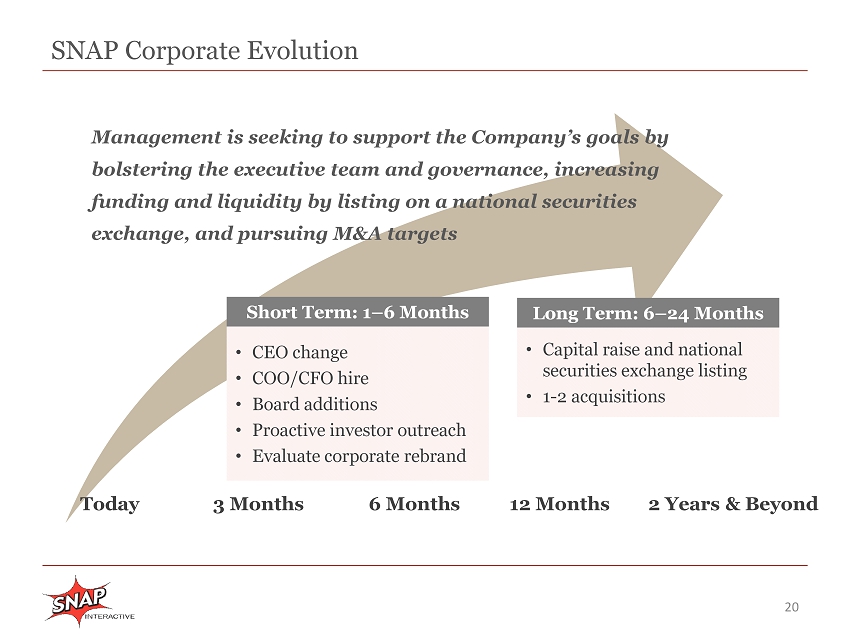
Management is seeking to support the Company’s goals by bolstering the executive team and governance, increasing funding and liquidity by listing on a national securities exchange, and pursuing M&A targets SNAP Corporate Evolution 20 Today 3 Months 6 Months 12 Months 2 Years & Beyond • CEO change • COO/CFO h ire • Board additions • Proactive investor outreach • Evaluate corporate rebrand Short Term: 1 – 6 Months • Capital raise and national securities exchange listing • 1 - 2 acquisitions Long Term: 6 – 24 Months
21 Alex Harrington CEO Clifford Lerner Co - Founder, Chairman • Served as CEO of mobile dating pioneer MeetMoi , which was sold to Match.com • Also served as SVP of Strategy and Operations for Zagat Survey, where he oversaw a transformation of digital business • Holds an MBA from Wharton • Started Snap in 2005 • Credited with several innovations in online dating including launching the first successful Facebook dating app, first to launch “swipe on mobile,” first to integrate your friends and friends of friends into dating • Graduated from Cornell and worked as an analyst at Lehman Brothers . Management

FINANCIAL CONSIDERATIONS 22

23 Economic/Financial Model Subscription Advertising • Derived from AYI at present • Recurring revenue stream is predictable • Lead generation to other dating networks • Ad networks Short - Term Business Objectives Revenue Sources Reserve Cash for Product Launches – Reduce AYI Marketing Investment Relaunch AYI; New Product Launch Incubate The Grade Short - Term Adverse Effect on Subscription Revenue 2016 Revenue Growth Opportunity Attribution of Industry C omparable E nterprise V alue Expected Outcomes
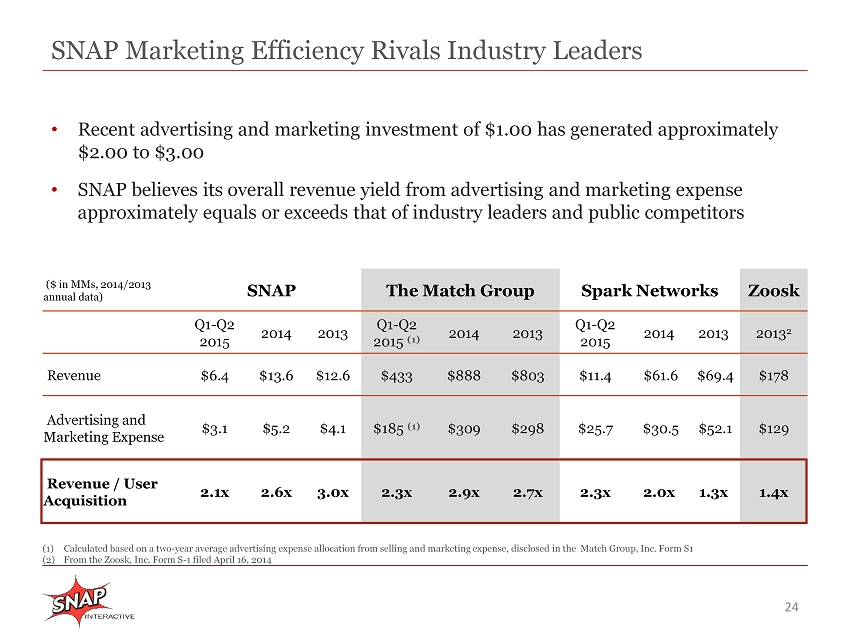
24 SNAP Marketing Efficiency Rivals Industry Leaders ($ in MMs, 2014/2013 annual d ata) SNAP The Match Group Spark Networks Zoosk Q1 - Q2 2015 2014 2013 Q1 - Q2 2015 (1) 2014 2013 Q1 - Q2 2015 2014 2013 2013 2 Revenue $6.4 $13.6 $12.6 $433 $888 $803 $11.4 $61.6 $69.4 $178 Advertising and Marketing Expense $3.1 $5.2 $4.1 $185 (1) $309 $298 $25.7 $30.5 $52.1 $129 Revenue / User Acquisition 2.1x 2.6x 3.0x 2.3x 2.9x 2.7x 2.3x 2.0x 1.3x 1.4x (1) Calculated based on a two - year average advertising expense allocation from selling and marketing expense, disclosed in the Matc h Group, Inc. Form S1 (2) From the Zoosk , Inc. Form S - 1 filed April 16, 2014 • Recent advertising and marketing investment of $ 1.00 has generated approximately $2.00 to $3.00 • SNAP believes its overall revenue yield from advertising and marketing expense approximately equals or exceeds that of industry leaders and public competitors
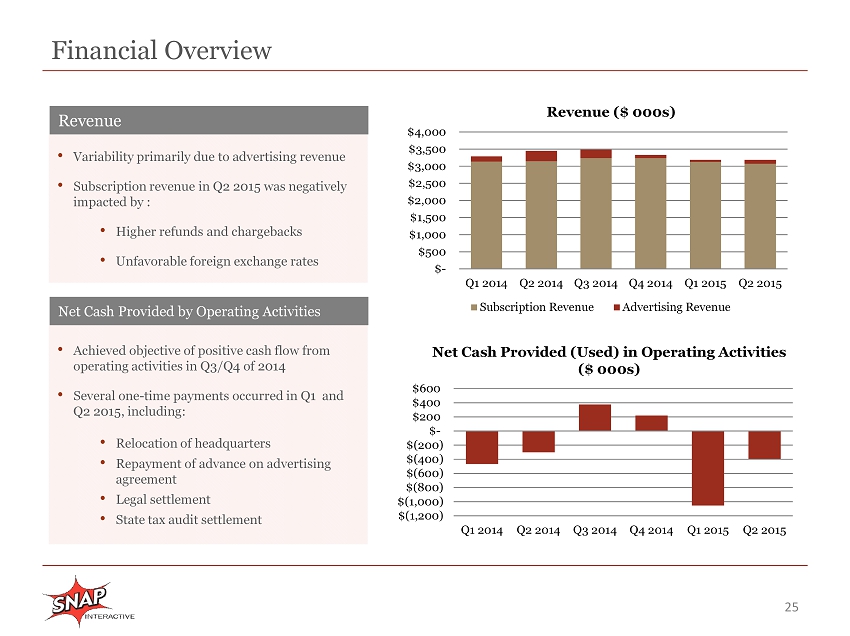
25 Financial Overview 25 • Variability primarily due to advertising revenue • Subscription revenue in Q2 2015 was negatively impacted by : • Higher refunds and chargebacks • Unfavorable foreign exchange rates Revenue • Achieved objective of positive cash flow from operating activities in Q3/Q4 of 2014 • Several one - time payments occurred in Q1 and Q2 2015, including: • Relocation of headquarters • Repayment of advance on advertising agreement • Legal settlement • State tax audit settlement Net Cash Provided by Operating Activities $- $500 $1,000 $1,500 $2,000 $2,500 $3,000 $3,500 $4,000 Q1 2014 Q2 2014 Q3 2014 Q4 2014 Q1 2015 Q2 2015 Revenue ($ 000s) Subscription Revenue Advertising Revenue $(1,200) $(1,000) $(800) $(600) $(400) $(200) $- $200 $400 $600 Q1 2014 Q2 2014 Q3 2014 Q4 2014 Q1 2015 Q2 2015 Net Cash Provided (Used) in Operating Activities ($ 000s )
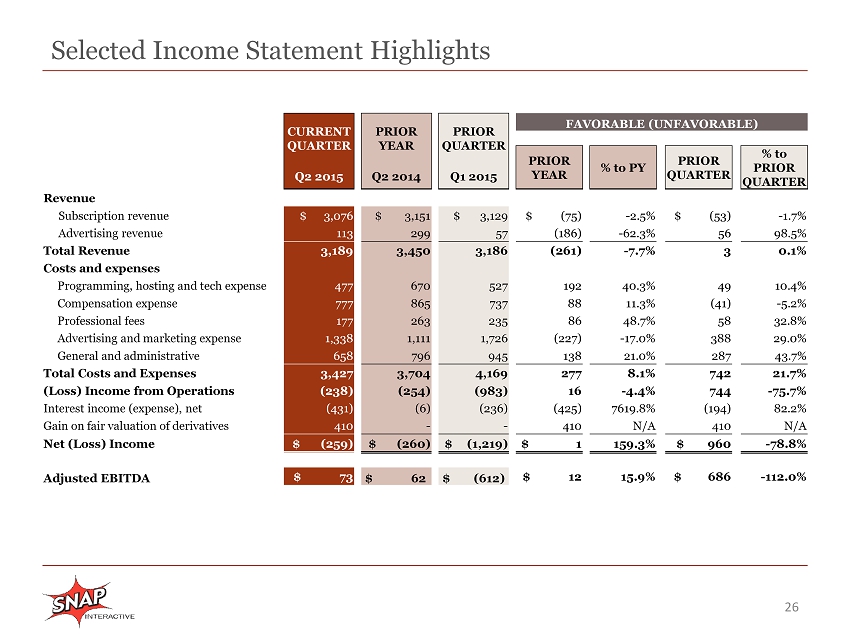
Selected Income Statement Highlights 26 CURRENT QUARTER PRIOR YEAR PRIOR QUARTER FAVORABLE (UNFAVORABLE) PRIOR YEAR % to PY PRIOR QUARTER % to PRIOR QUARTER Q2 2015 Q2 2014 Q1 2015 Revenue Subscription revenue $ 3,076 $ 3,151 $ 3,129 $ (75) - 2.5% $ (53) - 1.7% Advertising revenue 113 299 57 (186) - 62.3% 56 98.5% Total Revenue 3,189 3,450 3,186 (261) - 7.7% 3 0.1% Costs and expenses Programming, hosting and tech expense 477 670 527 192 40.3% 49 10.4% Compensation expense 777 865 737 88 11.3% (41) - 5.2% Professional fees 177 263 235 86 48.7% 58 32.8% Advertising and marketing expense 1,338 1,111 1,726 (227) - 17.0% 388 29.0% General and administrative 658 796 945 138 21.0% 287 43.7% Total Costs and Expenses 3,427 3,704 4,169 277 8.1% 742 21.7% (Loss) Income from Operations (238) (254) (983) 16 - 4.4% 744 - 75.7% Interest income (expense), net (431) (6) (236) (425) 7619.8% (194) 82.2% Gain on fair valuation of derivatives 410 - - 410 N/A 410 N/A Net (Loss) Income $ (259) $ (260) $ (1,219) $ 1 159.3% $ 960 - 78.8% Adjusted EBITDA $ 73 $ 62 $ (612) $ 12 15.9% $ 686 - 112.0%
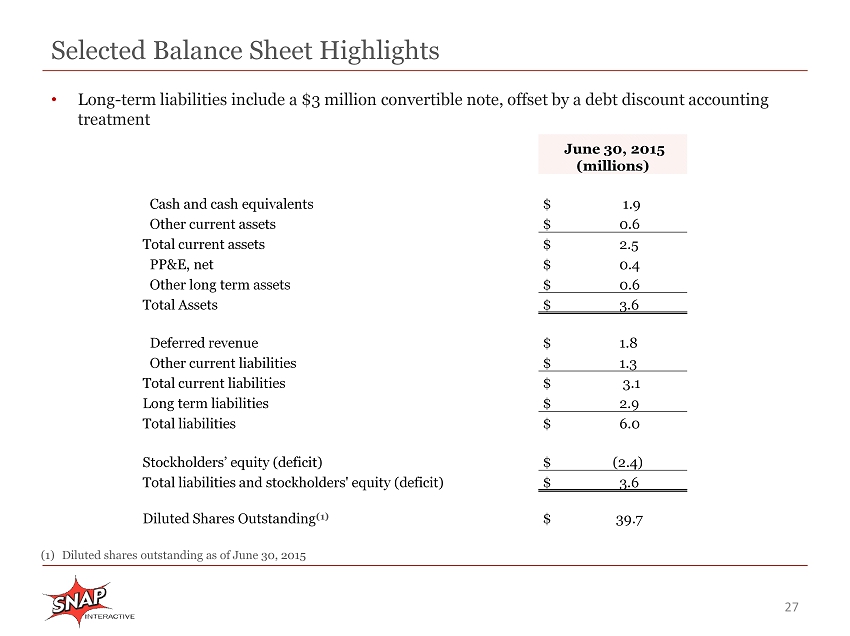
Selected Balance Sheet Highlights 27 (1) Diluted shares outstanding as of June 30, 2015 June 30, 2015 (millions) Cash and cash equivalents $ 1.9 Other current assets $ 0.6 Total current assets $ 2.5 PP&E, net $ 0.4 Other long term assets $ 0.6 Total Assets $ 3.6 Deferred revenue $ 1.8 Other current liabilities $ 1.3 Total current liabilities $ 3.1 Long term liabilities $ 2.9 Total liabilities $ 6.0 Stockholders’ equity (deficit) $ (2.4) Total liabilities and stockholders' equity (deficit) $ 3.6 Diluted Shares Outstanding (1) $ 39.7 • Long - term liabilities include a $3 million convertible note, offset by a debt discount accounting treatment
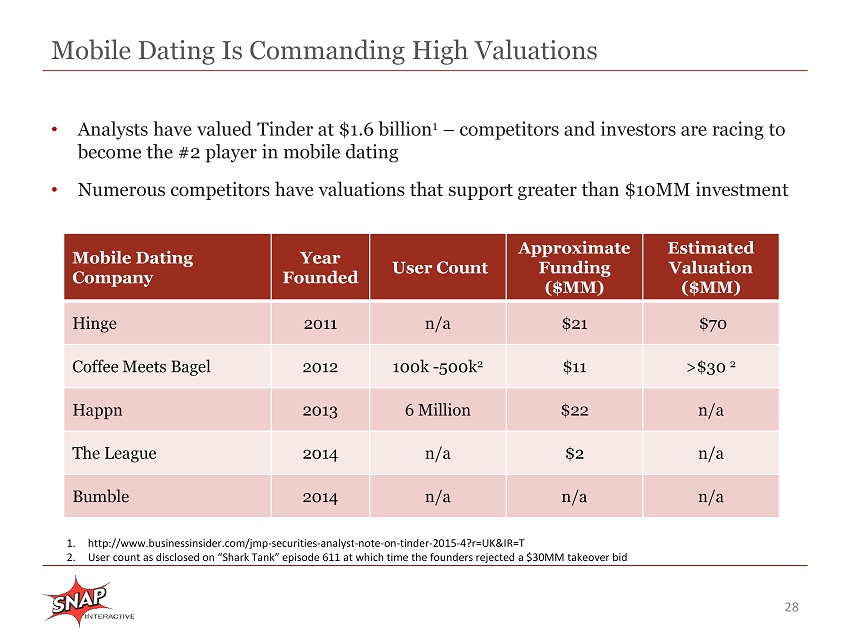
Mobile Dating Is Commanding High Valuations 28 Mobile Dating Company Year Founded User Count Approximate Funding ($MM) Estimated Valuation ($MM) Hinge 2011 n/a $21 $70 Coffee Meets Bagel 2012 100k - 500k 2 $11 >$30 2 Happn 2013 6 Million $22 n/a The League 2014 n/a $2 n/a Bumble 2014 n/a n/a n/a • Analysts have valued Tinder at $1.6 billion 1 – competitors and investors are racing to become the #2 player in mobile dating • Numerous competitors have valuations that support greater than $10MM investment 1. http :// www.businessinsider.com/jmp - securities - analyst - note - on - tinder - 2015 - 4?r=UK&IR=T 2. User count as disclosed on “Shark Tank” episode 611 at which time the founders rejected a $30MM takeover bid
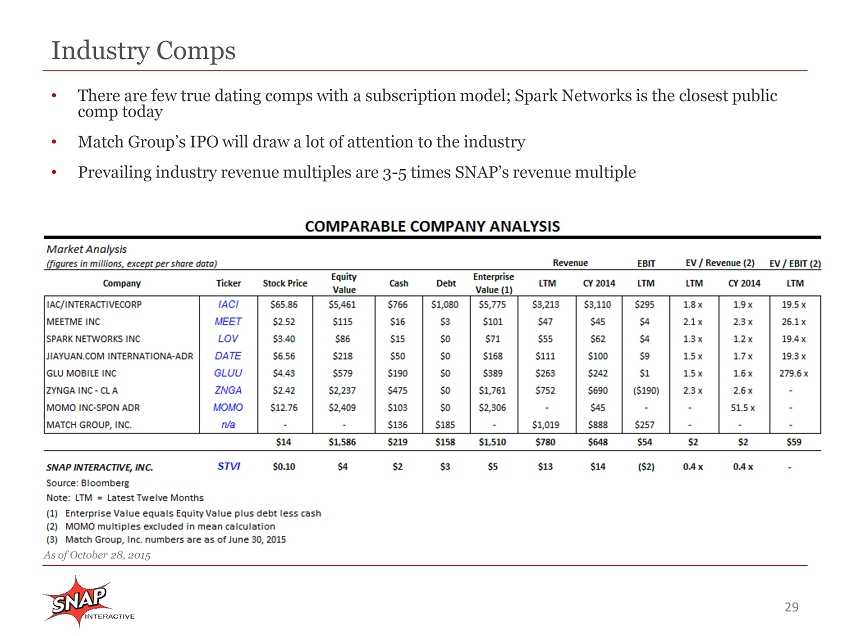
Industry Comps 29 • There are few true dating comps with a subscription model; Spark Networks is the closest public comp today • Match Group’s IPO will draw a lot of attention to the industry • Prevailing industry revenue multiples are 3 - 5 times SNAP’s revenue multiple • Peer companies trade at more than 3x Snap’s revenue multiple As of October 28, 2015
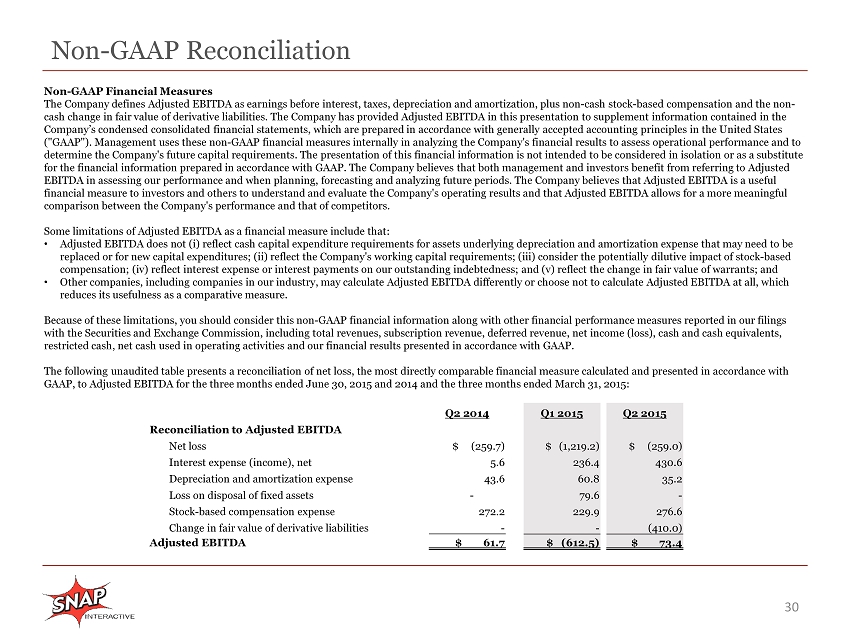
Non - GAAP Reconciliation 30 Q2 2014 Q1 2015 Q2 2015 Reconciliation to Adjusted EBITDA Net loss $ (259.7) $ (1,219.2) $ (259.0) Interest expense (income), net 5.6 236.4 430.6 Depreciation and amortization expense 43.6 60.8 35.2 Loss on disposal of fixed assets - 79.6 - Stock - based compensation expense 272.2 229.9 276.6 Change in fair value of derivative liabilities - - (410.0) Adjusted EBITDA $ 61.7 $ (612.5) $ 73.4 Non - GAAP Financial Measures The Company defines Adjusted EBITDA as earnings before interest, taxes, depreciation and amortization, plus non - cash stock - based compensation and the non - cash change in fair value of derivative
liabilities. The Company has provided Adjusted EBITDA in this presentation to supplem ent information contained in the Company’s condensed consolidated financial statements, which are prepared in accordance with generally accepted accounting pr inc iples in the United States ("GAAP"). Management uses these non - GAAP financial measures internally in analyzing the Company's financial results to assess op erational performance and to determine the Company's future capital requirements. The presentation of this financial information is not intended to be con sid ered in isolation or as a substitute for the financial information prepared in accordance with GAAP. The Company believes that both management and investors benef it from referring to Adjusted EBITDA in assessing our performance and when planning, forecasting and analyzing future periods. The Company believes that Ad jus ted EBITDA is a useful financial measure to investors and others to understand and evaluate the Company's operating results and that Adjusted EBITDA al lows for a more meaningful comparison between the Company's performance and that of competitors . Some limitations of Adjusted EBITDA as a financial measure include that: • Adjusted EBITDA does not ( i ) reflect cash capital expenditure requirements for assets underlying depreciation and amortization expense that may need to be replaced or for new capital expenditures; (ii) reflect the Company's working capital requirements; (iii) consider the potenti all y dilutive impact of stock - based compensation; (iv) reflect interest expense or interest payments on our outstanding indebtedness; and (v) reflect the change in fair value of warrants; and • Other companies, including companies in our industry, may calculate Adjusted EBITDA differently or choose not to calculate Ad jus ted EBITDA at all, which reduces its usefulness as a comparative measure . Because of these limitations, you should consider this non - GAAP financial information along with other financial performance mea sures reported in our filings with the Securities and Exchange Commission, including total revenues, subscription revenue, deferred revenue, net income (lo ss) , cash and cash equivalents, restricted cash, net cash used in operating activities and our financial results presented in accordance with GAAP . The following unaudited table presents a reconciliation of net loss, the most directly comparable financial measure calculate d a nd presented in accordance with GAAP, to Adjusted EBITDA for the three months ended June 30, 2015 and 2014 and the three months ended March 31, 2015: