Attached files
| file | filename |
|---|---|
| EX-99.1 - EX-99.1 - SunGard | d60339dex991.htm |
| 8-K - FORM 8-K - SunGard | d60339d8k.htm |
 Second
Quarter 2015 Earnings Call Supplemental Materials
July 30, 2015 Exhibit 99.2 |
 2 Forward Looking Statement SunGard’s "Safe Harbor" Statement under Private Securities Litigation Reform Act of 1995
This presentation and other written and oral statements made from time to time by
representatives of SunGard may constitute forward-looking
statements. You can identify forward-looking statements because they contain words such as "believes," "expects," "may," "will," "would," "should," "seeks,"
"approximately," "intends," "plans," "estimates," or "anticipates" or similar expressions which concern our strategy, plans or intentions. All statements we make relating to estimated and
projected earnings, margins, costs, expenditures, cash flows, growth rates, financial
results and pro forma estimates are forward-looking statements.
In addition, we, through our senior management, from time to time make forward-looking public statements concerning our expected future operations and performance and other developments. All of these forward-
looking statements are subject to risks and uncertainties that may change at any time,
and, therefore, our actual results may differ materially from those we
expected. We derive most of our forward-looking statements from our operating budgets and forecasts, which are based upon many detailed assumptions. While we believe that our assumptions are reasonable, we
caution that it is very difficult to predict the impact of known factors, and, of
course, it is impossible for us to anticipate all factors that could
affect our actual results. Some of the factors that we believe could affect our results include: global economic and market conditions; the condition of the financial services industry, including the effect of any further
consolidation among financial services firms; our high degree of debt-related
leverage; the effect of war, terrorism, natural disasters
or other catastrophic events; the effect of disruptions to our systems and infrastructure; the timing and magnitude of software sales; the timing and scope of technological advances; the market and credit risks associated with broker/dealer
operations; the ability to retain and attract customers and key personnel; risks
relating to the foreign countries where we transact business; the integration and performance of acquired businesses; the ability to obtain patent protection and avoid
patent-related liabilities in the context of a rapidly developing legal framework
for software and business-method patents; a material weakness in our
internal controls; unanticipated changes in our income tax provision or the enactment of new tax legislation, issuance of regulations or relevant judicial decisions, and the split-off of the Availability Services business failing
to qualify as a tax free transaction. The factors described in this paragraph and other factors that may affect our business or future financial results are discussed in our periodic filings with the U.S. Securities and Exchange Commission, copies of
which may be obtained from us without charge. We assume no obligation to update
any written or oral forward-looking statement made by us or on our
behalf as a result of new information, future events or other factors. |
 3 Second Quarter 2015 Financial Highlights $687 million of Revenue up 2% year over year up 6% adjusted for currency $108 million of Operating Income Margin of 15.9% Up 43% year over year, or up $31M $33 million of GAAP Income Margin of 4.9% Up $30M year over year $178 million of Adjusted EBITDA* Up 12% year over year Margin of 26.0%, up 2.3 points $127 million of Free Cash Flow* YTD Up $99 million year over year 2Q Free cash flow of $1M, up $31M year over year* *Refer to Appendix for reconciliation of GAAP to non-GAAP items and a description of non-GAAP financial measures.
|
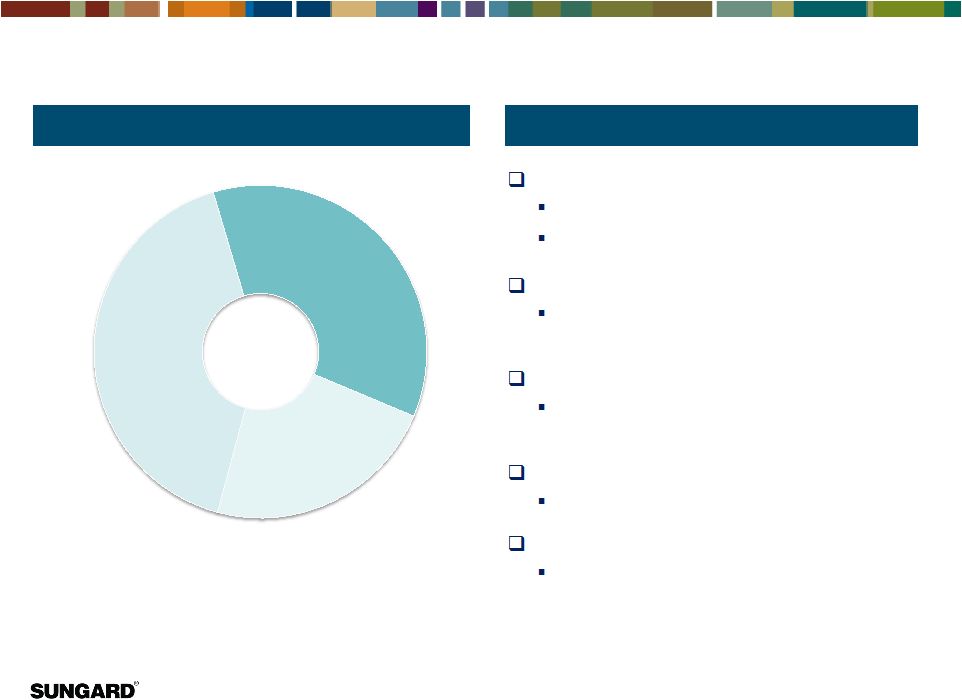
 4 Revenue Business model is founded on software, which is surrounded by services, resulting in strong recurring revenue streams Software is delivered both as traditional software licenses and also as SaaS offerings License offerings have traditionally been run on our customer premises but are increasingly delivered from SunGard’s cloud computing centers Professional services speed the delivery and help ensure high quality implementation Utility and Business Process as a Service (BPaaS) offerings complement our software and extend our value proposition *Services includes Professional and Business Processing Services revenues. @cc = at constant currency 2Q15 Revenue SunGard Business Model SaaS / Cloud 39% Software 38% Services* 23% 2Q 2015 Revenue: $687M +3% Growth (+7% @cc) +2% Growth (+3% @cc) +2% Growth (+7% @cc) ~70% Recurring Revenue |
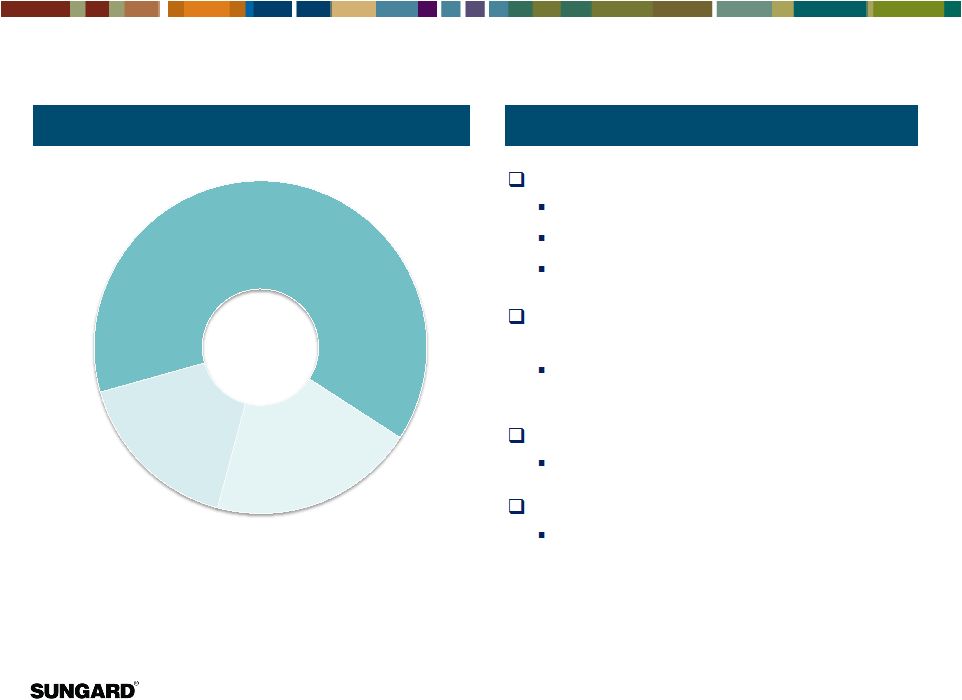
 5 Financial Systems Segment $631 million of Revenue Up 2% year over year Up 6% year over year @cc Software revenue growth of 2%, 8% @cc $50M license revenue, up 40% year over year Services revenue growth of 3%, 8% @cc New SunGard utilities for post trade processing and mutual fund transfer agency $173 million of Adjusted EBITDA** Up 13% year over year Adjusted EBITDA margin of 27.5% Up 2.6 points year over year *Services includes Professional and Business Processing Services revenue **Refer to Appendix for reconciliation of GAAP to non-GAAP items and a description of non-GAAP financial measures
@cc = at constant currency
SaaS / Cloud 41% Software 36% Services* 23% 2Q 2015 Revenue: $631M +3% Growth (+8% @cc) +2% Growth (+4% @cc) +2% Growth (+8% @cc) 2Q15 Revenue 2Q15 Highlights |
 6 Public Sector & Education Segment $56 million of Revenue Up 2% year over year, up 2% @cc Software growth of 3% year over year Services growth of 5% year over year CRW Systems, Inc. acquisition announced June 12, 2015 Tuck in acquisition to augment community development $17 million of Adjusted EBITDA** Down 1% year over year Adjusted EBITDA margin of 30.1% Down 1.2 points year over year *Services includes Professional and Business Processing Services revenue **Refer to Appendix for reconciliation of GAAP to non-GAAP items and a description of non-GAAP financial measures
@cc = at constant currency
SaaS / Cloud 17% Software 63% Services* 20% 2Q 2015 Revenue: $56M 5% Growth Flat YTY 3% Growth 2Q15 Revenue 2Q15 Highlights |
 7 Cash Flow, Debt and Leverage $182 million in cash from continuing operations Up $96 million year over year $55 million in capital expenditures Down $3 million year over year $127 million in Free Cash Flow Up $99 million year over year Leverage Ratio at 6/30/15 of 4.95x 0.46x lower since 12/31/14 ($ in millions) June 30, June 30, 2014 2015 YTY Cash flow from Cont. Operations 86 182 96 Less: Capital Expenditures* (58) (55) 3 Free Cash Flow 28 127 99 Change Dec. 31, June 30, from Dec. 2014 2015 to June Gross Debt 4,669 4,672 3 Less: Cash 447 538 91 Net Debt 4,222 4,134 (88) LTM Adjusted EBITDA** 764 817 7% Leverage** 5.41x 4.95x (0.46x) Six Months Ended *Capital Expenditures equals cash paid for property, equipment and software **Per Senior Secured Credit Agreement; Refer to Appendix for reconciliation of GAAP to non-GAAP items and a description of non-GAAP
financial measures First Half 2015 |
 8 Appendix |
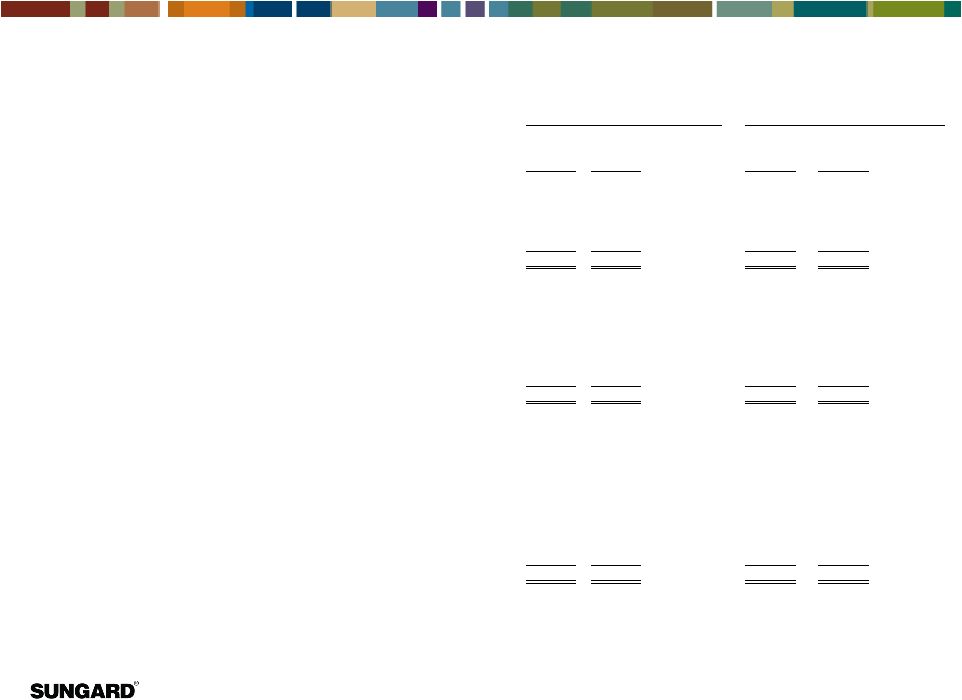 9 Reconciliation of Adjusted EBITDA to Net Income (Loss), (1 of 2) All amounts in USD millions We evaluate the performance of our segments using non-GAAP measures. Our primary non-GAAP measure is Adjusted EBITDA, whose corresponding GAAP measure is net income (loss). We believe Adjusted EBITDA is an effective tool to measure our operating performance since it excludes non-cash items and certain variable charges. We use Adjusted EBITDA extensively to measure both SunGard Data Systems and its reportable segments within the Company, and also to report our results to our board of directors. While Adjusted EBITDA is useful for analysis purposes, it should not be considered as an alternative to our reported GAAP results. Also, Adjusted EBITDA may not be comparable to similarly titled measures used by other companies. Adjusted EBITDA is similar, but not identical, to adjusted EBITDA per the Senior Secured Credit Agreement for purposes of our debt covenants. (in millions) 2014 2015 2014 2015 Financial Systems segment Revenue: Software 222 $ 227 $ 2 % 439 $ 445 $ 1 % SaaS and Cloud 256 260 2 % 515 528 3 % Services 140 144 3 % 264 275 4 % Total Revenue 618 $ 631 $ 2 % 1,218 $ 1,248 $ 3 % Adjusted EBITDA 154 $ 173 $ 13 % 293 $ 347 $ 19 % Adjusted EBITDA margin 24.8% 27.5% 2.6 pts 24.0% 27.8% 3.8 pts Public Sector & Education segment Revenue: Software 35 $ 35 $ 3 % 69 $ 69 $ 1 % SaaS and Cloud 9 10 - % 18 19 1 % Services 11 11 5 % 21 22 5 % Total Revenue 55 $ 56 $ 2 % 108 $ 110 $ 2 % Adjusted EBITDA 17 $ 17 $ (1) % 33 $ 33 $ (1) % Adjusted EBITDA margin 31.3% 30.1% (1.2) pts 30.7% 29.8% (0.9) pts Corporate Adjusted EBITDA (12) $ (12) $ (22) $ (27) $ Total Revenue: Software 257 $ 262 $ 2 % 508 $ 514 $ 1 % SaaS and Cloud 265 270 2 % 533 547 3 % Services 151 155 3 % 285 297 4 % Total Revenue 673 $ 687 $ 2 % 1,326 $ 1,358 $ 2 % Adjusted EBITDA 159 $ 178 $ 12 % 304 $ 353 $ 16 % Adjusted EBITDA margin 23.7% 26.0% 2.3 pts 23.0% 26.0% 3.0 pts pts = margin points Three Months Ended June 30, change from prior year change from prior year Six Months Ended June 30, |
 10 Reconciliation of Adjusted EBITDA to Net Income (Loss), (2 of 2) All amounts in USD millions We evaluate the performance of our segments using non-GAAP measures. Our primary non-GAAP measure is Adjusted EBITDA, whose corresponding GAAP measure is net income (loss). We believe Adjusted EBITDA is an effective tool to measure our operating performance since it excludes non-cash items and certain variable charges. We use Adjusted EBITDA extensively to measure both SunGard Data Systems and its reportable segments within the Company, and also to report our results to our board of directors. While Adjusted EBITDA is useful for analysis purposes, it should not be considered as an alternative to our reported GAAP results. Also, Adjusted EBITDA may not be comparable to similarly titled measures used by other companies. Adjusted EBITDA is similar, but not identical, to adjusted EBITDA per the Senior Secured Credit Agreement for purposes of our debt covenants. 2014 2015 2014 2015 Financial Systems segment 154 $ 173 $ 293 $ 347 $ Public Sector & Education segment 17 17 33 33 Corporate (12) (12) (22) (27) Total Adjusted EBITDA 159 178 304 353 Depreciation (27) (27) (51) (56) Amortization of acquisition-related intangible assets (41) (21) (84) (42) Trade name impairment charge - - (339) - Restructuring charges (2) (2) (7) (4) Stock compensation expense (11) (13) (20) (23) Management fees (1) (2) (3) (4) Other, net - (5) (12) (1) Total operating income (loss) 77 108 43 % (212) 223 205 % Operating income margin 11.4 % 15.9 % (16.0)% 16.5 % Interest income 1 1 1 1 Interest expense and amortization of deferred financing fees (73) (71) (147) (142) Loss on extinguishment of debt - - (61) - Other income - 1 - 1 Benefit from (provision for) income taxes (2) (6) 99 (24) Income (loss) from discontinued operations, net of tax - - (17) 2 Net income (loss) 3 $ 33 $ (337) $ 61 $ change from prior year change from prior year Three Months Ended June 30, Six Months Ended June 30, |
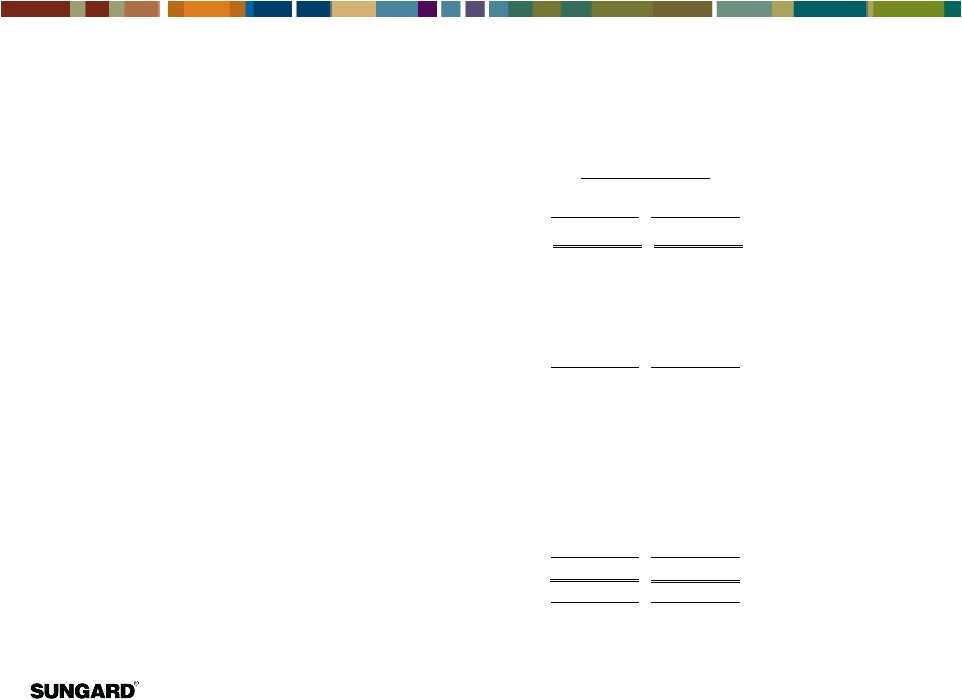 11 Reconciliation of Income (Loss) from Continuing Operations to EBITDA and Reconciliation of EBITDA to Adjusted EBITDA as defined in our senior secured credit agreement Dec. 31, June 30, (in millions) 2014 2015 Total Revenue 2,809 $ 2,824 $ GAAP Income / (Loss) from continuing operations (207) $ 172 $ Interest expense, net 290 285 Provision for income taxes (57) 66 Depreciation 107 112 Amortization of acquisition-related intangible assets 136 94 EBITDA 269 729 Trade name impairment charge 339 - Purchase accounting adjustments 1 1 Stock compensation expense 42 44 Restructuring charges 27 25 Management fees 9 9 Acquired EBITDA, net of disposed EBITDA - 2 Other costs 16 7 Loss on extinguishment of debt 61 - Adjusted EBITDA - per Senior Secured Credit Agreement 764 $ 817 $ Adjusted EBITDA margin 27.2% 28.9% Twelve Months Ended |
 12 Reconciliation of Cash flow from Continuing Operations to Free Cash Flow ($ in millions) June 30, June 30, June 30, June 30, 2014 2015 YTY 2014 2015 YTY Cash flow from Cont. Operations 0 28 28 86 182 96 Less: Capital Expenditures* (30) (27) 3 (58) (55) 3 Free Cash Flow -30 1 31 28 127 99 Six Months Ended 2Q Ended *Capital Expenditures equals cash paid for property, equipment and software |