Attached files
| file | filename |
|---|---|
| 8-K - FORM 8-K - ARMSTRONG WORLD INDUSTRIES INC | d33276d8k.htm |
| EX-99.1 - EX-99.1 - ARMSTRONG WORLD INDUSTRIES INC | d33276dex991.htm |
 Earnings Call Presentation 2 nd Quarter 2015 July 30, 2015 Exhibit 99.2 |
 2 Our disclosures in this presentation, including without limitation, those relating to future financial results
guidance and the possible separation of our flooring business from our building
products business, and in our other public documents and comments contain
forward-looking statements within the meaning of the Private
Securities Litigation Reform Act. Those statements provide our future
expectations or forecasts and can be identified by our use of words such
as "anticipate," "estimate," "expect," "project," "intend," "plan," "believe," "outlook," "target," "predict," "may," "will," "would," "could," "should,"
"seek," and other words or phrases of similar meaning in
connection with any discussion of future operating or financial performance or the separation of our businesses. Forward-looking statements, by their nature, address matters that are uncertain and involve
risks because they relate to events and depend on circumstances that may or may not
occur in the future. As a result, our actual results may differ
materially from our expected results and from those expressed in our
forward-looking statements. A more detailed discussion of the risks and
uncertainties that may affect our ability to achieve the projected
performance is included in the “Risk Factors” and “Management’s Discussion and Analysis” sections of our reports on Forms 10-K and 10-Q filed with the SEC. Forward-looking statements speak
only as of the date they are made. We undertake no obligation to update any
forward-looking statements beyond what is required under applicable
securities law. In addition, we will be referring to non-GAAP
financial measures within the meaning of SEC Regulation G. A
reconciliation of the differences between these measures with the most directly
comparable financial measures calculated in accordance with GAAP are
included within this presentation and available on the Investor
Relations page of our website at www.armstrong.com.
The guidance in this presentation is only effective as of the date given, July 30,
2015, and will not be updated or affirmed unless and until we publicly
announce updated or affirmed guidance. Safe Harbor
Statement 2 |
 3 All figures throughout the presentation are in $ millions unless otherwise noted. Figures may not add due to rounding.
• When reporting our financial results within this presentation, we make several adjustments.
Management uses the non-GAAP measures below in managing the business and believes
the adjustments provide meaningful comparisons of operating performance
between periods. As reported results will be footnoted throughout
the presentation. Basis of Presentation Explanation
• We report in comparable dollars to remove the effects of currency translation on the P&L. The budgeted exchange rate for 2015 is used for all currency translations in 2015 and prior years. Guidance is presented using the 2015 budgeted exchange rate for the year. • We remove the impact of discrete expenses and income. Examples include plant closures, restructuring actions, separation costs and other large unusual items. We also remove the non- cash impact of our U.S. Pension Plan. • Taxes for normalized Net Income and EPS are calculated using a constant 39% for 2015 guidance, and 2015 and 2014 results, which are based on the expected full year historical tax rate. What Items Are Adjusted Comparable Dollars Other Adjustments Net Sales Yes No Gross Profit Yes Yes SG&A Expense Yes Yes Equity Earnings Yes Yes Operating Income Yes Yes Net Income Yes Yes Cash Flow No No Return on Capital Yes Yes EBITDA Yes Yes |
 4 Key Metrics – Second Quarter 2015 (1) As reported Net Sales: $633 million in 2015 and $659 million in 2014 (2) As reported Operating Income: $63 million in 2015 and $64 million in 2014 (3) As reported EPS: $0.53 in 2015 and $0.48 in 2014 (4) Unadjusted 2015 2014 Variance Net Sales (1) $649 $652 (0.4%) Operating Income (2) 82 73 13.1% % of Sales 12.7% 11.2% 150 bps EBITDA 112 104 7.7% % of Sales 17.2% 15.9% 130 bps Earnings Per Share (3) $0.81 $0.66 22.5% Free Cash Flow 77 9 Favorable Net Debt 823 963 (140) ROIC (4) 6.6% 8.4% (180 bps) |
 5 Second Quarter 2015 vs. PY– Adjusted EBITDA to Reported Net Income 2015 2014 V EBITDA– Adjusted $112 $104 $8 Depreciation and Amortization (30) (31) 1 Operating Income – Adjusted $82 $73 $9 Non-cash Impact of U.S. Pension 6 - 6 Separation Expenses 5 - 5 Multilayered Wood Flooring Duty 4 - 4 Cost Reduction Initiatives - 7 (7) Impairment - 1 (1) Foreign Exchange Movements 4 1 3 Operating Income – As Reported $63 $64 ($1) Interest/Other (Expense) (8) (13) 5 EBT $55 $51 $4 Tax (Expense) (25) (24) (1) Net Income $30 $27 $3 |
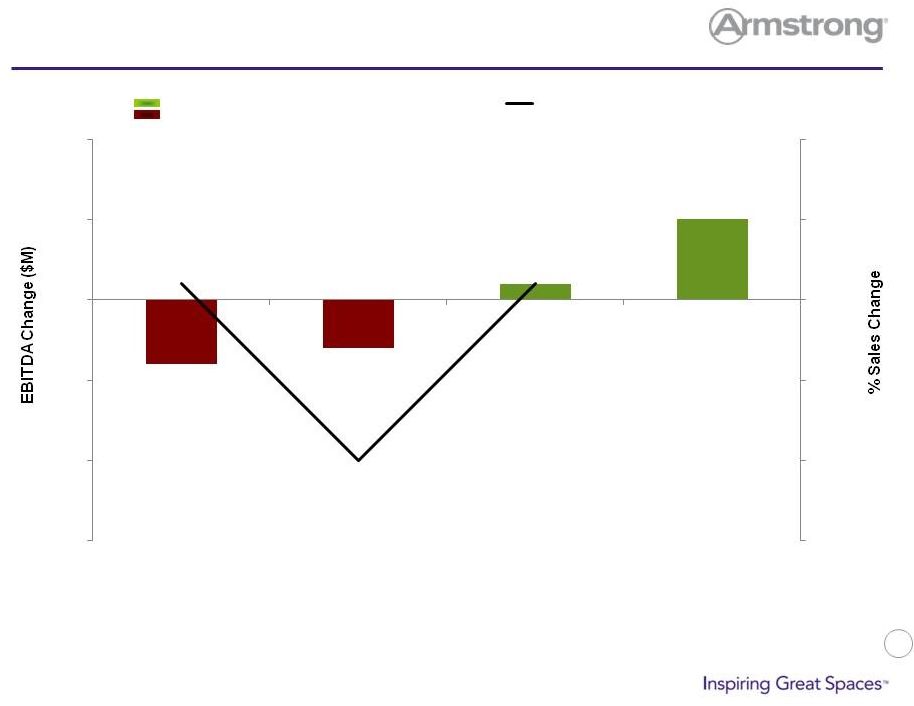
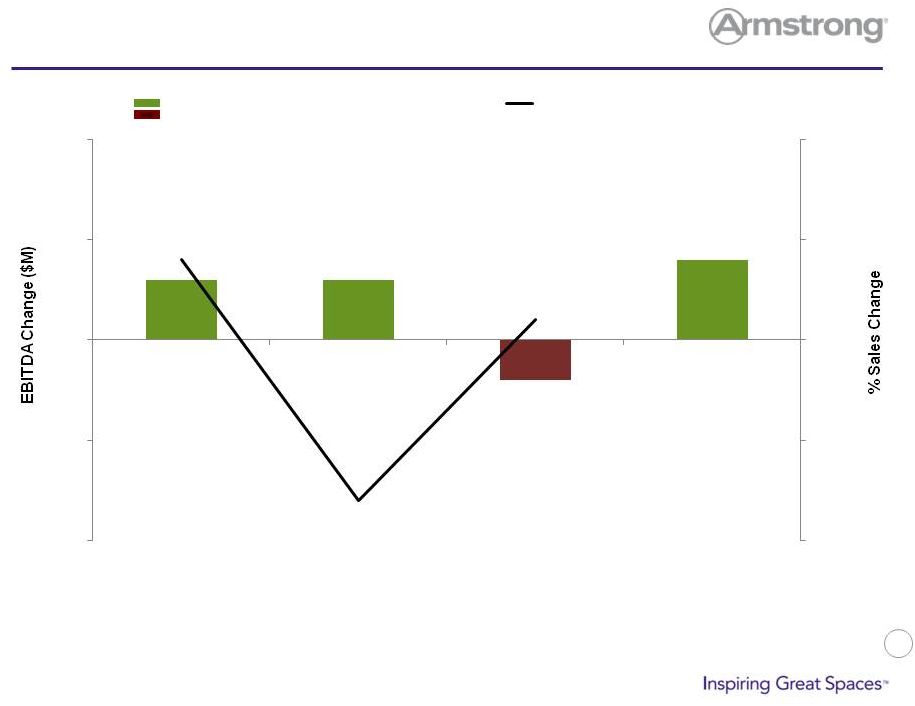 6 Second Quarter Sales and EBITDA by Segment – 2015 vs. Prior Year 3 3 (2) 4 4% (8%) 1% (10%) (5%) 0% 5% 10% (10) (5) - 5 10 Resilient Flooring Wood Flooring Building Products Corporate EBITDA Change (Left -hand scale) % Change in Sales (Right-hand scale) |
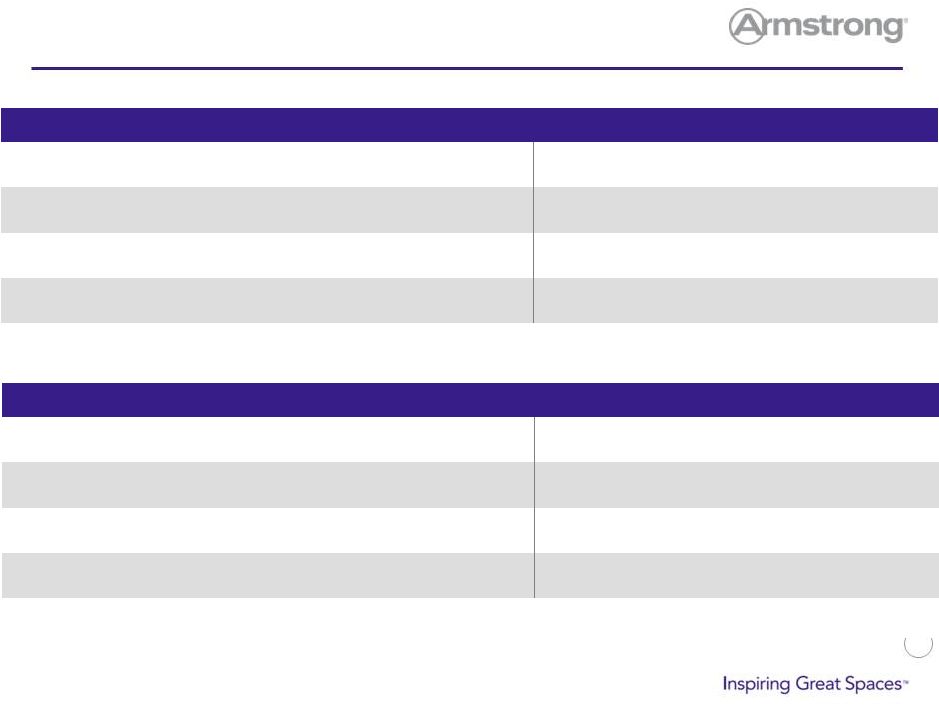
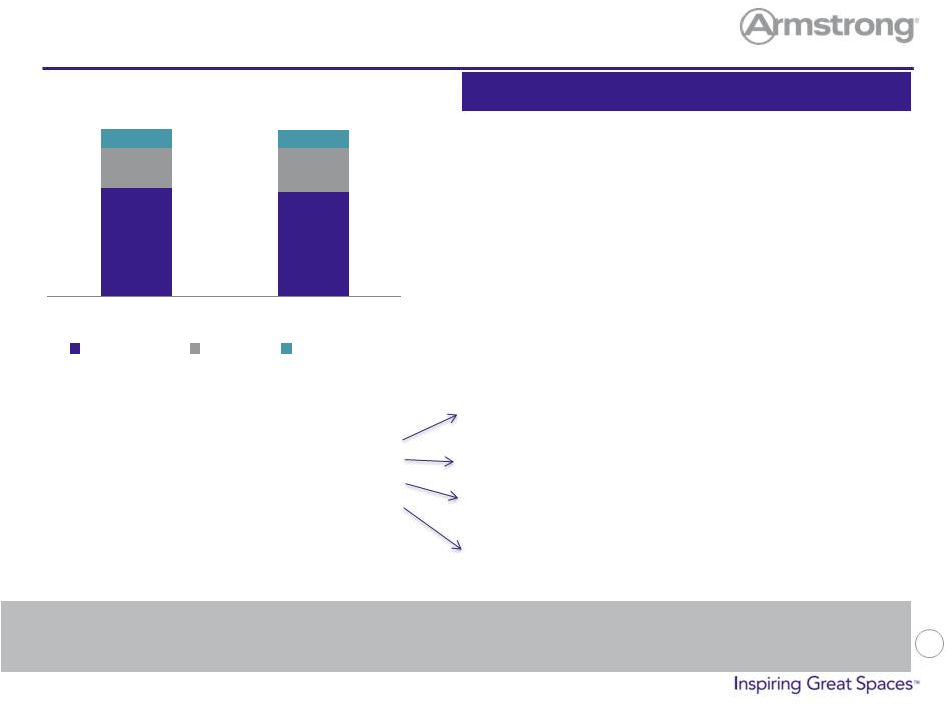 7 • On a comparable foreign exchange basis sales increased slightly as favorable price and mix performance offset volume declines predominantly in EMEA markets • Reflects impact of prior price increases and continued strong mix performance • Driven by lower volumes in EMEA and the Americas • Reflects the benefit of lower freight costs and productivity in the Americas • Driven by inflation and higher marketing collateral expense Building Products Second Quarter Results Volume declines and higher SG&A expenses pressure margins despite favorable price and mix performance $205 $198 $77 $83 $36 $35 Q2 2015 Q2 2014 Net Sales Americas EMEA Pacific Rim $318
$316 Key Highlights Q2 2014 Adjusted EBITDA $ 83M Price & Mix 6 Volume (5) Manufacturing & Input Costs 1 SG&A (3) WAVE (1) Q2 2015 Adjusted EBITDA $ 81M |
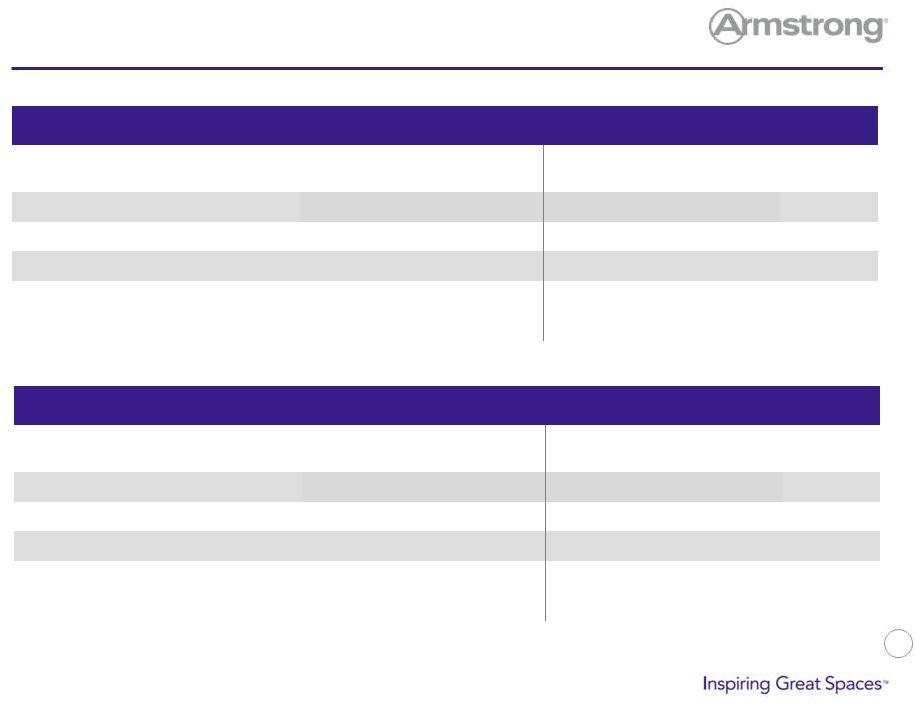
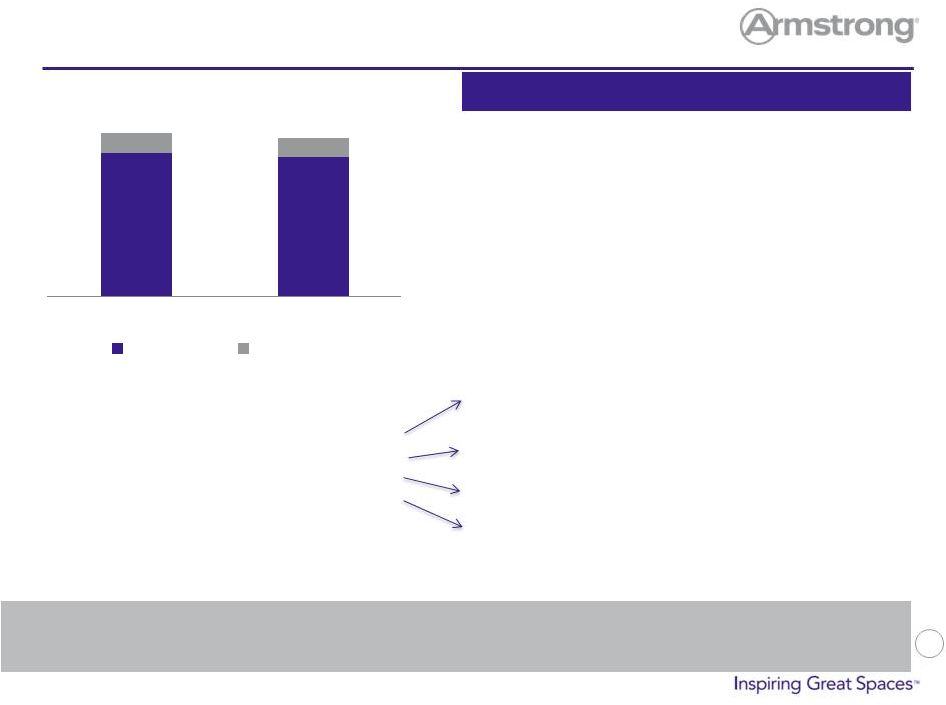 8 • Sales increased driven by strong volume growth in the Americas commercial business that was partially aided by favorable market share shifts as a result of competitive product availability issues and our service proposition relative to competition • On a comparable foreign exchange basis sales in the Pacific Rim increased slightly driven by growth in India • Driven by unfavorable price and mix performance in residential flooring in the Americas • Volume growth driven by U.S. commercial • Reflects the benefit of favorable input costs • Higher SG&A expense to support go-to-market initiatives Resilient Second Quarter Results Strong commercial volumes in the Americas and favorable input costs drive margin performance $177 $172 $26 $24 Q2 2015 Q2 2014 Net Sales Americas Pacific Rim $203
$196 Key Highlights Q2 2014 Adjusted EBITDA $ 29M Price & Mix (3) Volume 5 Manufacturing & Input Costs 8 SG&A (7) Q2 2015 Adjusted EBITDA $ 32M |
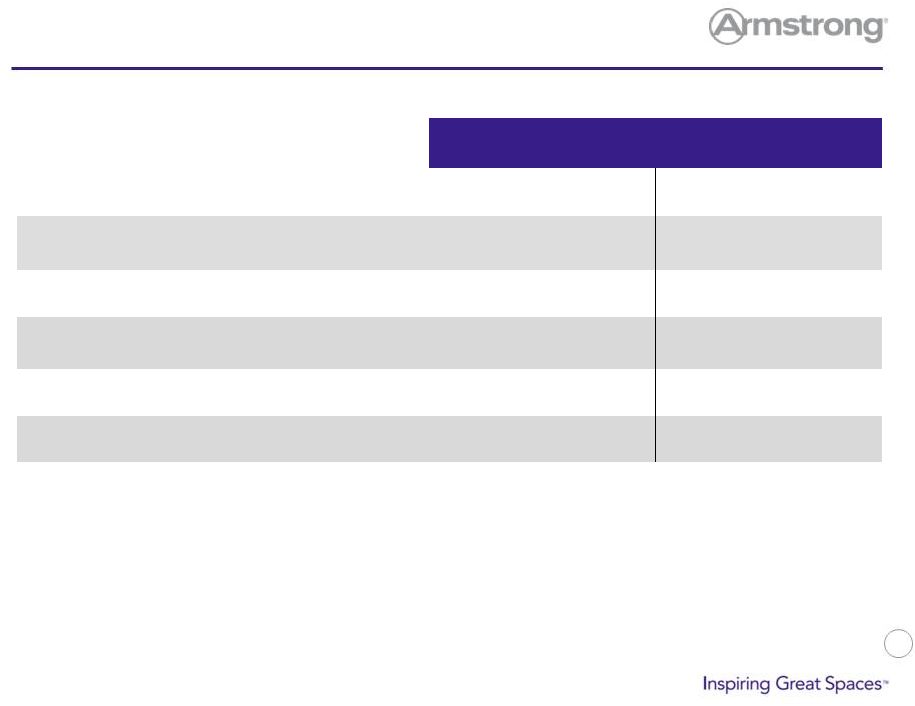
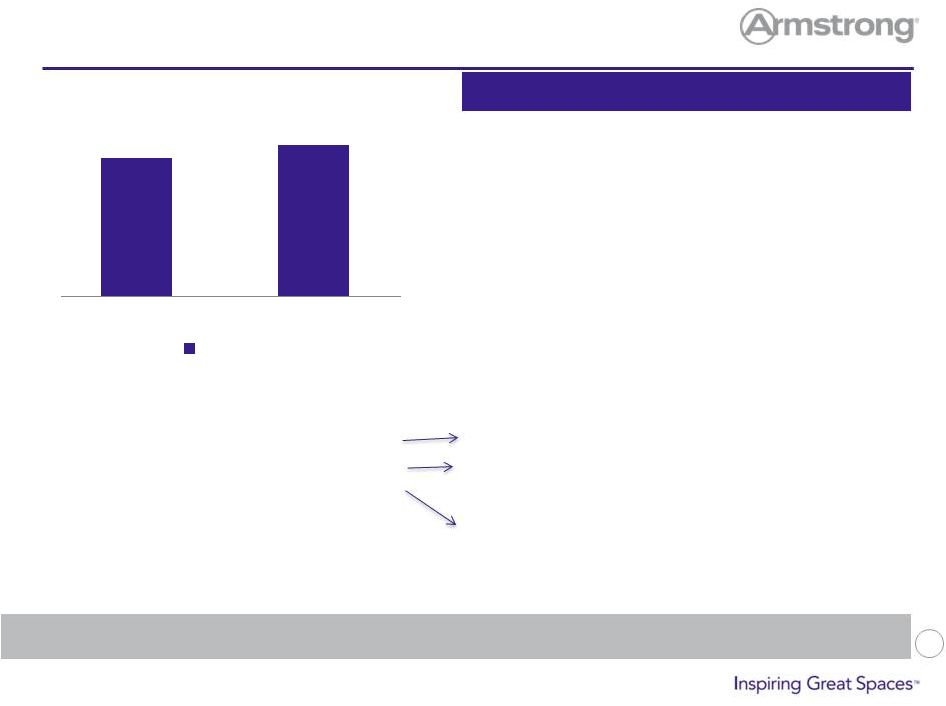 • Despite improvements in mix sales declined driven primarily by lower volumes • Volume declines were caused by market share shifts as a result of prior year price and mix optimization actions, inventory adjustments at home centers, and engineered wood product availability challenges • Driven by unfavorable price, despite mix improvement • Due to engineered wood product availability challenges and share loss at opening price points • Reflects the benefit of favorable input costs Wood Second Quarter Results Favorable input costs and manufacturing productivity drive margin improvement $128 $140 Q2 2015 Q2 2014 Net Sales Americas $128
$140 Key Highlights Q2 2014 Adjusted EBITDA $ 8M Price & Mix (1) Volume (4) Manufacturing & Input Costs 11 SG&A (1) D&A/Other (2) Q2 2015 Adjusted EBITDA $ 11M 9 |
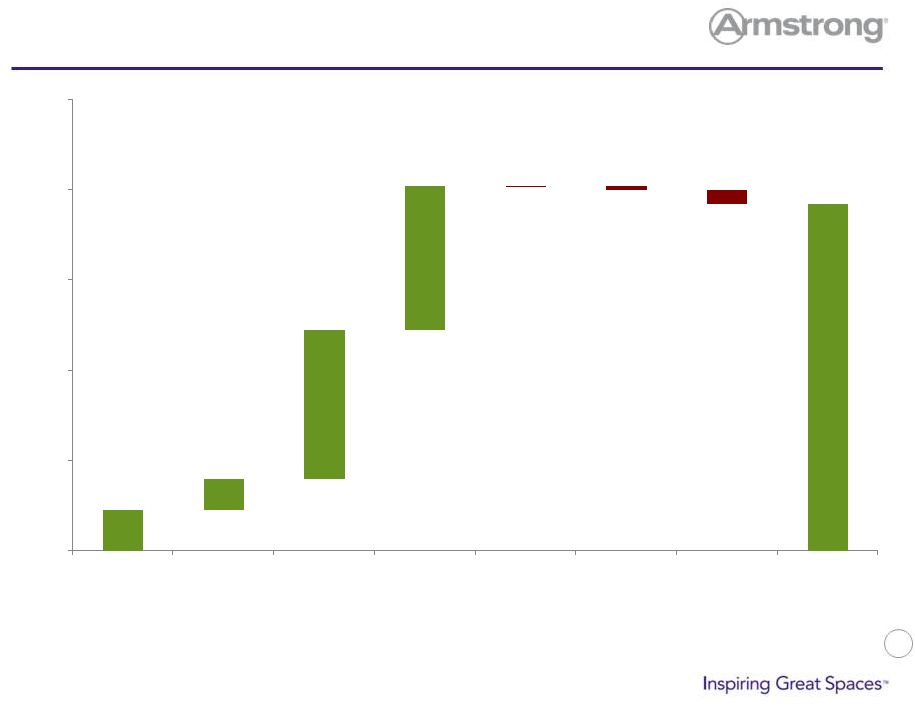
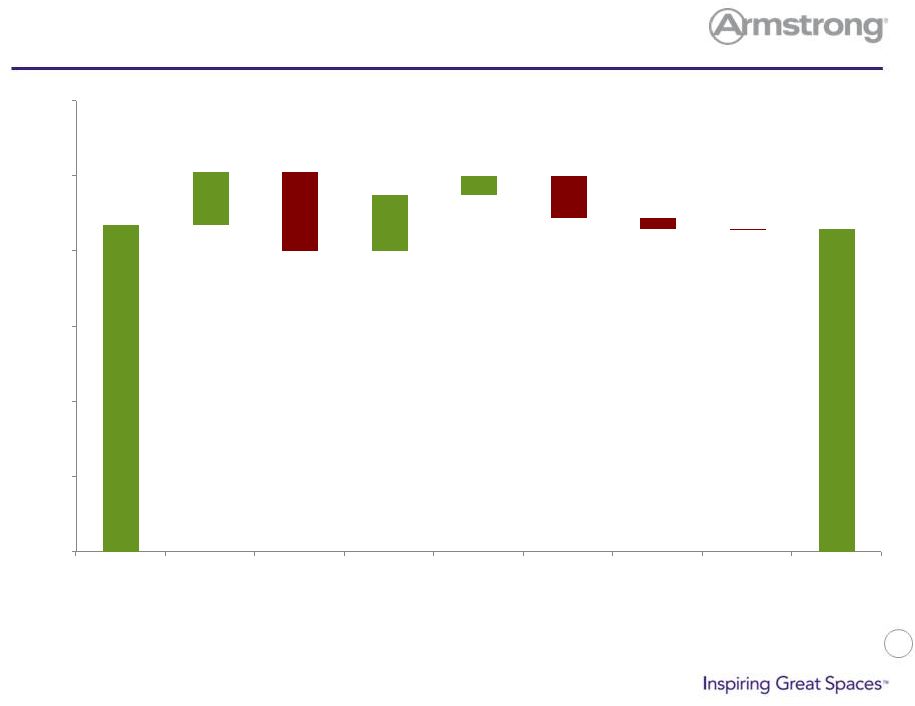
 10 $3 $17 $3 $104 $0 $20 $40 $60 $80 $100 $120 $140 2014 Price/Mix Volume Input Costs Mfg Cost SG&A WAVE Change in D&A 2015 ($1) $112 ($1) ($8) EBITDA Bridge – Second Quarter 2015 vs. Prior Year ($5) |
 11 $7 $33 $32 $0 $77 $9 $0 $20 $40 $60 $80 $100 2014 Cash Earnings Working Capital Capex Interest Expense WAVE Dividends Other 2015 ($3) ($1) Free Cash Flow – Second Quarter 2015 vs. Prior Year |
 12 Key Metrics – 1 st Half 2015 (1) As reported Net Sales: $1,184 million in 2015 and $1,249 million in 2014 (2) As reported Operating Income: $99 million in 2015 and $117 million in 2014 (3) As reported EPS: $0.60 in 2015 and $0.80 in 2014 (4) Unadjusted 2015 2014 Variance Net Sales (1) $1,214 $1,236 (1.8%) Operating Income (2) 128 128 (0.1%) % of Sales 10.5% 10.4% 10 bps EBITDA 186 187 (0.3%) % of Sales 15.4% 15.1% 30 bps Earnings Per Share (3) $1.18 $1.10 7.9% Free Cash Flow 35 (45) Favorable |
 13 (4) (3) 1 5 1% (10%) 1% (15%) (10%) (5%) 0% 5% 10% (15) (10) (5) - 5 10 Resilient Flooring Wood Flooring Building Products Corporate EBITDA Change (Left-hand scale) % Change in Sales (Right-hand scale) 1H Sales and EBITDA by Segment – 2015 vs. Prior Year
|
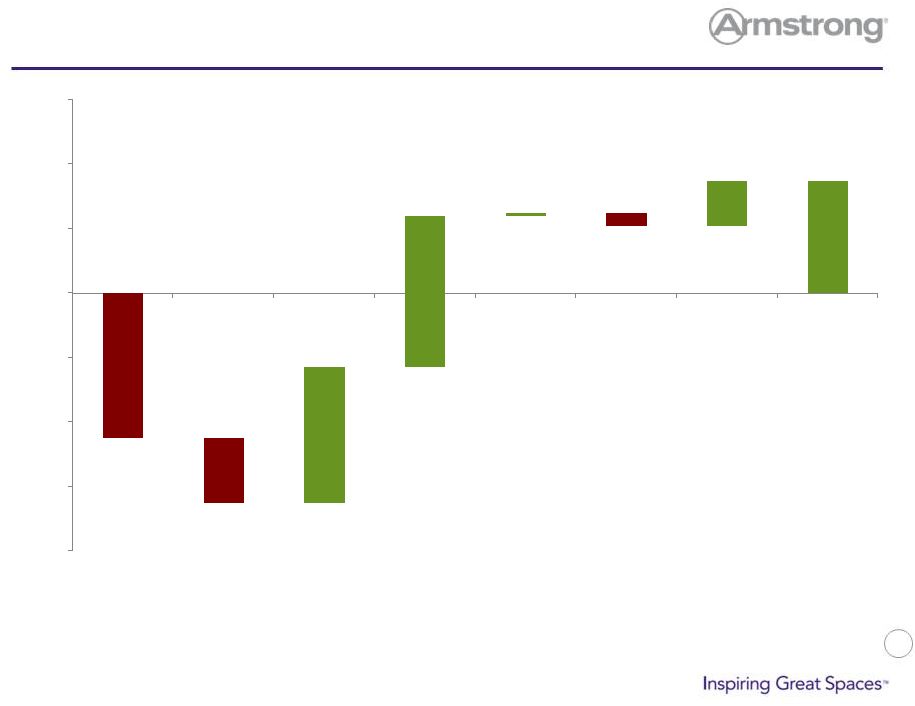
 14 $187 $100 $120 $140 $160 $180 $200 $220 2014 Price/Mix Volume Input Costs Mfg Cost SG&A WAVE Change in D&A 2015 $15 $186 ($3) ($11) EBITDA Bridge – 1H 2015 vs. Prior Year ($21) $14 $5 $0 |
 15 ($20) $42 $47 $1 ($4) $14 $35 ($45) ($80) ($60) ($40) ($20) $0 $20 $40 $60 2014 Cash Earnings Working Capital Capex Interest Expense WAVE Dividends Other 2015 Free Cash Flow – 1H 2015 vs. Prior Year |
 16 2015 Estimate Range (1) 2014 (2) Variance Net Sales (3) 2,400 to 2,500 2,515 (5%) to (1%) Operating Income (4) 235 to 265 271 (13%) to (2%) EBITDA 355 to 385 389 (9%) to (1%) Earnings Per Share (5) $2.05 to $2.35 $2.38 (14%) to (1%) Key Metrics – Guidance 2015 (1) Guidance is presented using 2015 budgeted foreign exchange rates (2) 2014 results are presented using 2015 budgeted foreign exchange rates (3) 2015 and 2014 net sales include the impact of foreign exchange (4) As reported Operating Income: $180 - $210 million in 2015 and $239 million 2014 (5) As reported earnings per share: $1.10 - $1.35 in 2015 and $1.83 in 2014 |
 17 2015 Financial Outlook Sales (1) $1,220-$1,270 million; EBITDA $335-$355 million Sales (1) $1,180-$1,230 million; EBITDA $85-$100 million EBITDA ($65) – ($70) $35 - $45 million; Adjusted long-term ETR of ~39% (2) $145 - $165 million Non-cash: $25 million US pension expense Cash: $20 - $40 million transaction costs ABP Segment* AFP Segment* Cash Taxes/ETR Capital Spending* Exclusions from EBITDA (1) Net sales include foreign exchange impact (2) As reported ETR of 53% for 2015 * Changed from April Outlook Corporate Segment |
 18 Appendix |
 19 1H 2015 vs. PY– Adjusted EBITDA to Reported Net Income 2015 2014 V EBITDA– Adjusted $186 $187 ($1) Depreciation and Amortization (58) (59) 1 Operating Income – Adjusted $128 $128 $ - Non-cash Impact of U.S. Pension 13 - 13 Separation Expenses 9 - 9 Multilayered Wood Flooring Duty 4 - 4 Cost Reduction Initiatives (1) 7 (8) Impairment - 1 (1) Foreign Exchange Movements 4 3 1 Operating Income – As Reported $99 $117 ($18) Interest/Other (Expense) (20) (28) 8 EBT $79 $89 ($10) Tax (Expense) (45) (44) (1) Net Income $34 $45 ($11) |
 20 Consolidated Results Second Quarter 2015 Reported Comparability (1) Adjustments FX (2) Adj 2015 Adjusted 2014 Reported Comparability (1) Adjustments FX (2) Adj 2014 Adjusted Net Sales 633 - 16 649 659 - (7) 652 Operating Income 63 15 4 82 64 8 1 73 EPS $0.53 $0.23 $0.05 $0.81 $0.48 $0.17 $0.01 $0.66 YTD 2015 Reported Comparability (1) Adjustments FX (2) Adj 2015 Adjusted 2014 Reported Comparability (1) Adjustments FX (2) Adj 2014 Adjusted Net Sales 1,184 - 30 1,214 1,249 - (13) 1,236 Operating Income 99 25 4 128 117 8 3 128 EPS $0.60 $0.53 $0.05 $1.18 $0.80 $0.26 $0.04 $1.10 (1) See earnings press release and 10-Q for additional detail on comparability adjustments
(2) Eliminates impact of foreign exchange movements |
 21 Segment Operating Income (Loss) Second Quarter 2015 Reported Comparability (1) Adjustments 2015 Adjusted 2014 Reported Comparability (1) Adjustments 2014 Adjusted Building Products 64 - 64 65 1 66 Resilient Flooring 23 2 25 21 2 23 Wood Flooring (2) 3 5 8 (3) 6 3 Unallocated Corporate (Expense) Income (27) 12 (15) (19) - (19) YTD 2015 Reported Comparability (1) Adjustments 2015 Adjusted 2014 Reported Comparability (1) Adjustments 2014 Adjusted Building Products 124 - 124 123 2 125 Resilient Flooring 29 1 30 31 2 33 Wood Flooring (2) 1 6 7 2 6 8 Unallocated Corporate (Expense) Income (55) 22 (33) (39) 1 (38) (1) Eliminates impact of foreign exchange movements and non-recurring items; see earnings press release and 10-Q for additional
detail. (2)
Includes a $4 million charge recorded in the second quarter of 2015 resulting from new
duty rates assigned by the U.S. Department of Commerce on multilayered wood
importers and a $1 million gain recorded in the second quarter of 2014 related to a
refund of previously paid duties on imports of engineered wood flooring. |
 22 Cash Flow Second Quarter YTD ($ millions) 2015 2014 2015 2014 Net cash from operations $93 $55 $59 $22 Net cash (used for) investing (16) (46) (24) (68) Add back (subtract) adjustments to reconcile to free cash flow Other - - - 1 Free Cash Flow $77 $9 $35 ($45) Cash flow includes cash flows attributable to the European flooring business |