Attached files
| file | filename |
|---|---|
| 8-K - 8-K - RPM INTERNATIONAL INC/DE/ | d16379d8k.htm |
| EX-99.1 - EX-99.1 - RPM INTERNATIONAL INC/DE/ | d16379dex991.htm |
 7/27/2015 RPM INTERNATIONAL INC. 1 7/27/2015 RPM INTERNATIONAL INC. 1 “Accelerating Growth Investments” NYSE Analysts Luncheon Frank C. Sullivan, Chairman & CEO July 27, 2015 Exhibit 99.2 |
 7/27/2015 RPM INTERNATIONAL INC. 2 Forward-Looking Statements & Regulation G This presentation contains “Forward-Looking Statements” as defined in the Private Securities
Litigation Reform Act of 1995. Actual results may differ materially from
expectations and are subject to certain risks and uncertainties
such as those described in RPM’s periodic reports and
statements filed with the Securities and Exchange Commission and available
through the company’s website,
www.rpminc.com. The company does not intend to update any forward- looking statements made in this presentation. This presentation includes certain company data that do not directly conform to generally
accepted accounting principles, or GAAP, and certain company data that has been
restated for improved clarity, understanding and
comparability, or pro forma. All non-GAAP data in this presentation are indicated by footnote. Tables reconciling such data with GAAP measures are
available through our website, www.rpminc.com under Investor
Information/Presentations. |
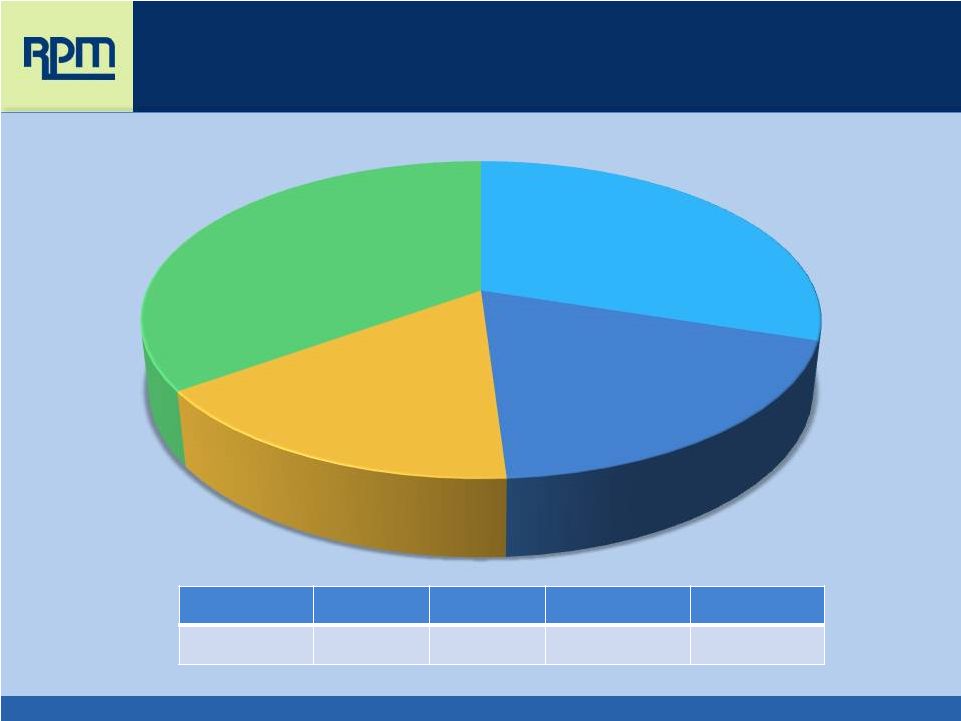
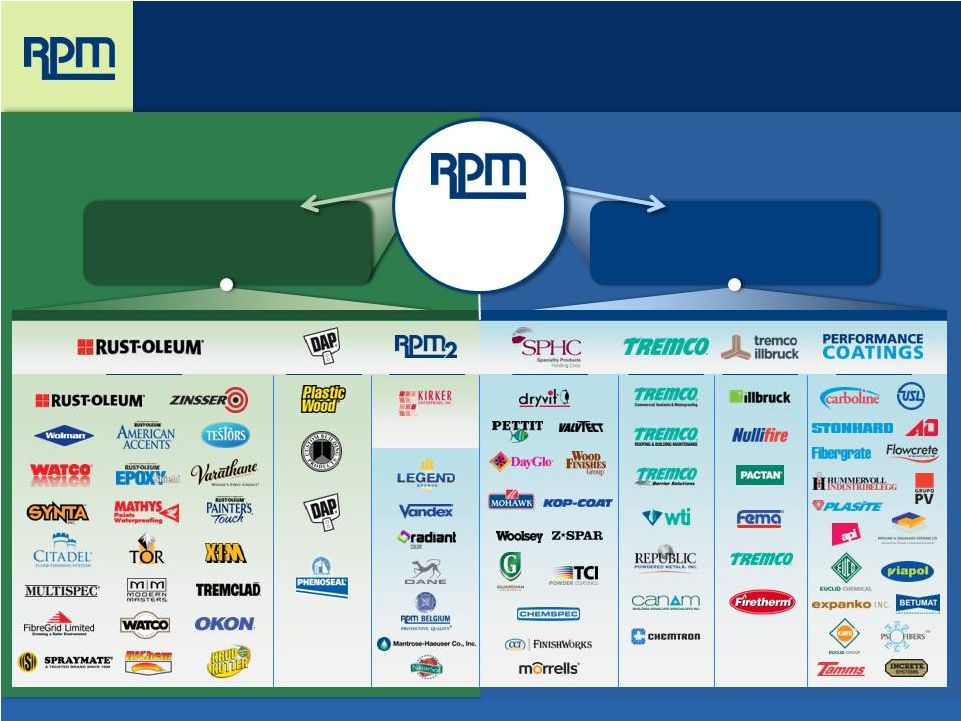 7/27/2015 RPM INTERNATIONAL INC. 3 Industrial Segment (2/3) Consumer Segment (1/3) SALES: $4.6 billion Entrepreneurial Operating Philosophy Competitive Advantage of Leading Brands Balance Between Consumer and Industrial Businesses Growth Strategy Balanced Between Internal Investment and Acquisitions |
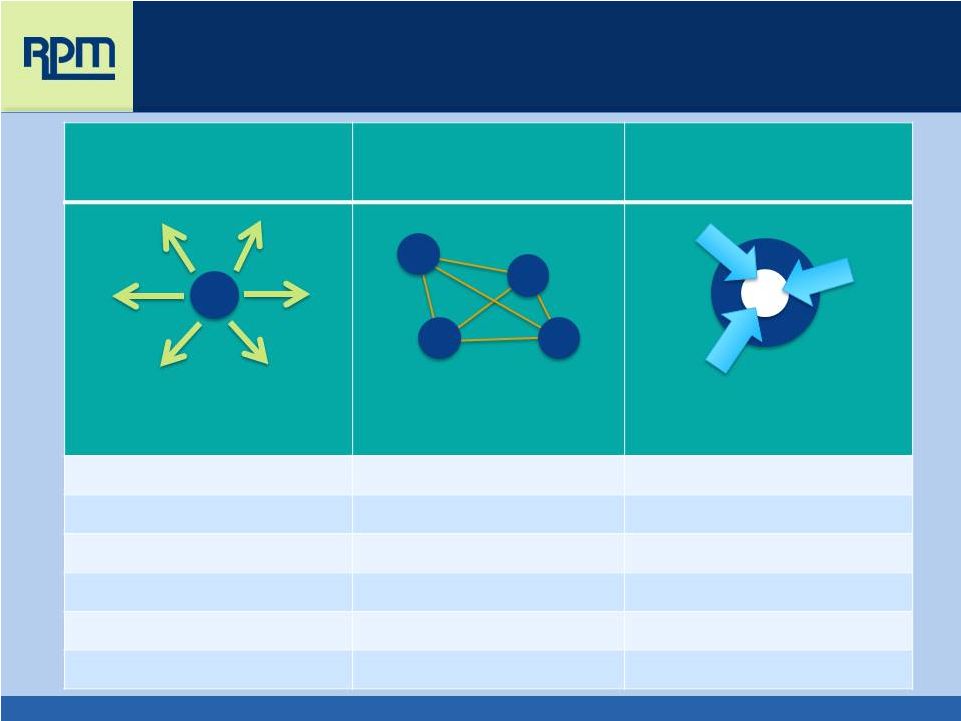 7/27/2015 RPM INTERNATIONAL INC. 4 At Operating Companies Among Operating Companies At Corporate Customer-Centric/ Market-Focused Connections Creating Value Centralized Sales Distribution Treasury Marketing Manufacturing Capital Allocation Product Development Technology Global Sourcing Customer Service Product Development Insurance & Benefits Technical Support Geographic Expansion M&A Budgeting & Planning Entrepreneurial Operating Philosophy |
 7/27/2015 RPM INTERNATIONAL INC. 5 Unique Competitive Advantage Industrial Industrial Paint & Coatings Paint & Coatings Construction Chemicals Construction Chemicals Consumer Consumer $170 billion global market |
 Deliberate Strategic Balance
Consumer Industrial Residential Construction 15% Residential Repair & Maintenance 85% Commercial & Industrial Repair & Maintenance 60% Commercial Construction 40% Repair & Maintenance 70% 7/27/2015 RPM INTERNATIONAL INC. 6 |
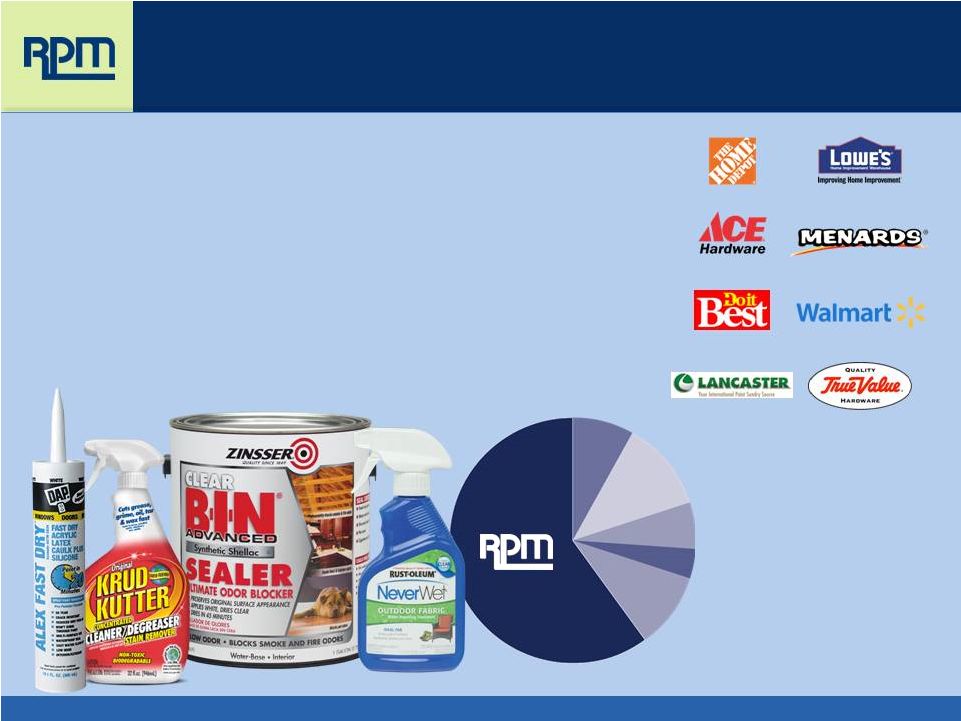 Market-Leading Consumer Brands
• Value-added partner • Innovative new products • Category management • Higher price points and margins for retailers • Immediate full-chain distribution • 80% U.S. vs. 20% ROW 7/27/2015 7 RPM INTERNATIONAL INC. |
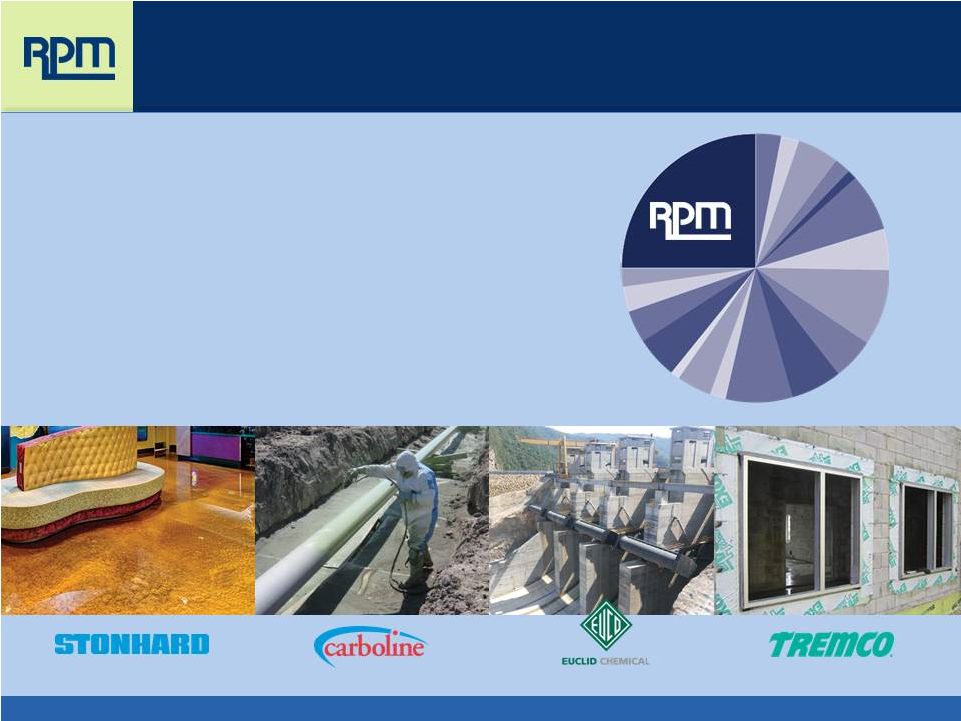 Diverse Industrial Global Brands
• Fragmented global markets • Less cyclical repair & maintenance • Low customer concentration • 50% U.S. vs. 50% ROW 7/27/2015 RPM INTERNATIONAL INC. 8 |
 Growth Strategy
Acquisitions • International Expansion • Product
Innovation 7/27/2015
RPM INTERNATIONAL INC.
9 |
 Acquisition Strategy
“The Best Home for
Entrepreneurial Companies”
Key requirements:
Acquisition Focus:
Key Takeaways: • Niche market leaders • Strong GP margins • Retain entrepreneurial management team • Geographic expansion • New markets • New products • 150+ acquisitions • Few divestitures • Less than 1% impairment charge in history of RPM 7/27/2015 RPM INTERNATIONAL INC. 10 |
 7/27/2015 RPM INTERNATIONAL INC. 11 International Expansion: 2005 vs. 2015 North America 2005 2015 $2,202 $3,195 86% 70% Asia/Pacific 2005 2015 $27 $121 1.0% 2.6% Europe 2005 2015 $251 $942 10% 20% South/Latin America 2005 2015 $42 $251 1.7% 5.5% TOTAL 2005 2015 $2,556 mm $4,595 Africa/Middle East 2005 2015 $34 $86 1.3% 1.9% Dollars in millions |
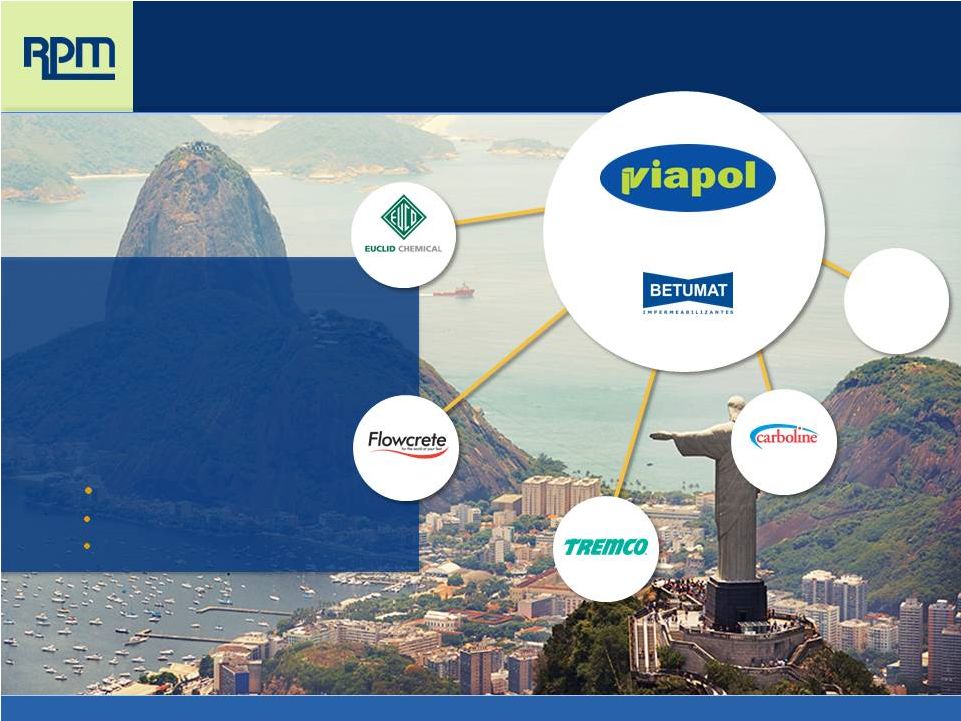 7/27/2015 RPM INTERNATIONAL INC. 12 Connections Creating Value: Model for Success in Developing World • Acquire platform company • Great management team • Market leader • Potential for rapid expansion • Established base of shared: Manufacturing Distribution Technology FY 15 FY 16 More to Come FY 13 FY 15 FY 14 FY 15 |
 7/27/2015 RPM INTERNATIONAL INC. 13 Connections Creating Value: Leveraging Shared Technologies |
 7/27/2015 RPM INTERNATIONAL INC. 14 New Product Innovations AlphaGuard RoofTec |
 7/27/2015 RPM INTERNATIONAL INC. 15 Steve Knoop Chief Executive Officer Specialty Products Holding Corp. |
 7/27/2015 RPM INTERNATIONAL INC. 16 SPHC • +$400 million in sales • 5 Platforms • 10 Businesses • 1 Theme: Specialty Products |
 7/27/2015 RPM INTERNATIONAL INC. 17 SPHC Growth Strategy • Organic Growth – Product innovation and technology investments pay dividends – Attacking market niches in traditional product areas • Acquisition Growth – Chapter 11 process provides pent up demand for high quality acquisition opportunities – Always seeking new platform businesses to join the confederation of specialty products companies |
 7/27/2015 RPM INTERNATIONAL INC. 18 Consistent Financial Performance |
 7/27/2015 RPM INTERNATIONAL INC. 19 Balanced Business = Steady Growth Consolidated 2011 2012 2013 2014 2015 Sales +8.5% +11.7% +8.0% +7.2% +5.0% Net Income +16.1% +14.2% +14.5% +20.9% +10.7% Note: Specialty Products Holding Corp. (SPHC) was deconsolidated on May 31, 2010 and reconsolidated on Jan. 1, 2015.
Net income and EBIT excludes one-time adjustments taken in FY2015 and
FY2013. Consumer
2011 2012 2013 2014 2015 Sales +3.4% +10.7% +16.1% +11.4% (0.2)% EBIT (0.9%) +9.7% +31.2% +19.5% +9.1% Industrial 2011 2012 2013 2014 2015 Sales +11.3% +12.2% +4.0% +5.0% +8.0% EBIT +15.4% +19.8% (0.7%) +11.1% +5.6% |
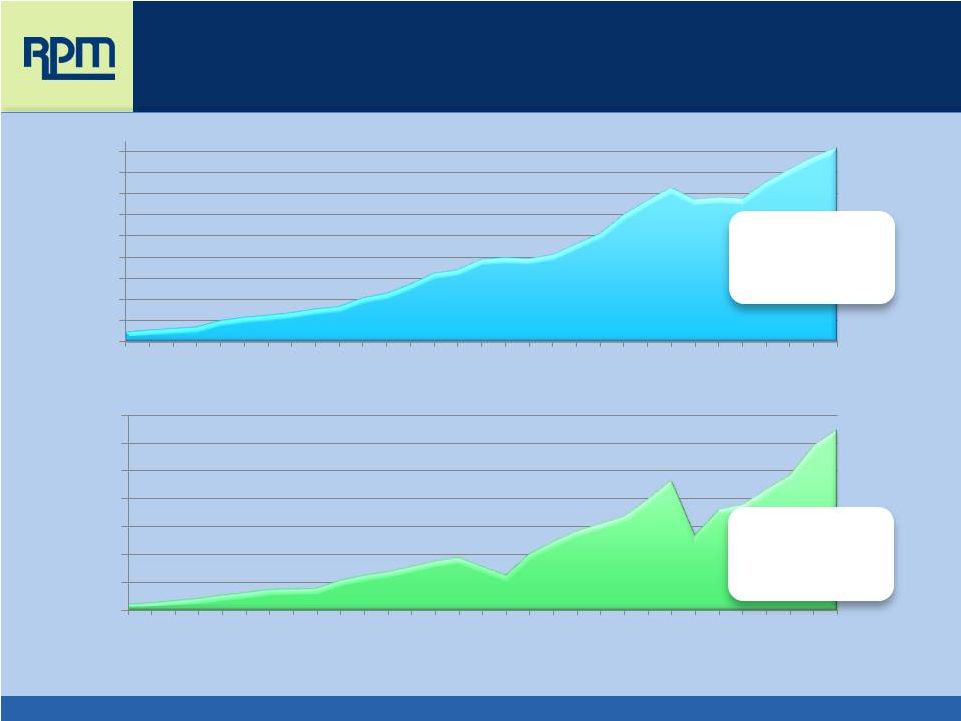 7/27/2015 RPM INTERNATIONAL INC. 20 Consistent Financial Performance: 30-Year Growth Profile 10.6% 30-yr. CAGR 11.9% 30-yr. CAGR Note: Specialty Products Holding Corp. (SPHC) was deconsolidated on May 31, 2010 and reconsolidated on Jan. 1, 2015
Note: Net income excludes one-time adjustments taken in FY2013 and 2015,
and asbestos charges taken from FY2003-FY2008 $0
$500 $1,000 $1,500 $2,000 $2,500 $3,000 $3,500 $4,000 $4,500 85 86 87 88 89 90 91 92 93 94 95 96 97 98 99 00 01 02 03 04 05 06 07 08 09 10 11 12 13 14 15 Sales $0 $50 $100 $150 $200 $250 $300 $350 85 86 87 88 89 90 91 92 93 94 95 96 97 98 99 00 01 02 03 04 05 06 07 08 09 10 11 12 13 14 15 Net Income |
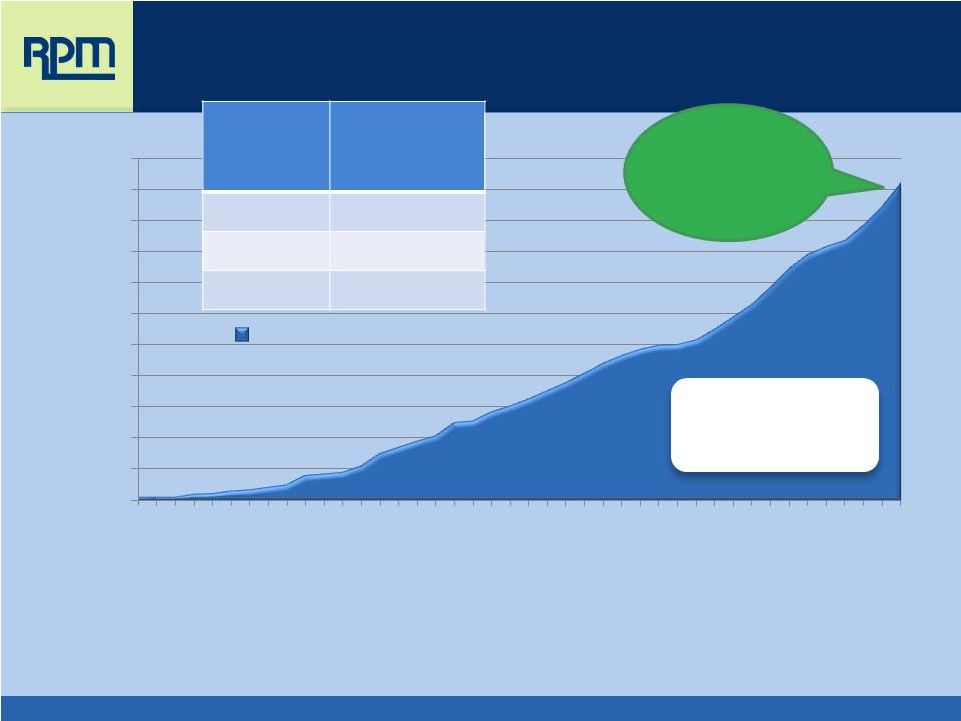 41 Consecutive Years of Dividend Increases
+ 8.3% 10/9/14 • Only 45 of all 19,000 U.S. publicly traded companies have an equal or better record
• The compounding benefit of reinvesting a growing cash dividend first envisioned by a
$25 mm company in 1973 continues today in a $4.6 bb company paying out
+$135 mm per year
$0.00 $0.10 $0.20 $0.30 $0.40 $0.50 $0.60 $0.70 $0.80 $0.90 $1.00 $1.10 '73 '75 '77 '79 '81 '83 '85 '87 '89 '91 '93 '95 '97 '99 '01 '03 '05 '07 '09 '11 '13 $1.8 billion Paid Acquired Yield on Original Investment Today 2.2% 10 yrs. 5.8% 25 yrs. 13.6% Dividend per share 7/27/2015 RPM INTERNATIONAL INC. 21 |
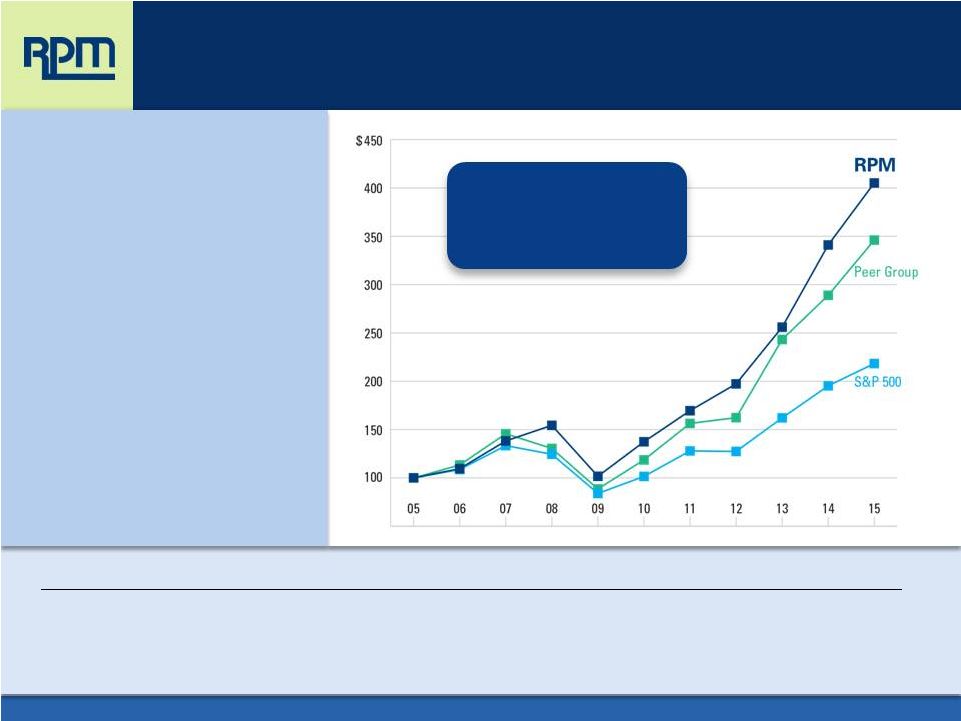 Consistent Financial Performance:
Superior Shareholder Return
Outperform: S&P 500 by 86% Peers by 17% Comparison of Cumulative Total Return Among RPM International Inc., the S&P 500 Index and a Peer Group 5/05 5/06 5/07 5/08 5/09 5/10 5/11 5/12 5/13 5/14 5/15 RPM International, Inc. 100.00 109.55 138.24 154.37 101.69 137.38 169.51 197.28 255.99 341.02 405.16 S&P 500 100.00 108.64 133.40 124.47 83.93 101.54 127.90 127.37 162.11 195.25 218.31 Peer Group 100.00 113.38 145.66 130.48 88.57 118.63 156.37 162.32 243.22 288.93 346.07 7/27/2015 RPM INTERNATIONAL INC. 22 Ten-year comparison based on $100 invested on 5/31/05 in stock or index — including reinvestment of dividends. Fiscal year ending May 31. (Peer Group includes Akzo Nobel N.V., Ferro Corporation, H.B. Fuller Company, Masco Corporation, PPG Industries, Inc., The Sherwin- Williams Company and The Valspar Corporation.) |
 Fiscal 2015 Fourth-Quarter Results
($ in millions, except per share amounts)
Three Months Ended May 31, Consolidated 2015 2014 % Sales $1,373 $1,277 +7.5% EBIT $204 $172 +18.7% Net Income $128 $109 +17.7% EPS $0.94 $0.80 +17.5% Three Months Ended May 31, Consumer 2015 2014 % Sales $495 $508 (2.6)% EBIT $101 $86 +17.1% Three Months Ended May 31, Industrial 2015 2014 % Sales $878 $769 +14.2% EBIT $121 $99 +21.6% 7/27/2015 RPM INTERNATIONAL INC. 23 |
 Fiscal 2016 Outlook
7/27/2015 RPM INTERNATIONAL INC. 24 |
 Capital Allocation: Fiscal 2006-2015
Dividends Capex Asbestos Acquisitions TOTAL $1,054,367 $673,215 $575,096 $1,226,622 $3,529,300 7/27/2015 RPM INTERNATIONAL INC. 25 Dividends Capex 19% Asbestos 16% Acquisitions 35% 30% |
 7/27/2015 RPM INTERNATIONAL INC. 26 Fiscal 2016 Outlook “Accelerating Growth Investments” • CapEx increase from $85 million to $120 million; large investments in: – Tremco Roofing: AlphaGuard – Kirker U.S. bottling and UK expansion – Euclid Chemical: Tuf-Strand Macro Fibers – Euclid Chemical Latin America: construction chemicals – Viapol Brazilian platform for Euclid, Flowcrete, Tremco and Carboline • Replicate successful Brazilian strategy in Malaysia • Increase consumer advertising to expand market share |
 7/27/2015 RPM INTERNATIONAL INC. 27 Fiscal 2016 Outlook SPHC Core RPM Total FY2015 ADJUSTED EPS* $0.05 $2.33 $2.38 *Fiscal 2015 U.S. GAAP diluted EPS of $1.78, adjusted for ASC 740 potential repatriation of foreign earnings of $0.60 per
share. |
 7/27/2015 RPM INTERNATIONAL INC. 28 Fiscal 2016 Outlook SPHC Core RPM Total FY2015 ADJUSTED EPS* $0.05 $2.33 $2.38 Adjustments to FY15 EPS: Earnout reversals ($0.15) ($0.15) SPHC/SEC legal & Q4 restructuring $0.07 $0.07 FY2015 Adjusted EPS Base $0.05 $2.25 $2.30 *Fiscal 2015 U.S. GAAP diluted EPS of $1.78, adjusted for ASC 740 potential repatriation of foreign earnings of $0.60 per
share. |
 7/27/2015 RPM INTERNATIONAL INC. 29 Fiscal 2016 Outlook SPHC Core RPM Total FY2015 ADJUSTED EPS* $0.05 $2.33 $2.38 Adjustments to FY15 EPS: Earnout reversals ($0.15) ($0.15) SPHC/SEC legal & Q4 restructuring $0.07 $0.07 FY2015 Adjusted EPS Base $0.05 $2.25 $2.30 SPHC incremental contribution $0.15 $0.15 RPM core growth (12%) $0.27 $0.27 FY2016 "Apples-to-Apples" compare to FY2015 $0.20 $2.52 $2.72 *Fiscal 2015 U.S. GAAP diluted EPS of $1.78, adjusted for ASC 740 potential repatriation of foreign earnings of $0.60 per
share. |
 7/27/2015 RPM INTERNATIONAL INC. 30 Fiscal 2016 Outlook SPHC Core RPM Total FY2015 ADJUSTED EPS* $0.05 $2.33 $2.38 Adjustments to FY15 EPS: Earnout reversals ($0.15) ($0.15) SPHC/SEC legal & Q4 restructuring $0.07 $0.07 FY2015 Adjusted EPS Base $0.05 $2.25 $2.30 SPHC incremental contribution $0.15 $0.15 RPM core growth (12%) $0.27 $0.27 FY2016 "Apples-to-Apples" compare to FY2015 $0.20 $2.52 $2.72 Net impact attributable to translational FX ($0.07) ($0.07) Net impact of higher effective tax rate ($0.10) ($0.10) FY2016 ESTIMATED EPS $0.20 $2.35 $2.55 *Fiscal 2015 U.S. GAAP diluted EPS of $1.78, adjusted for ASC 740 potential repatriation of foreign earnings of $0.60 per
share. |
 Good Value in a Great Company “Hire the best people you can find. Create an atmosphere that will keep them. Then let them do their jobs.” Frank C. Sullivan, 1947 7/27/2015 RPM INTERNATIONAL INC. 31 |