Attached files
| file | filename |
|---|---|
| 8-K - 8-K - NAVISTAR INTERNATIONAL CORP | d935271d8k.htm |
| EX-99.1 - EX-99.1 - NAVISTAR INTERNATIONAL CORP | d935271dex991.htm |
 Q2 2015 EARNINGS PRESENTATION JUNE 4, 2015 Exhibit 99.2 |
 2 NYSE: NAV Q2 2015 Earnings – 6/4/2015 Safe Harbor Statement Information provided and statements contained in this report that are not purely historical are
forward- looking statements within the
meaning of Section 27A of the Securities
Act of 1933, as amended,
Section
21E of the Securities Exchange Act of 1934, as amended,
and the Private Securities Litigation
Reform Act of 1995. Such forward-looking statements
only speak as of the date of this report and the Company assumes no obligation to update the information included in this report. Such forward-
looking statements include information concerning our
possible or assumed future results of
operations, including descriptions of our business
strategy. These statements often include words such as “believe,” “expect,” “anticipate,” “intend,” “plan,”
“estimate,” or similar expressions. These statements are not guarantees of performance or results and they involve risks, uncertainties, and
assumptions. For a further description of these factors,
see the risk factors set forth in our filings with the Securities and Exchange Commission, including our annual report on Form 10-K for the year ended
October 31, 2014 and our quarterly report
on Form 10-Q for the quarter ended April 30, 2015. Although we believe that these forward-looking statements are based on reasonable assumptions,
there are many factors that could affect our actual
financial results or results of operations and could cause actual results to differ materially from those in the forward-looking statements. All future written
and oral forward-looking statements by
us or persons acting on our behalf are expressly qualified in their entirety by the cautionary statements contained or referred to above. Except for our ongoing
obligations to disclose material information as required
by the federal securities laws, we do not have any obligations or intention to release publicly any revisions to any forward-looking statements to
reflect events or circumstances in the
future or to reflect the occurrence of unanticipated events. |
 3 NYSE: NAV Q2 2015 Earnings – 6/4/2015 Other Cautionary Notes The financial information herein contains audited and unaudited information and has been prepared
by management in good faith and based on data currently
available to the Company. Certain
non-GAAP measures are used in this presentation to assist the reader in understanding our core manufacturing business. We believe this information is useful and relevant to assess and
measure the performance of our core manufacturing
business as it illustrates manufacturing
performance. It also excludes financial services and
other items that may not be related to the core manufacturing business or underlying results. Management often uses this information to assess and
measure
the
underlying
performance
of
our
operating
segments.
We
have
chosen
to
provide
this
supplemental information to investors, analysts, and
other interested parties to enable them to
perform additional analyses of operating results. The
non-GAAP numbers are reconciled to the most appropriate GAAP number in the appendix of this presentation. |
 4 NYSE: NAV Q2 2015 Earnings – 6/4/2015 Agenda Overview Troy Clarke Financial Results Walter Borst Summary Troy Clarke |
 NYSE: NAV 2 QUARTER 2015 RESULTS Troy Clarke, President & CEO * * * * * * * * * * * |
 6 NYSE: NAV Q2 2015 Earnings – 6/4/2015 Q2 Performance • Generated positive manufacturing cash flow • Increased core chargeouts (A) to 18,600 trucks - Up 38% from Q1 2015 - Up 10% from Q2 2014 • Grew adjusted EBITDA • Achieving cost reductions • Taking actions towards improving capacity utilization
• Investing in the core business 2nd Quarter Summary (A) Includes U.S. and Canada School bus and Class 6-8
medium and heavy truck.
|
 7 NYSE: NAV Q2 2015 Earnings – 6/4/2015 Industry Momentum Expected to Continue Optimistic Class 8 industry outlook • Lower energy costs • Favorable business conditions • Better new truck fuel economy and safety Positive Medium-duty truck industry outlook • Business investment growth • Housing market expansion |
 8 NYSE: NAV Q2 2015 Earnings – 6/4/2015 It’s Uptime at International! • Over 130,000 connected vehicles • Announced making OnCommand Connection standard on all new truck sales • Trained over 100 dealer specialists covering dealers in all major markets • Expanded service into Canada • Entering School Bus market with dedicated product |
 NYSE: NAV FINANCIAL RESULTS Walter Borst, Executive Vice President & CFO * * * * * * * * * * * |
 NYSE: NAV Q2 2015 Earnings – 6/4/2015 Income Statement Summary Note: This slide contains non-GAAP information; please see the
REG G in appendix for a detailed reconciliation.
(A)
Includes U.S. and Canada School bus and Class 6-8
medium and heavy truck.
(B) Amounts attributable to Navistar
International Corporation. $ in millions,
except per share and units Quarters Ended
April 30
2015
2014
Chargeouts
(A)
18,600
16,900
Sales and Revenues
$2,693
$2,746
Income
(Loss)
from
Continuing
Operations,
Net
of
Tax
(B)
$(64)
($298)
Diluted Income (Loss) Per Share from Continuing
Operations (B)
($0.78)
($3.66)
EBITDA
$85
($119)
10 |
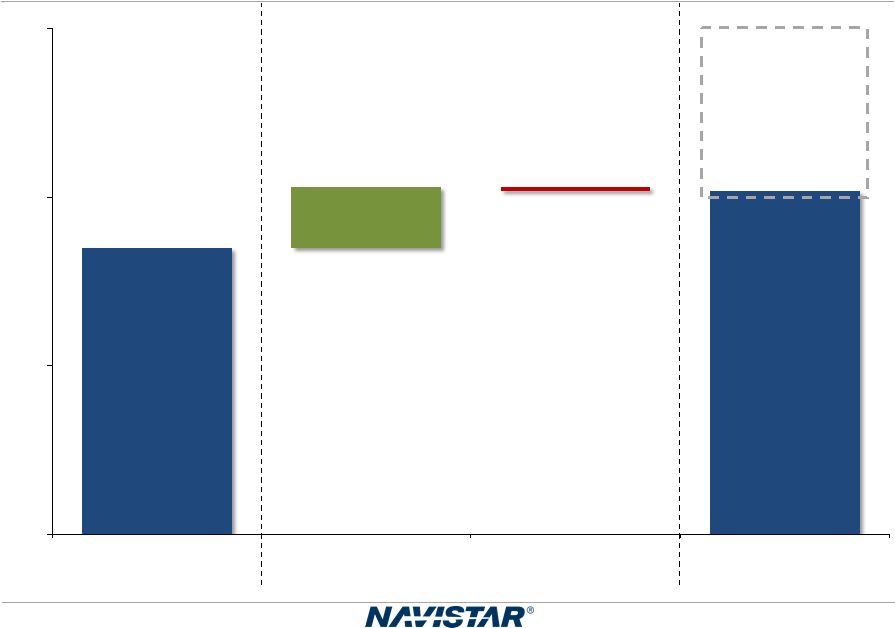 NYSE: NAV Q2 2015 Earnings – 6/4/2015 $85 $102 ($1) $18 $0 $50 $100 $150 Q2 2015 Actual EBITDA Pre-existing Warranty Adjustment One-time Items Q2 2015 Adjusted EBITDA Q2 Guidance:
$100-$150
Q2 2015 EBITDA
$ in millions
Note:
This slide contains non-GAAP information; please
see the REG G in appendix for a detailed
reconciliation. * Excluding
pre-existing warranty and one-time items. * 11 |
 NYSE: NAV Q2 2015 Earnings – 6/4/2015 Q2 2015 Segment Results $ in millions Beginning in the first quarter of 2015, the Company realigned its reporting
segments. The segment results have been restated to
reflect this change. Sales and
Revenues Segment Profit
Quarters Ended
April 30
Quarters Ended
April 30
Segment
2015
2014
2015
2014
Truck
$1,966
$1,889
($51)
($129)
Parts
$613
$630
$133
$133
Global Operations
$130
$271
$1
($162)
Financial Services
$60
$57
$22
$24
12 |
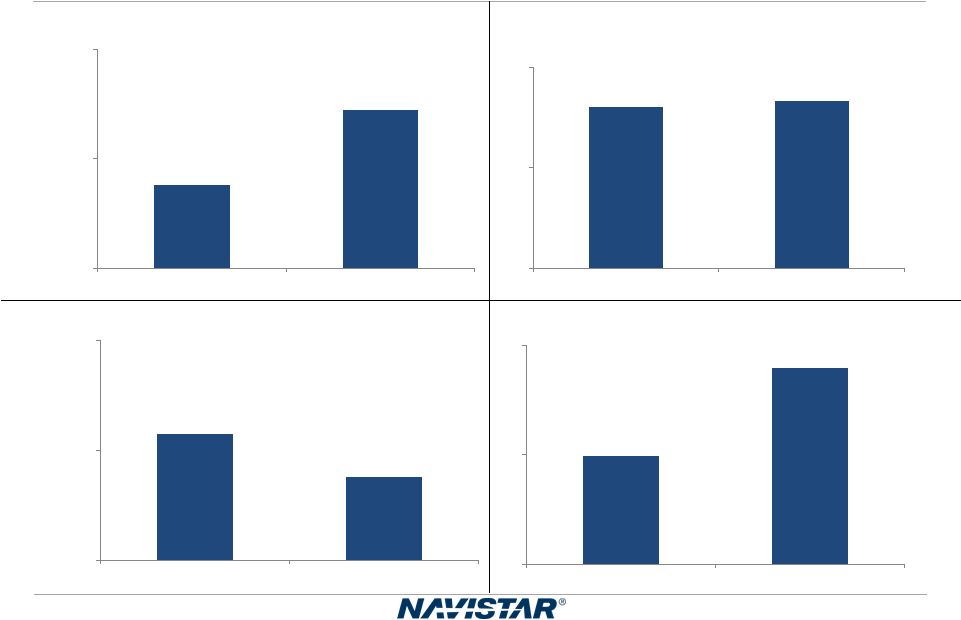 NYSE: NAV Q2 2015 Earnings – 6/4/2015 Second Quarter Progress (A) Includes U.S. and Canada School bus and Class 6-8 medium
and heavy truck.
(B) Excludes amounts related to
pre-existing warranties.
Note:
This slide contains non-GAAP information; please
see the REG G in appendix for a detailed
reconciliation. 15,000
17,500
20,000
2Q14
2Q15
Chargeouts
(A)
7%
10%
13%
2Q14
2Q15
Structural Costs %
Manufacturing Revenue
2.5%
3.0%
3.5%
2Q14
2Q15
Current Warranty Expense
(B)
%
Manufacturing Revenue
2%
3%
4%
2Q14
2Q15
Adjusted EBITDA Margin
13 |
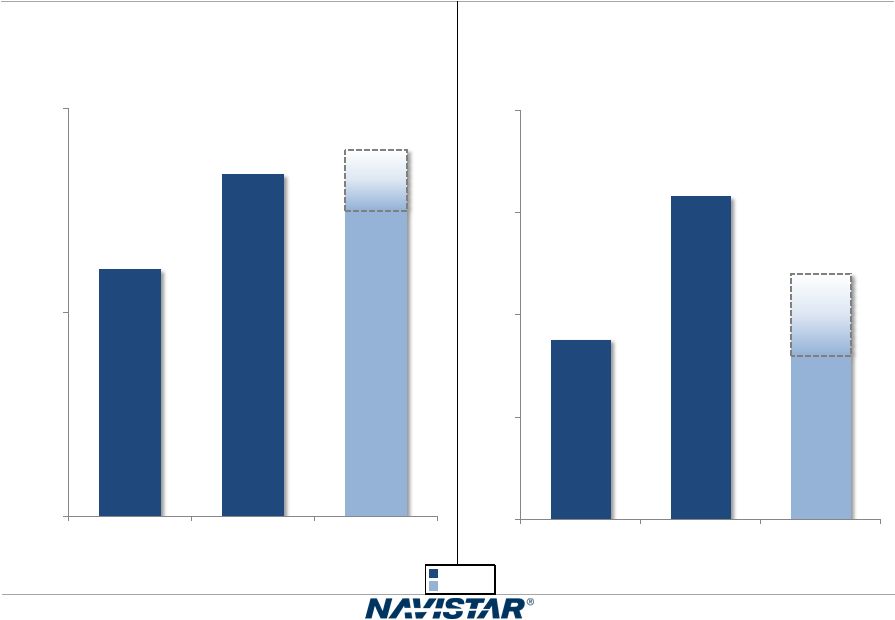 NYSE: NAV Q2 2015 Earnings – 6/4/2015 Operational Cost Savings 1.2% 1.7% 1.5 – 1.8% 0% 1% 2% 2013 2014 2015 Gross Material Savings* % Manufacturing Revenue *Excludes incremental SCR costs $44 $79 $40 – $60 $0 $25 $50 $75 $100 2013 2014 2015 Manufacturing Savings Actual Forecast 14 |
 NYSE: NAV Q2 2015 Earnings – 6/4/2015 Used Truck Update • Q2 ending gross inventory balance of $375 million • Inventory expected to peak at $425 million 15 |
 Q2 2015 Earnings – 6/4/2015 Q2 2015 Manufacturing Cash Update $ in millions *Guidance as provided on 3/3/2015 **Cash balance includes marketable
securities ^ Excluding one-time items
and pre-existing warranty
Note:
This slide contains non-GAAP information; please
see the REG G in appendix for a detailed
reconciliation.
Guidance*
Actual
Q1 2015 Manufacturing
Cash Balance**
$733
$733
Consolidated Adjusted EBITDA
^
$100 -
$150
$102
Capex/Cash Interest/Pension & OPEB
Funding ($120) -
($110)
($114)
Change in Net Working Capital/Debt and
Warranty/Other ^
($13) –
$27
$63
Q2 2015 Manufacturing Cash Balance**
$700-800
$784
16 |
 Q2 2015 Earnings – 6/4/2015 Guidance: Q3 2015 Manufacturing Cash $ in millions * Cash balance includes marketable securities. ** Excluding one-time items and pre-existing warranty
Note:
This slide contains non-GAAP information; please
see the REG G in appendix for a detailed
reconciliation. Q3 2015
Guidance
Q2 2015 Manufacturing
Cash Balance*
$784
Consolidated Adjusted EBITDA**
$125 -
$175
Capex/Cash Interest/Pension & OPEB
Funding ($155) -
($145)
Change in Net Working Capital/Debt and
Warranty/Other ($4) -
$36
Q3 2015 Manufacturing Cash Balance*
$750 -
$850
17 |
 Q2 2015 Earnings – 6/4/2015 3.8% 0% 2% 4% 6% 8% 10% Q1 Q2 Q3 Q4 8-10% Adjusted EBITDA Margin Improvement $ in millions Note: This slide contains non-GAAP information; please see the
REG G in appendix for a detailed reconciliation.
•
Q2 adjusted EBITDA
margin up 160 basis
points sequentially
• Cost improvements expected to continue in second half of 2015 • Q3 chargeouts expected to be up 8% year-over- year 2.2% 4.3- 6.3% 2015 Adjusted EBITDA Margin 2015 Actual 2015 Forecast 18 |
 NYSE: NAV Q2 2015 Earnings – 6/4/2015 Q2 2015 Accomplishments: • Increased core truck chargeouts by 1,700 units year-over-year • Higher market share sequentially • Additional cost reductions • Improved working capital • Positive manufacturing cash flow Adjusted EBITDA goal exiting 2015: On track Summing It Up 19 |
 NYSE: NAV SUMMARY Troy Clarke, President & CEO * * * * * * * * * * * |
 NYSE: NAV Q2 2015 Earnings – 6/4/2015 Q3 2015 • Chargeouts up 8% year-over-year • Adjusted EBITDA of $125-$175 million • Manufacturing cash balance of $750-$850 million
2015 Full Year
• Class 6-8 truck and bus industry: 350,000 to 380,000
-
Class 8 industry: 250,000 to 280,000
• Additional cost reduction opportunities • Expect Q4 adjusted EBITDA margin exceeding 8% 2016 Full Year • Class 6-8 truck and bus industry: 350,000-380,000
Expectations
21 |
 NYSE: NAV APPENDIX * * * * * * * * * * * * * |
 NYSE: NAV Q2 2015 Earnings – 6/4/2015 Navistar Financial Corporation Highlights • Financial Services Segment profit of $22 million for Q2 2015, $46 million YTD
• U.S. financing availability of $232 million as of April 30, 2015
• Financial Services Debt/Equity Leverage of 3.9:1 • Retail accounts funding facility renewed in May 2015 for $100 million
• GE announced intent to sell assets of GE Capital which include Navistar Capital
Retail Notes
Bank Facility
Dealer Floor Plan
• $840 million facility ($500 million revolver and $340 million term loan matures in December 2016) – Funding for retail notes, wholesale notes, retail accounts, and dealer open accounts • On balance sheet • NFSC wholesale trust as of April 2015 – $1 billion funding facility – Variable portion matures January 2016 – Term portions mature September 2015 and October 2016 • On balance sheet • Broader product offering • Enhanced ability to support large fleets • Better access to less expensive capital 23 |
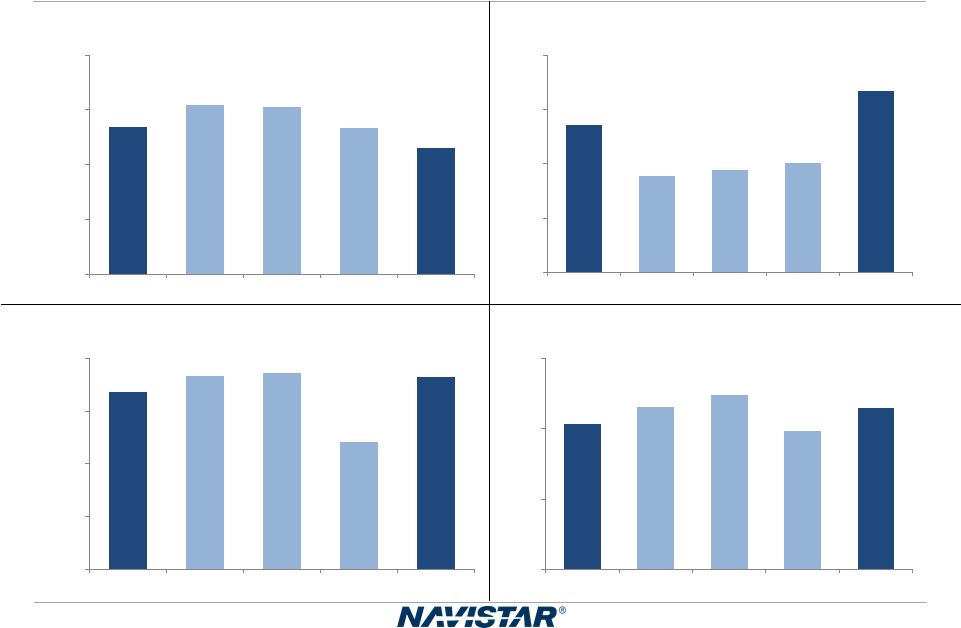 NYSE: NAV Q2 2015 Earnings – 6/4/2015 Chargeouts - 1,000 2,000 3,000 4,000 Q2 2014 Q3 2014 Q4 2014 Q1 2015 Q2 2015 School Bus - 2,000 4,000 6,000 8,000 Q2 2014 Q3 2014 Q4 2014 Q1 2015 Q2 2015 Class 6-7 Medium - 2,000 4,000 6,000 8,000 Q2 2014 Q3 2014 Q4 2014 Q1 2015 Q2 2015 Class 8 Heavy - 1,000 2,000 3,000 Q2 2014 Q3 2014 Q4 2014 Q1 2015 Q2 2015 Class 8 Severe 24 |
 NYSE: NAV Q2 2015 Earnings – 6/4/2015 Retail Market Share in Commercial Vehicle Segments Class 6/7 Medium-Duty Class 8 Severe Service Class 8 Heavy Three Months Ended April 30, January 31, October 31, July 31, April 30, 2015 2015 2014 2014 2014 Core Markets (U.S. and Canada) Class 6 and 7 medium trucks ................................................
27%
21%
19%
20%
26%
Class 8 heavy trucks
............................................................. 12% 10% 15% 14% 14% Class 8 severe service trucks ................................................
15%
14%
14%
15%
17%
Combined class 8 trucks
....................................................... 13% 11% 15% 14% 15% 25 |
 NYSE: NAV Q2 2015 Earnings – 6/4/2015 Worldwide Truck Chargeouts We define chargeouts as trucks that have been invoiced to customers. The units held in dealer inventory represent
the principal difference between retail
deliveries and chargeouts. This table summarizes our
approximate worldwide chargeouts from our continuing operations. We define our Core markets to include U.S. and Canada School bus and Class 6 through 8 medium and heavy
truck. Our Core markets include CAT- branded units sold to Caterpillar under our North America supply agreement.
(A)
Other markets primarily consist of Export Truck and
Mexico and also includes chargeouts
related to BDT of 2,600 units and 2,100 units during
the three months ended April 30, 2015 and
2014, respectively, and 6,000 and 4,500 during the six months ended April 30, 2015 and 2014. Three Months Ended April 30, % Change Six Months Ended April 30, % Change (in units) 2015 2014 Change 2015 2014 Change Core Markets (U.S. and Canada) School buses .........................................
2,300
2,700
(400)
(15)%
5,000
4,700
300
6 %
Class 6 and 7 medium trucks.................
6,700
5,400
1,300
24 %
10,700
8,600
2,100
24 %
Class 8 heavy trucks .............................
7,300
6,700
600
9 %
12,100
11,200
900
8 %
Class 8 severe service trucks ................
2,300
2,100
200
10 %
4,300
3,900
400
10 %
Total Core Markets.................................. 18,600 16,900 1,700 10 % 32,100 28,400 3,700 13 % Non "core" military ...............................
—
100
(100)
—
%
—
100
(100)
—
%
Other markets
(A)
.....................................
5,400
6,700
(1,300)
(19)%
12,400
12,100
300
2 %
Total worldwide unit................................ 24,000 23,700 300 1 % 44,500 40,600 3,900 10 % Combined class 8 trucks........................ 9,600 8,800 800 9 % 16,400 15,100 1,300 9 % 26 |
 NYSE: NAV Q2 2015 Earnings – 6/4/2015 Worldwide Engine Shipments Three Months Ended April 30, % Change Six Months Ended April 30, % Change (in units) 2015 2014 Change 2015 2014 Change OEM sales-South America.................. 11,600 24,500 (12,900) (53)% 27,300 44,900 (17,600) (39)% Intercompany sales..............................
7,000
10,100
(3,100)
(31)%
13,600
19,600
(6,000)
(31)%
Other OEM sales.................................
2,600
2,900
(300)
(10)%
5,500
5,300
200
4 %
Total
sales.....................................
21,200
37,500
(16,300)
(43)%
46,400
69,800
(23,400)
(34)%
27 |
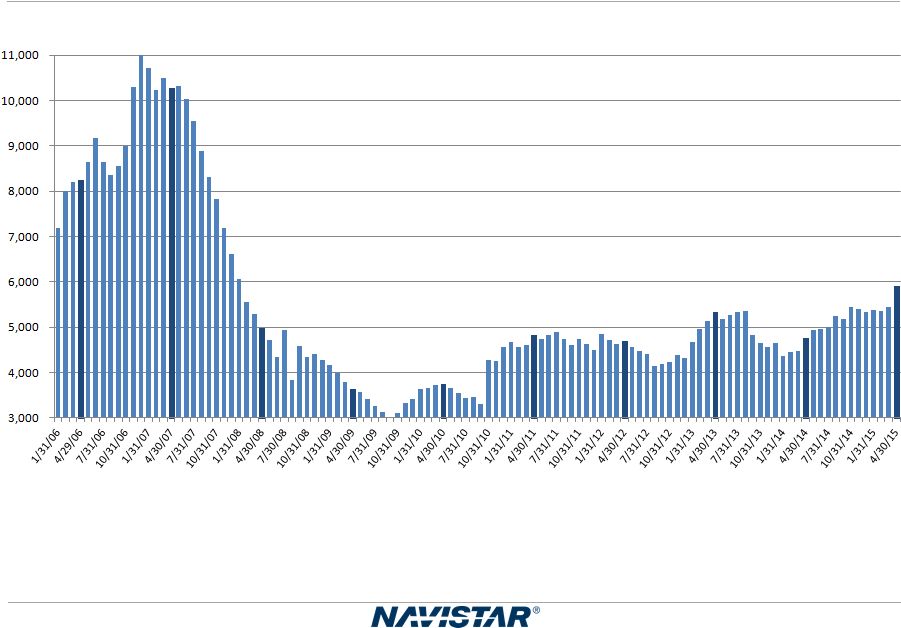 NYSE: NAV Q2 2015 Earnings – 6/4/2015 U.S. and Canada Dealer Stock Inventory* *Includes U.S. and Canada Class 4-8 and school bus inventory, but does not include U.S. IC Bus.
28 |
 NYSE: NAV Q2 2015 Earnings – 6/4/2015 Frequently Asked Questions Q1: What is included in Corporate and Eliminations? A: The primary drivers of Corporate and Eliminations are Corporate SG&A, pension and OPEB expense (excluding
amounts allocated to the segments), annual
incentive, manufacturing interest expense, and the elimination of intercompany sales and profit between segments. Q2: What is included in your equity in loss of non-consolidated affiliates?
A:
Equity in loss of non-consolidated affiliates is
derived from our ownership interests in partially-owned affiliates that are not consolidated. Q3: What is your net income attributable to non-controlling interests?
A:
Net income attributable to non-controlling interests
is the result of the consolidation of subsidiaries in which we do not own 100%, and is primarily comprised of Ford's non-controlling interest in our Blue Diamond Parts joint
venture. Q4:
What are your expected 2015 and beyond pension funding
requirements? A:
Future contributions are dependent upon a number of
factors, principally the changes in values of plan assets, changes in interest rates and the impact of any funding relief currently under consideration. For the three and six months ended April
30, 2015, we contributed $32 million and
$62 million, respectively, to our U.S. and Canadian pension plans (the “Plans”) to meet the minimum required contributions for all plans. We currently anticipate additional contributions of approximately $51
million to the Plans during the remainder
of 2015. Future contributions are dependent upon a number of factors, principally the changes in values of plan assets, changes in interest rates, the impact of any future funding relief, and the impact of funding resulting from the closure of our Chatham plant. We currently expect that from 2016 through 2018, the Company will be required to contribute at least $100
million per year to the Plans, depending on
asset performance and discount rates.
29 |
 NYSE: NAV Q2 2015 Earnings – 6/4/2015 Frequently Asked Questions Q5: What is your expectation for future cash tax payments?
A:
Our cash tax payments are expected to remain low in 2015
and will gradually increase as we utilize available net operating losses (NOLs) and tax credits in future years. Q6: What is the current balance of net operating losses as compared to other deferred tax assets?
A:
As of October 31, 2014 the Company has deferred tax
assets for U.S. federal NOLs valued at $870 million, state NOLs valued at $144 million, and foreign NOLs valued at $199 million, for a total undiscounted cash value of $1.2 billion. In addition to NOLs, the Company has deferred tax assets for accumulated tax credits of $256 million and other deferred tax assets of $1.9
billion resulting in net
deferred
tax
assets
before
valuation
allowances
of
approximately
$3.4
billion.
Of
this
amount,
$3.2
billion
is
subject
to
a
valuation allowance at the end of FY2014.
Q7:
How does your FY 2015 Class 8 industry outlook compare to
ACT Research? A:
U.S. and Canadian Class 8 Truck Sales
Reconciliation to ACT
-
Retail Sales
2015
ACT*
302,500
CY to FY adjustment
(4,935)
Total (ACT comparable Class 8 to Navistar)
297,565
Navistar Industry Retail Deliveries Combined Class 8
Trucks 250,000
280,000
Navistar difference from ACT
47,565
17,565
*Source:
ACT
N.A.
Commercial
Vehicle
Outlook
-
May
2015
16.0%
5.9%
30 |
 NYSE: NAV Q2 2015 Earnings – 6/4/2015 Frequently Asked Questions Q8: What is your manufacturing interest expense for Fiscal Year 2015?
A:
For the three and six months ended April 30, 2015,
Manufacturing interest was $57 million and $114 million, respectively. Annual manufacturing interest for 2015 is forecasted to be down approximately 5% compared to 2014. For reference,
interest expense was $243 million and $251
million for FY 2014 and 2013, respectively.
Q9:
What should we assume for capital expenditures in Fiscal
Year 2015? A:
For the three and six months ended April 30, 2015,
capital expenditures were $28 million and $45 million, respectively. Annual Capital expenditures for 2015 is forecasted to be between $125 - 150 million. In comparison, capital expenditures were $88 million and $167 million for FY 2014 and 2013, respectively.
31 |
 NYSE: NAV Q2 2015 Earnings – 6/4/2015 Outstanding Debt Balances April 30, October 31, (in millions) 2015 2014 Manufacturing operations Senior Secured Term Loan Credit Facility, as amended, due 2017, net of unamortized discount of
$3, at both
dates………………………………………………………………………………………
$
694
$
694
8.25% Senior Notes, due 2021, net of unamortized
discount of $19 and $20, respectively………… 1,181 1,180 4.50% Senior Subordinated Convertible Notes, due 2018, net of unamortized discount of $17 and
$19,
respectively……………………………………………………………………………………...
183
181
4.75% Senior Subordinated Convertible Notes, due 2019,
net of unamortized discount of $36 and
$40,
respectively…………………………………………………………………………..………….
375
371
Debt of majority-owned
dealerships…………………………………………………………………. 28 30 Financing arrangements and capital lease
obligations………………………………………………. 50 54 Loan Agreement related to 6.5% Tax Exempt Bonds, due
2040…………………………….……… 225 225 Promissory
Note……………………………………………………………………………...………
5
10
Financed lease
obligations……………………………………………………………………………
141
184
Other…………………….......................…………………………………..........................................
24
29
Total Manufacturing operations
debt……………. ……………………………............................. 2,906 2,958 Less: Current Portion……………………………………………………………………………........
115
100
Net long-term Manufacturing operations
debt…………………………………………………..... $ 2,791 $ 2,858 April 30, October 31, (in millions) 2015 2014 Financial Services operations Asset-backed debt issued by consolidated SPEs, at fixed and variable rates, due serially through
2018…………………………………………………………………………………………………..
$
986
$
914
Bank revolvers, at fixed and variable rates, due dates
from 2015 through 2020……………………. 1,205 1,242 Commercial paper, at variable rates, program matures in
2017……………………………………... 77 74 Borrowings secured by operating and finance leases, at various rates, due serially through 2018….
29
36
Total Financial Services operations debt
………………………………………………………… 2,297 2,266 Less: Current portion
………………………………………………………………………………...
1,096
1,195
Net long-term Financial Services operations
debt………………………………………………... $ 1,201 $ 1,071 32 |
 NYSE: NAV Q2 2015 Earnings – 6/4/2015 SEC Regulation G Non-GAAP Reconciliation SEC Regulation G Non-GAAP Reconciliation The financial measures presented below are unaudited and not in accordance with, or an alternative for, financial
measures presented in accordance with U.S.
generally accepted accounting principles
("GAAP"). The non-GAAP financial information presented herein should be considered supplemental to, and not as a substitute for, or superior to, financial measures calculated in accordance with GAAP and are reconciled to the most appropriate GAAP number below Earnings (loss) Before Interest, Income Taxes, Depreciation, and Amortization (“EBITDA”):
We define EBITDA as our consolidated net income (loss)
from continuing operations attributable to Navistar International Corporation, net of tax, plus manufacturing interest expense, income taxes, and depreciation and amortization. We believe EBITDA provides
meaningful information to the performance of
our business and therefore we use it to supplement our
GAAP reporting. We have chosen to provide this supplemental information to investors, analysts and other interested parties to enable them to perform additional analyses of operating results..
Adjusted EBITDA:
We believe that adjusted EBITDA, which excludes certain
identified items that we do not consider to be part of our ongoing business, improves the comparability of year to year results, and is representative of our underlying performance. Management uses this
information to assess and measure the
performance of our operating segments. We have chosen to
provide this supplemental information to investors, analysts and other interested parties to enable them to perform additional analyses of operating results, to illustrate the results of operations giving effect to
the non-GAAP adjustments shown in the below reconciliations, and to provide an additional measure of performance.
Adjusted EBITDA margin:
We define Adjusted EBITDA margin as a percentage of the
Company's consolidated sales and revenues. We have chosen to provide this supplemental information to investors, analysts and other interested parties to enable them to perform additional analyses of
operating results, to illustrate the results of operations giving effect to the non-GAAP adjustments shown in the below reconciliations, and to provide
an additional measure of performance.
Manufacturing Cash, Cash Equivalents, and Marketable
Securities: Manufacturing
cash,
cash
equivalents,
and
marketable
securities
represents
the
Company’s
consolidated
cash,
cash
equivalents,
and
marketable
securities
excluding cash, cash equivalents, and marketable
securities of our financial services operations. We include marketable securities with our cash and cash equivalents when assessing our liquidity position as our investments are highly liquid in nature. We have chosen to provide this supplemental information to investors, analysts and other interested parties to enable them to perform additional analyses of our ability to
meet our operating requirements, capital
expenditures, equity investments, and financial
obligations. Structural costs consists of Selling, general and administrative expenses and Engineering and product development
costs. 33
|
 NYSE: NAV Q2 2015 Earnings – 6/4/2015 SEC Regulation G Non-GAAP Reconciliations Manufacturing segment cash and cash equivalents and marketable securities reconciliation:
April 31,
January 31,
(in millions)
2015
2015
Manufacturing Operations:
Cash and cash
equivalents……………………………………………………………. $ 536 $ 583 Marketable
securities………………………………………………………….……… 248 150 Manufacturing Cash and cash equivalents and Marketable securities………………. $ 784 $ 733 Financial Services Operations: Cash and cash
equivalents……………………………………………………………. $ 47 $ 37 Marketable
securities………………………………………………………….……… 25 25 Financial Services Cash and cash equivalents and Marketable securities…………… $ 72 $ 62 Consolidated Balance Sheet: Cash and cash
equivalents……………………………………………………………. $ 583 $ 620 Marketable
securities………………………………………………………….……… 273 175 Consolidated Cash and cash equivalents and Marketable securities…………………
$
856
$
795
34 |
 NYSE: NAV Q2 2015 Earnings – 6/4/2015 SEC Regulation G Non-GAAP Reconciliations Earnings (loss) before interest, taxes, depreciation, and amortization ("EBITDA")
reconciliation
______________________
(A)
Manufacturing interest expense is the net interest
expense primarily generated for borrowings that support the manufacturing and corporate operations, adjusted to eliminate intercompany interest expense with our Financial Services segment. The following
table reconciles Manufacturing interest
expense to the consolidated interest expense: ______________________ * For more detail on the items noted, please see slide 36 footnotes (A),(C),(D),(E), and (F).
(in millions)
EBITDA (reconciled
above) …......…………………………………… $ 85
$
101
$
(119)
Less significant items of:
Adjustments to pre-existing warranties
(A)
………………………...... 18 (57) 42 Asset impairment charges (C) ………...………………………………..
1
7
151
Restructuring charges and strategic
initiatives (D)
………..….……
2
3
8
Gain on settlement
(E)
………………………………………………….. (10) — — Brazil truck business actions (F) …….....………………………………
6
—
—
Total adjustments
17
(47)
201
Adjusted EBITDA
…......………………………………………….....…… $ 102 $
54
$ 82 Adjusted EBITDA Margin
…......………………………………….....….. 3.8% 2.2% 3.0% Quarters Ended April 30, 2015 April 30, 2014 January 31, 2015 (in millions) Loss from continuing operations attributable to NIC, net of tax …………
$
(64)
$
(42)
$
(298)
Plus:
Depreciation and amortization expense
……………………………….. 74 79 99 Manufacturing interest expense (A) ………………………………….….
57
57
57
Less:
Income tax benefit (expense)
…………………………………………… (18) (7) (23) EBITDA
………………………………………………………………………… $ 85 $ 101 $ (119) Quarters Ended
April 30, 2015
April 30, 2014
Janaury 31, 2015
(in millions)
Interest expense
……………………………………………………………….. $ 75 $ 77 $ 74 Less: Financial services interest expense
………………………………….. 18 20 17 Manufacturing interest expense
……………………..……………………… $ 57 $ 57 $ 57 Quarters Ended
April 30, 2015
April 30, 2014
January 31, 2015
35 |
 NYSE: NAV Q2 2015 Earnings – 6/4/2015 Significant Items Included Within Our Results Quarters Ended (in millions) April 30, 2015 January 31, 2015 April 30, 2014 Expense (income): Adjustments to pre-existing warranties (A) …………………………………
$
18
$
(57)
$
42
Accelerated depreciation
(B)
………………………………………………..
12
13
—
Asset impairment charges
(C)
……………………………………………….
1
7
151
Other restructuring charges and strategic
initiatives (D)
……………………...
2
3
8
Gain on settlement
(E)
………………………………………………………
(10)
—
—
Brazil truck business actions
(F)
……………………………………………
6
—
—
Brazilian tax adjustments
(G)
……………………………………………….
—
—
29
______________________
(A) Adjustments to pre-existing warranties
reflect changes in our estimate of warranty costs for products sold in prior periods. Such adjustments typically occur when claims experience deviates from historic and expected trends. Our warranty liability is generally affected by
component failure rates, repair costs, and
the timing of failures.
Future events and circumstances related to these
factors could materially change our estimates and require adjustments to our liability. In addition, new product launches require a greater use of judgment in developing estimates until historical
experience becomes available.
(B)
In
the
first
and
second
quarter
of
2015,
the
Truck
segment
recognized
charges
of
$13
million
and
$12
million,
respectively,
for
the
acceleration
of
depreciation of certain assets related to the foundry
facilities. (C)
In
the
first
and
second
quarter
of
2015,
the
Company
concluded
it
had
a
triggering
event
related
to
certain
operating
leases,
as
a
result,
the
Truck segment
recorded
$7
million
and
$1
million,
respectively,
of
asset
impairment
charges.
In
the
second
quarter
of
2014,
we
recognized
a
non-cash
charge
of
$149
million
for
the
impairment
of
certain
intangible
assets
of
our
Brazilian
engine
reporting
unit.
Due
to
slower
than
expected
growth
in
the
Brazilian
economy
causing
declines
in
actual
and
forecasted
results,
we
tested
the
goodwill
of
our
Brazilian
engine
reporting
unit
and
trademark
for
potential
impairment.
As
a
result,
we
determined
that
the
entire
$142
million
balance
of
goodwill
and
$7
million
of
trademark
were
impaired.
(D)
In
the
second
quarter
of
2014,
we
incurred
restructuring
charges
of
$8
million
related
to
cost
reduction
actions
that
included
a
reduction-in-force
in
the
U.S.
(E)
In
the
second
quarter
of
2015,
the
Global
Operations
segment
recognized
a
$10
million
gain
resulting
from
a
customer
settlement,
which
includes
an
offsetting restructuring charge of $4
million. (F)
In
the
second
quarter
of
2015
our
Global
Operations
segment
recorded
$6
million
in
inventory
charges
to
right
size
the
Brazil
Truck
business.
(G)
During
the
second
quarter
of
2014,
our
evaluation
of
the
realizability
of
our
Brazilian
deferred
tax
assets
resulted
in
a
determination
that
a
valuation
allowance was required, due to a deterioration of
operating performance in Brazil, an increase in net operating loss carryforwards, and the impairment of certain Brazilian intangible assets. As a result, we recorded a net expense of $29 million related to establishment of the valuation allowance and tax impact from the impairment of certain intangible assets. The above items, except for the Brazilian tax adjustments, did not have a material impact on taxes due to the
valuation allowances on our U.S. deferred tax assets, which was established in the fourth quarter of 2012. 36 |