Attached files
| file | filename |
|---|---|
| 8-K - FORM 8-K - Virtu KCG Holdings LLC | d936668d8k.htm |
 KCG Holdings, Inc. (NYSE: KCG) Sandler O’Neill Global Exchange and Brokerage Conference
June 3, 2015
Exhibit 99.1 |
 Safe Harbor Certain statements contained herein may constitute "forward-looking statements" within the meaning of the safe
harbor provisions of the U.S. Private Securities
Litigation Reform Act of 1995. Forward-looking statements are typically identified by words such as "believe," "expect," "anticipate," "intend," "target," "estimate," "continue," "positions,"
"prospects" or "potential," by future conditional verbs such as "will," "would," "should," "could" or "may," or by variations of such words or by similar expressions. These
"forward-looking statements" are not historical facts and are based on current expectations, estimates and projections about KCG's industry, management's beliefs and certain
assumptions made by management, many of which, by
their nature, are inherently uncertain and beyond our control. Any forward-looking statement contained herein speaks only as of the date on which it is made. Accordingly, readers are cautioned that any such forward-looking
statements are not guarantees of future performance
and are subject to certain risks, uncertainties and assumptions that are difficult to predict including, without limitation, risks associated with: (i) the strategic business combination (the "Mergers") of Knight Capital Group, Inc.
("Knight") and GETCO Holding Company,
LLC ("GETCO"), including, among other things, (a)
difficulties and delays in integrating the Knight and GETCO businesses or fully realizing cost savings and other benefits, (b) the inability to sustain revenue and earnings growth, and (c) customer and client reactions
to the Mergers; (ii) the August 1, 2012 technology
issue that resulted in Knight's broker-dealer subsidiary sending numerous erroneous orders in NYSE-listed and NYSE Arca securities into the market and the impact to Knight's business as well as actions taken in response thereto and
consequences thereof; (iii) the sales of KCG's
reverse mortgage origination and securitization business, KCG's futures commission merchant and KCG Hotspot; (iv) changes in market structure, legislative, regulatory or financial reporting rules, including the increased focus by regulators, the New
York Attorney General, Congress and the media on
market structure issues, and in particular, the scrutiny of high frequency trading, alternative trading systems, market fragmentation, colocation, access to market data feeds, and remuneration arrangements such as payment for order flow and
exchange fee structures; (v) past or future
changes to KCG’s organizational structure and management; (vi) KCG's ability to develop competitive new products and services in a timely manner and the acceptance of such products and services by KCG's customers and potential customers;
(vii) KCG's ability to keep up with technological
changes; (viii) KCG's ability to effectively identify and manage market risk, operational and technology risk, legal risk, liquidity risk, reputational risk, counterparty and credit risk, international risk, regulatory risk, and compliance
risk; (ix) the cost and other effects of material
contingencies, including litigation contingencies, and any adverse judicial, administrative or arbitral rulings or proceedings; (x) the effects of increased competition and KCG's ability to maintain and expand market share; and (xi) the completion of the
tender offer commenced by KCG on May 4, 2015.
The list above is not exhaustive. Readers should carefully review the risks and uncertainties disclosed in KCG's reports with the SEC, including, without limitation, those detailed under "Risk Factors" in KCG's Annual
Report on Form 10-K for the year- ended
December 31, 2014, Quarterly Report on Form 10-Q for the quarter-ended March 31, 2015, and other reports or documents KCG files with, or furnishes to, the SEC from time to time. For additional disclosures, please see https://www.kcg.com/legal/global-disclosures. |
 Update on Modified Dutch Auction Tender Offer On May 4, 2015, KCG commenced a “modified Dutch auction” tender offer under
the terms of which KCG would repurchase for cash properly tendered
outstanding shares of KCG Class A Common Stock
having an aggregate purchase price of up to $330
million From May 4 through June 2, 2015, KCG
stockholders were able to tender stock to KCG at
specified prices per share of not less than $13.50 and not greater than $14.00, or at the purchase price determined by KCG in
accordance with the terms of the offer
Based on the preliminary count, the offer is fully subscribed and
KCG expects to repurchase 23.6 million shares at
$14.00 per share with a preliminary proration factor
of approximately 28.7% Projected weighted average
shares outstanding of 108 to 111 million in 2Q15
1
1
The number of shares expected to be purchased in the tender offer
and the purchase price are preliminary and subject to change and to confirmation by the depositary. The final number of shares to be purchased and the final purchase price will be announced following the completion by the depositary of the confirmation process. 1 |
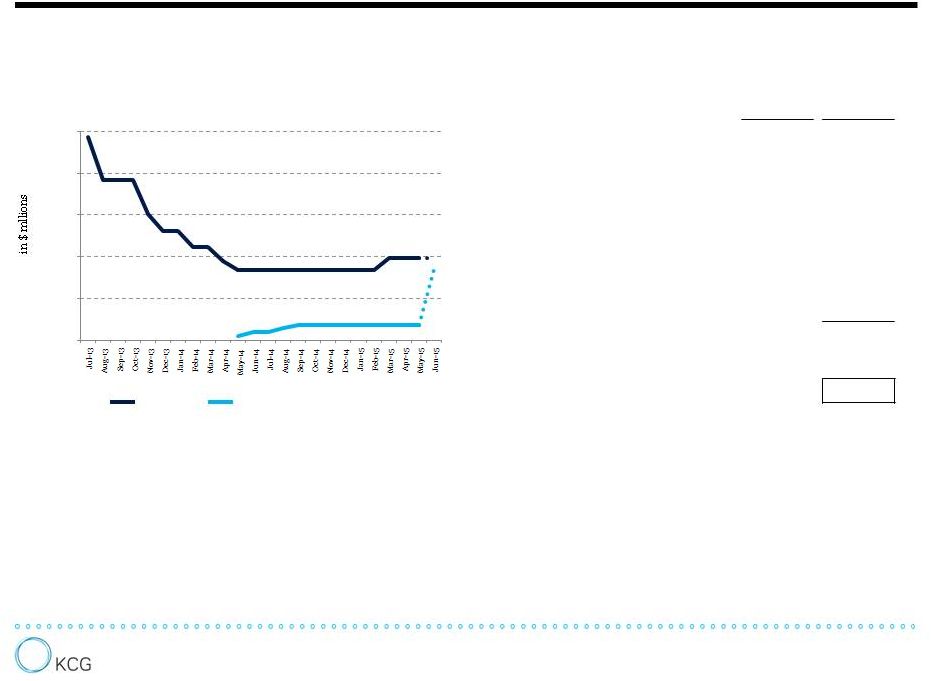 Cash Management: Deleveraging to Capital Return Debt level 1 Debt level and share repurchases for June 2015 assume no principal debt prepayments are made and that $330 million of shares
are repurchased pursuant to the modified Dutch auction tender offer 2 Represents the aggregate cash and cash equivalents held by GETCO Holding Company, LLC and Knight Capital Group, Inc. at June 30, 2013; also factors in cash activity related to the Mergers on 7/1 including issuance of $535 million First Lien Credit Facility, contribution of $55 million from GA offset by payment to Knight shareholders of $720 million, funding of escrow account to paydown Knight Convertibles of $375 million, payment of debt (and interest on debt) on GETCO's books and fees on Merger-related debt issuances 3 Asset sales represent aggregate cash received to date from sales of Urban Financial of America, KCG's futures commission
merchant (FCM) and KCG Hotspot, less estimated taxes payable on the applicable gains and excluding all future consideration 4 Free cash flow represents income from continuing operations less capital expenditures plus non-cash items such as
depreciation and amortization, stock-based compensation and non-GAAP adjustments included in Regulation G tables through 1Q15 5 Debt repayments represents total cash used to repay 8.25% $305 million Senior Secured Notes plus its make-whole premium plus $535 million First Lien Credit Facility ($117 million of the paydown of this facility came from the Collateral Account funded on 7/1; $117 million of KCG's cash was then used for the repayment of the remaining principal
outstanding of KCG's Convertible Notes 6
Funds received from issuance of debt, net represents issuance of
6.875% $500 million Senior Secured Notes, net of fees paid to third parties directly attributable to the debt issuance 7 Distributions from investments, net represents cash received as returns on capital related to KCG's investments, net of
additional investments made 8
Represents share repurchases under the initial $150 million share
repurchase program authorized by the KCG Board of Directors on May 1, 2014 9 Represents the preliminary dollar value of shares expected to be repurchased under the modified Dutch auction tender offer
announced on May 1, 2015. 10
Targeted liquidity pool, as described in KCG's quarterly report on
Form 10-Q for the quarter ended March 31, 2015 within Item 3 ‘Quantitative and Qualitative Disclosures About Market Risk’ 11 Represents cash in excess of the targeted liquidity pool, a portion of which is contained in Cash and cash equivalents and the remainder is used to fund daily
operations and contained elsewhere on the balance sheet including within Receivable from brokers, dealers and clearing organizations 2 $1,215 $95 $495 $0 $250 $500 $750 $1,000 $1,250 KCG debt level and cumulative share repurchases $425 Cumulative share repurchases
Cash
(in $ millions)
Sources
Uses
Approximate cash and cash equivalents
$ 730
Asset sales
304
278
857
488
58
95
330
Subtotal
575
Targeted liquidity pool of cash and highly-liquid
instruments
350
$ 225
NOTE: Totals may not add due to rounding
5
7
10
11
4
Free cash flow Debt repayments
Funds received from issuance of debt, net 6 Distributions from investments, net
Share repurchases 8 2 Tender Offer
Approximate remaining cash at July 1, 2013 3 9 1 |
 Consolidated Financials 3 Compensation and benefits Communications and data processing Depreciation and amortization Debt interest expense Professional fees Occupancy and equipment rentals Business development Other 1 See addendum for a reconciliation of GAAP to non-GAAP financial results; quarterly averages are
derived from totals provided in the charts
2
Free cash flow represents income from continuing operations less
capital expenditures plus non-cash items such as
depreciation and amortization, stock-based compensation and non-GAAP adjustments included in the Regulation G tables 3 Debt at March 31, 2015 included the 8.25% $305 million Senior Secured Notes, which were redeemed
subsequent to the quarter close using funds held in
escrow 4
Debt-to-tangible equity ratio at March 31, 2015 excludes
the 8.25% $305 million Senior Secured Notes which
were redeemed subsequent to the quarter close; tangible equity is calculated by subtracting goodwill and intangible assets from equity 5 Tangible book value is calculated by subtracting goodwill and intangible assets from equity; based on
shares outstanding of 117.9 million, including restricted stock
units (RSUs) as of May 7, 2015 Non-GAAP
pre-tax income from continuing operations
$0
$25
$50
$75
$100
$125
$150
$175
$200
$225
$250
2H13
2014
1Q15
$0
$10
$20
$30
$40
$50
$60
2H13
2014
1Q15
$210.2 mn
$199.0 mn
$186.6 mn
$19.4 mn
$22.5 mn
$32.4 mn
$41.6 mn
$36.5 mn
$48.4 mn
Avg.
quarterly
earnings
and
free
cash
flow
Avg.
quarterly
non-GAAP
expenses
Free cash flow
from
operating
income
2
1
1
KCG balance
sheet
As
of March 31, 2015
(in $ millions)
Cash and cash equivalents
990.5
Debt
3
799.8
Stockholders’ equity
1,783.3
-
-
-
0.30
-
-
-
Book
value per share
5
$15.10
Tangible book value per share
5
$13.86
Debt-to-tangible equity ratio
4 |
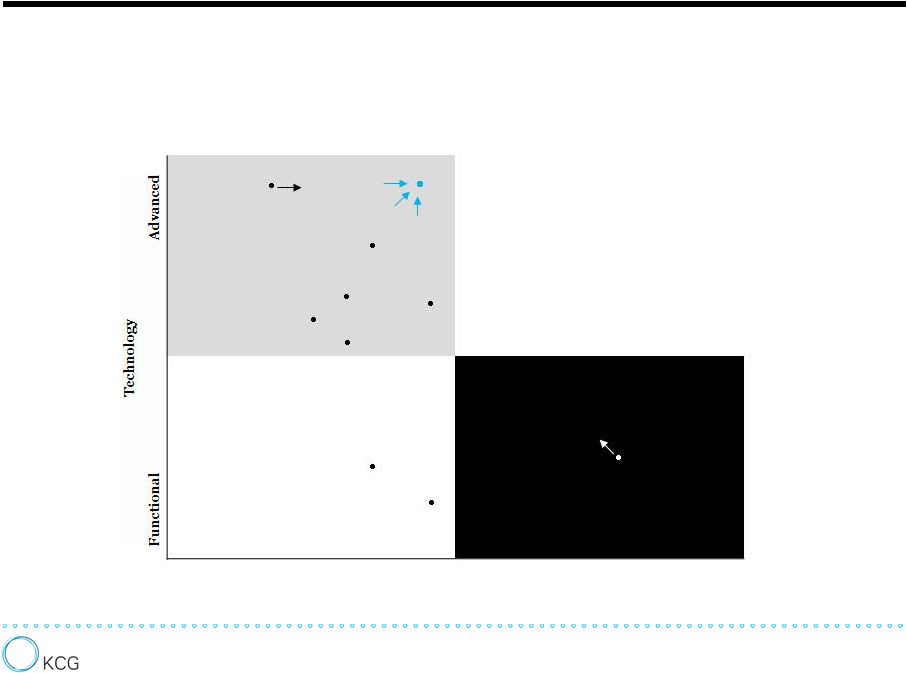 The Competitive Landscape Getting to the Right Strategic Spot in U.S. Trade Execution Potential Disruptors Market Leaders Specialized Full Service Client Offering Global banks Proprietary Trading Groups EMSs / OMSs Exchanges ATSs Institutional e-Brokers Mid-Size Institutional Brokers KCG * * KCG Holdings, Inc. was formed July 1, 2013 by the merger of GETCO Holding Company, LLC and Knight Capital Group,
Inc. 4
Prime
Brokers
Market Makers |
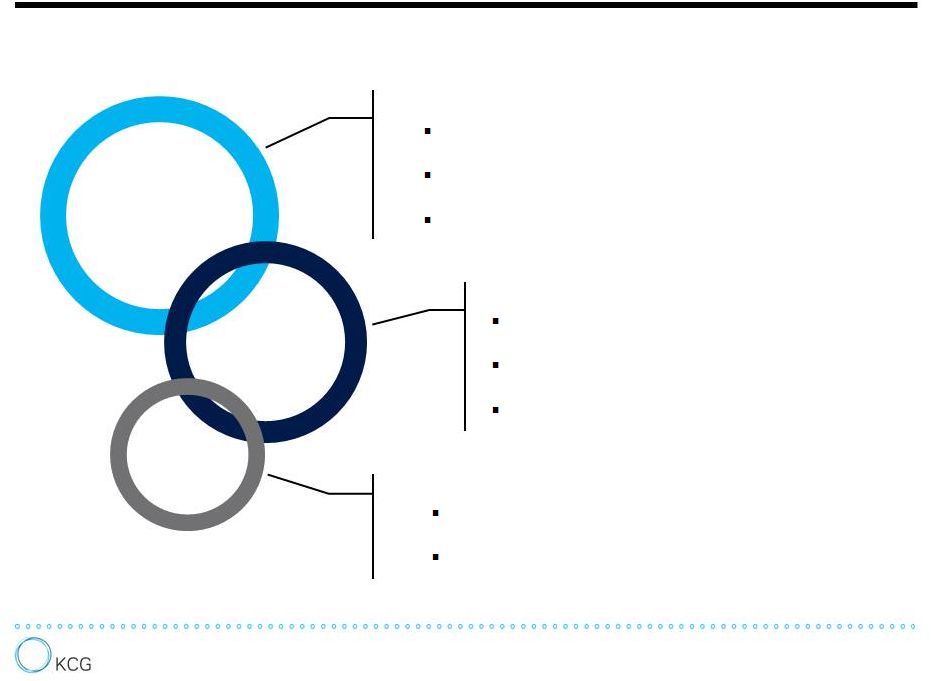 Prospects for Multiyear Organic Growth 5 Agency Execution: Expansion of algorithmic trading among U.S. and European asset managers, The continued growth of ETF assets under management and trading volume, The potential for unbundling Market Making: Incremental market share gains in U.S. equities from strategic clients and expanded capabilities, Market making in fixed income, currencies and commodities on a global basis, Building out the client network in Europe Trading Venues: Expansion of the KCG BondPoint offering for institutional clients Industry consolidation among ATSs Market Making Agency Execution Trading Venues |
 |
 Regulation G Reconciliation of Non-GAAP Financial Measures (Continuing Operations) 7 3 months ended March 31, 2015 Market Making Global Execution Services Corporate and Other Consolidated GAAP income (loss) from continuing operations before income taxes $ 39,340 $ 381,058 $ (14,270) $ 406,128 Gainon sale of KCG Hotspot - (385,026) - (385,026) Professional fees related to sale of KCG Hotspot - 6,736 - 6,736 Compensation expense related to sale of KCG Hotspot - 4,457 - 4,457 Lease loss accrual, net - - 132 132 $ 39,340 $ 7,225 $ (14,138) $ 32,427 Non-GAAP income (loss) from continuing operations before income taxes Reconciliation of GAAP pre-tax to non-GAAP pre-tax: |
 Regulation G Reconciliation of Non-GAAP Financial Measures (Continuing Operations) 8 3 months ended December 31, 2014 Reconciliation of GAAP pre-tax to non-GAAP pre-tax:
GAAP income (loss) from continuing operations before income
taxes Non-GAAP income (loss) from continuing
operations before income taxes Gain on sale of
FCM Lease loss accrual, net
Market Making
Global Execution
Services
Corporate and
Other
Consolidated
$ 42,710
$ 42,710
-
-
$ 9,968
(2,116)
-
$ 7,852
$ (26,147)
6,117
$ (20,030)
-
$ 26,531
$ 30,532
6,117
(2,116) |
 Regulation G Reconciliation of Non-GAAP Financial Measures (Continuing Operations) 9 3 months ended September 30, 2014 Market Making Global Execution Services Corporate and Other Consolidated Reconciliation of GAAP pre-tax to non-GAAP pre-tax: GAAP loss from continuing operations before income taxes $ (8,033) $ (1,664) $ (5,538) $ (15,235) Net gain related to tradeMONSTER combination with OptionsHouse
-
-
(15,105)
(15,105)
Compensation related to reduction in workforce and other employee
separations 2,786
3,577
4,158
10,521
Writedown of assets and lease loss accrual, net
-
-
301
301
Non-GAAP
(loss)
income
from
continuing
operations
before
income
taxes
$ (5,247)
$
1,913 $ (16,184)
$ (19,518)
|
 Regulation G Reconciliation of Non-GAAP Financial Measures (Continuing Operations) 3 months ended June 30, 2014 Market Making Global Execution Services Corporate and Other Consolidated Reconciliation of GAAP pre-tax to non-GAAP pre-tax: GAAP income (loss) from continuing operations before income taxes $ (22,233) $ 14,507 Writedown of capitalized debt costs - - 1,995 1,995 Compensation related to reduction in workforce 383 1,886 3,069 Writedown of assets and lease loss accrual, net 452 - 1,489 1,941 Non-GAAP income (loss) from continuing operations before income taxes $ 36,839 $ 2,622 $ (17,949) $ 21,512 10 $ 36,004 $ 736 800 |
 Regulation G Reconciliation of Non-GAAP Financial Measures (Continuing Operations) Market Making Global Execution Services Corporate and Other Consolidated $ 76,032 $ 2,016 $ (18,664) $ 59,384 - - 7,557 7,557 - - (9,644) (9,644) Lease loss accrual, net 359 - (93) 266 $ 76,391 $ 2,016 $ (20,844) $ 57,563 11 Non-GAAP income (loss) from continuing operations before income taxes Writedown of capitalized debt costs 3 months ended March 31, 2014 Reconciliation of GAAP pre-tax to non-GAAP pre-tax:
GAAP income (loss) from continuing operations before income
taxes Income resulting from the merger of BATS and
Direct Edge, net |
 Regulation G Reconciliation of Non-GAAP Financial Measures (Continuing Operations) 12 3 months ended December 31, 2013
Reconciliation of GAAP pre-tax to
non-GAAP pre-tax: GAAP income (loss) from continuing operations before income taxes Compensation and other expenses related to a reduction in workforce Professional and other fees related to Mergers and August 1st technology issue
Writedown of capitalized debt costs
Writedown of assets and lease loss accrual Gain on strategic asset
Non-GAAP income (loss) from continuing
operations before income taxes Market Making Global Execution Services Corporate and Other Consolidated $ 47,951 $ (4,491) $ (60,159) $ (16,699) 5,254 5,447 708 11,409 - - 2,785 2,785 - - 13,209 13,209 - - (1,359) (1,359) - 1,681 8,819 10,500 $ 53,205 $ 2,637 $ (35,997) $ 19,845 |
 13 Regulation G Reconciliation of Non-GAAP Financial Measures (Continuing Operations) 13 Market Making Global Execution Services Corporate and Other Consolidated $ 47,853 $ (16,354) $ 89,874 $ 121,373 - - (127,972) (127,972) 2,309 15,132 - 17,441 - - 7,269 7,269 108 - 828 936 $ 50,270 $ (1,222) $ (30,001) $ 19,047 3 months ended September 30, 2013
Reconciliation of GAAP pre-tax to
non-GAAP pre-tax: GAAP income (loss) from continuing operations before income taxes Gain on investment in Knight Capital Group, Inc. Compensation and other expenses related to reduction in workforce Writedown of assets and lease loss accrual, net Non-GAAP income (loss) from continuing operations before income taxes Professional and other fees related to Mergers and August 1 st technology issue |
 Regulation G Reconciliation of Non-GAAP Financial Measures (Continuing Operations) GAAP Adjustments for non-GAAP presentation KCG non-GAAP, normalized expenses Employee compensation and benefits 106,718 4,457 102,261 33,764 - 33,764 Depreciation and amortization 20,615 - 20,615 Debt interest expense 8,463 - 8,463 Professional fees 11,181 6,736 4,445 Occupancy and equipment rentals 7,340 - 7,340 Business development 1,857 - 1,857 132 132 - Other 7,808 - 7,808 Total expenses $ 197,878 $ 11,325 $ 186,553 14 Total expenses exclude transaction-based expenses which fluctuate based on market conditions and client activity.
3 months ended June 30, 2014
1
1 Lease loss accrual, net Reconciliation of GAAP expenses to KCG non-GAAP, normalized expenses: Communications and data processing |
 GAAP Adjustments for non-GAAP presentation KCG non-GAAP, normalized expenses Employee compensation and benefits 116,214 - 116,214 36,945 - 36,945 Depreciation and amortization 21,224 - 21,224 Debt interest expense 7,721 - 7,721 Professional fees 5,695 - 5,695 Occupancy and equipment rentals 8,514 - 8,514 Business development 2,308 - 2,308 Lease loss accrual, net 6,117 6,117 - Other 9,822 - 9,822 Total expenses $ 214,561 $ 6,117 $ 208,444 Regulation G Reconciliation of Non-GAAP Financial Measures (Continuing Operations) 15 Total expenses exclude transaction-based expenses which fluctuate based on market conditions and client activity.
1 1 3 months ended December 31, 2014
Reconciliation of GAAP expenses to KCG non-GAAP, normalized expenses:
Communications and data processing |
 Regulation G Reconciliation of Non-GAAP Financial Measures (Continuing Operations) GAAP Adjustments for non-GAAP presentation KCG non-GAAP, normalized expenses Employee compensation and benefits 95,307 10,521 84,786 38,576 - 38,576 Depreciation and amortization 20,298 - 20,298 Debt interest expense 7,714 - 7,714 Professional fees 7,161 - 7,161 Occupancy and equipment rentals 7,672 - 7,672 Business development 3,163 - 3,163 301 301 - Other 10,580 - 10,580 $ 190,772 $ 10,822 $ 179,950 16 1 Total expenses exclude transaction-based expenses which fluctuate based on market conditions and client activity.
3 months ended September 30, 2014
Reconciliation of GAAP expenses to KCG non-GAAP,
normalized expenses:
Communications and data processing
Writedown of assets and lease loss accrual, net 1 Total expenses |
 GAAP Adjustments for non-GAAP presentation KCG non-GAAP, normalized expenses Reconciliation of GAAP expenses to KCG non-GAAP, normalized expenses: Employee compensation and benefits 103,430 3,069 100,361 38,279 - 38,279 Depreciation and amortization 19,823 - 19,823 Debt interest expense 7,497 - 7,497 Professional fees 7,337 - 7,337 Occupancy and equipment rentals 8,235 - 8,235 Business development 2,609 - 2,609 3,936 3,936 - Other 10,767 - 10,767 $ 201,913 $ 7,005 $ 194,908 Regulation G Reconciliation of Non-GAAP Financial Measures (Continuing Operations) 17 Total expenses exclude transaction-based expenses which fluctuate based on market conditions and client activity.
1 3 months ended June 30, 2014 Writedown of assets, lease loss accrual and capitalized debt costs Communications and data processing Total expenses 1 |
 GAAP Adjustments for non-GAAP presentation KCG non-GAAP, normalized expenses normalized expenses: 122,319 - 122,319 36,796 - 36,796 20,103 - 20,103 9,524 - 9,524 5,402 - 5,402 8,285 - 8,285 1,683 - 1,683 7,823 7,823 - 8,643 - 8,643 Total expenses 1 $ 220,578 $ 7,823 $ 212,755 Regulation G Reconciliation of Non-GAAP Financial Measures (Continuing Operations) 18 1 Total expenses exclude transaction-based expenses which fluctuate based on market conditions and client activity.
3 months ended March 31, 2014 Reconciliation of GAAP expenses to KCG non-GAAP, Communications and data processing
Lease loss accrual and writedown of
capitalized debt costs Employee compensation and benefits
Depreciation and amortization Debt interest expense
Professional fees Occupancy and equipment rentals Business development
Other |
 Regulation G Reconciliation of Non-GAAP Financial Measures (Continuing Operations) 19 1 Total expenses exclude transaction-based expenses which fluctuate based on market conditions and client activity.
GAAP
Adjustments for
non-GAAP presentation
KCG non-GAAP, normalized
expenses
Employee compensation and benefits
112,209
11,409
100,800
37,512
-
37,512
Depreciation and amortization
19,566
-
19,566
Debt interest expense
12,943
-
12,943
Professional fees
7,734
2,491
5,243
Occupancy and equipment rentals
9,358
-
9,358
Business development
1,923
-
1,923
23,709
23,709
-
Other
13,066
294
12,772
Total
expenses
1 $ 238,020 $ 37,903 $ 200,117 3 months ended December 31, 2013
Lease loss accrual and writedown of
capitalized debt costs Reconciliation of GAAP expenses to KCG non-GAAP, normalized expenses:
Communications and data processing |
 Regulation G Reconciliation of Non-GAAP Financial Measures (Continuing Operations) 20 1 Total expenses exclude transaction-based expenses which fluctuate based on market conditions and client activity.
GAAP
Adjustments for
non-GAAP presentation
KCG non-GAAP, normalized
expenses
Employee compensation and benefits
129,631
17,441
112,190
44,046
-
44,046
Depreciation and amortization
20,091
-
20,091
Debt interest expense
19,350
2,982
16,368
Professional fees
9,077
4,087
4,990
Occupancy and equipment rentals
8,898
-
8,898
Business development
2,644
200
2,444
936
936
-
Other
11,318
-
11,318
TotalExpenses
1 $ 245,991 $ 25,647 $ 220,345 Writedown of assets and lease loss accrual, net
Reconciliation of GAAP expenses to KCG
non-GAAP, normalized expenses:
Communications and data processing 3 months ended September 30, 2013
|
 |