Attached files
| file | filename |
|---|---|
| EX-99.1 - EX-99.1 - TALEN ENERGY SUPPLY, LLC | d937235dex991.htm |
| 8-K - FORM 8-K - TALEN ENERGY SUPPLY, LLC | d937235d8k.htm |
 Talen Energy
June 2015 Investor Presentation
Creating Value from Day 1
We Generate Energy for a Brighter Tomorrow
Exhibit 99.2 |
 ©
Talen Energy Corporation 2015
2
Safe Harbor
Forward Looking Statements:
Any statements made in this presentation about future
operating results or other future events are forward-looking
statements under the Safe Harbor Provisions of the Private
Securities Litigation Reform Act of 1995. Actual results may
differ materially from such forward-looking statements. A
discussion of factors that could cause actual results or
events to vary is contained in the Supplemental Information
to this presentation and in the Company’s SEC filings,
including
the
factors
discussed
under
“Risk
Factors”
in
the
Company’s Registration Statement on Form S-1.
|
 ©
Talen Energy Corporation 2015
3
Agenda
Introduction to Talen Energy
Commercial & Operational Overview
Financial Overview
Key Investment Considerations
Q&A
P. Farr
P. Farr
J. McGuire
P. Farr |
 ©
Talen Energy Corporation 2015
4
Introduction to Talen Energy |
 ©
Talen Energy Corporation 2015
5
Talen in 20
Great Assets
Attractive Markets
Strong
Balance Sheet
Execution Track
Record
Focused on
Free Cash Flow
Poised for Growth
Significant |
 ©
Talen Energy Corporation 2015
6
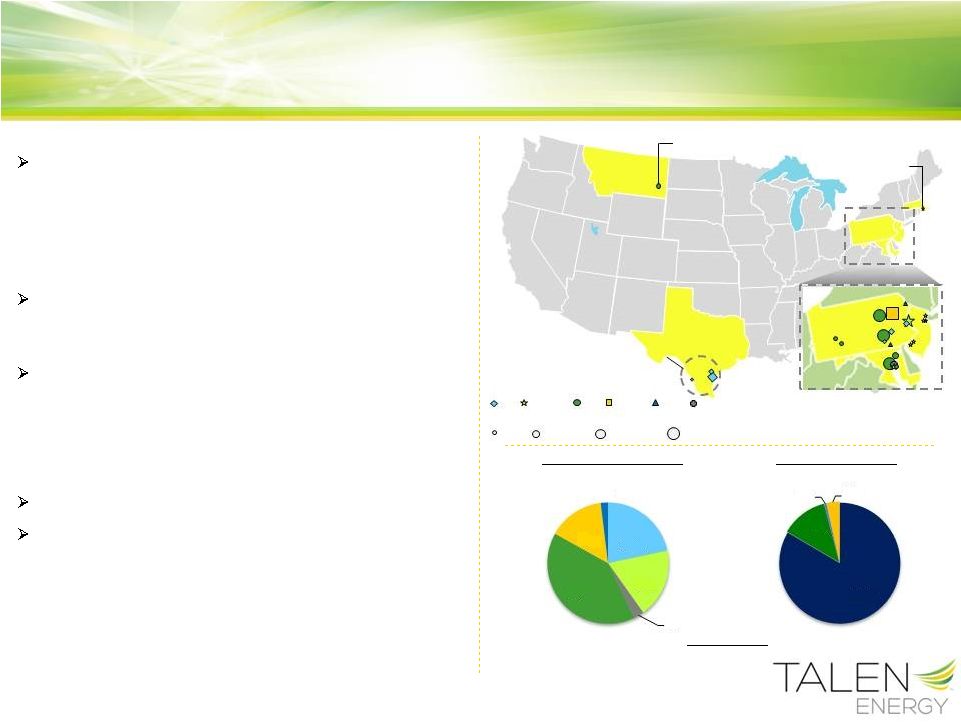
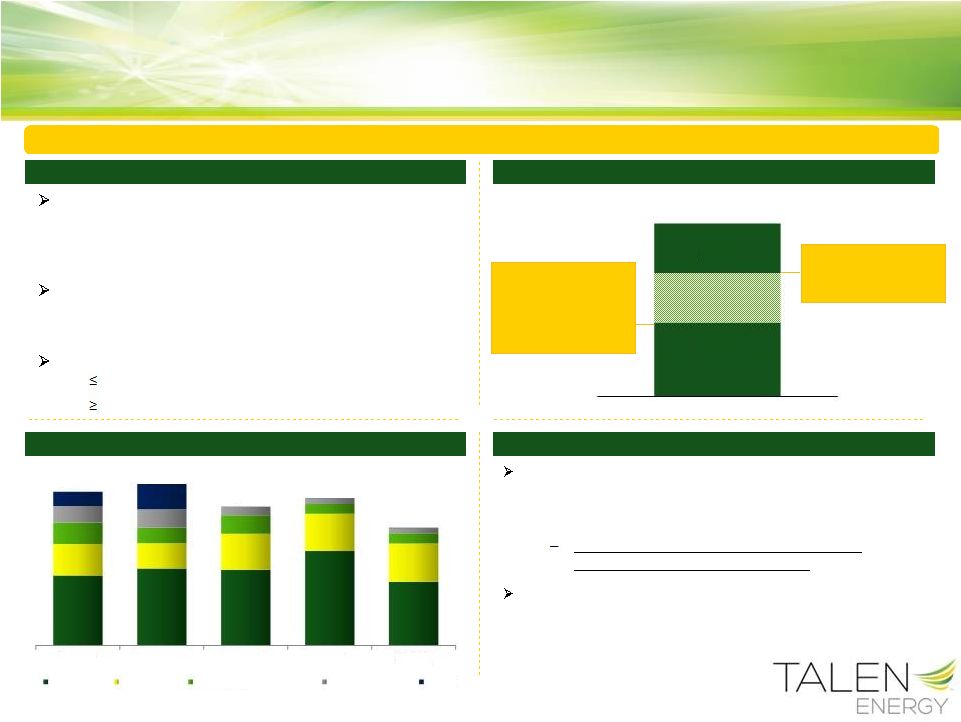
Re-Introducing Talen Energy
New independent power producer (“IPP”) formed by
the contemporaneous spin-off of PPL Energy Supply
(“Energy Supply”) and synergistic merger with RJS
Power Holdings (“RJS”), a portfolio company of
Riverstone Holdings that owned conventional
competitive power generation assets
Assets primarily located in two of the largest and
most liquid, competitive electricity markets in the
United States: PJM and ERCOT
A highly diverse fleet with multiple ways to capture
value including:
-
Flexible gas and highly efficient coal units
-
Significant carbon-free nuclear capacity
-
Portfolio optimizing dual-fuel capability
Strong balance sheet with superior growth prospects
Management team with extensive experience in
competitive power generation, a demonstrated track
record of strong operations, solid market calls and
ahead-of-the-curve strategic execution
Note: Does not reflect sale of approximately 1.3 GW of generating capacity that is
required to comply with the FERC Order MT
PA
TX
NJ
MD
530 MW ownership in
Colstrip facility
1,900 MW of flexible
CCGT and CT natural gas
generation in ERCOT
Over 12,500 MW of
PJM generation with
a diverse fuel mix
89 MW
Dartmouth
facility
MA
Capacity by Market
Capacity by Fuel Type
Gas
Dual
Fuel
Coal
Nuclear
Hydro
Fuel Type
Operating Capacity (MW)
< 300
300
–
750
750 –
1,000
> 1,000
15,079 MW
Oil
Hydro/Renewables
Natural Gas
Dual Fuel
Oil
Coal
Nuclear
WECC/MT
ISO-NE
PJM
ERCOT
83%
12%
1%
4%
22%
18%
3%
40%
15%
2% |
 ©
Talen Energy Corporation 2015
7
Merger with RJS creates a vibrant company with sufficient scale and asset
diversity to be an attractive and competitive IPP
Clear line-of-sight cost synergies and portfolio margin benefits
Valuation multiple expansion
Benefits derived from consolidation are an extremely powerful lever for value
creation Rate regulated utilities and competitive generation in the same
corporate structure does NOT optimize value
Freedom to pursue strategies as a pure-play IPP with respect to:
-
Hedging and portfolio management
-
Capital allocation
-
Growth
Creates Immediate
Shareowner
Value
Provides
Significant,
Sustainable
Long-Term Value
Formation of
Talen Energy
Validates the Thesis
Talen Energy Value Proposition
Then
Now
Value Creation
EPS / Decrease Volatility / Support Dividend
Cash Flow / Consolidation / Synergy Capture
Growth
Negative: Sell downs to raise capital
Significant: Talen Energy a result of consolidation
Asset Diversity
Fuel Only
Fuel + Markets
Liquidity & Hedging
Longer-term / Excess Liquidity / Ratings Driven
Shorter-term / Adequate Liquidity / Extrinsic Capture
A Complete Transformation |
 ©
Talen Energy Corporation 2015
8
Talen Energy’s Strategy
Safety is a core value
Value is built on a foundation of excellence in operations
Strong unit availability and performance during extreme load periods
The balance sheet is a strategic asset
Enhanced flexibility and capacity
Absorb volatility and pursue growth opportunities
Management incentives aligned with investors driven by EBITDA and free
cash flow
Cash generation fuels growth and investment opportunities
Investment for growth subject to rigorous returns-based analysis
Primary focus on delivering visibility 1-year forward
Manage and monetize intra-year volatility
Retail activities oriented to hedge the generation fleet in related markets
Safety &
Excellent Plant
Operations
Strategic Balance
Sheet Management
Strong Cash
Returns
Active Hedging &
Portfolio
Management
Growth Focus
Growth in value, not size alone
Right assets in the right markets
Not restricted by markets or fuel types |
 ©
Talen Energy Corporation 2015
9
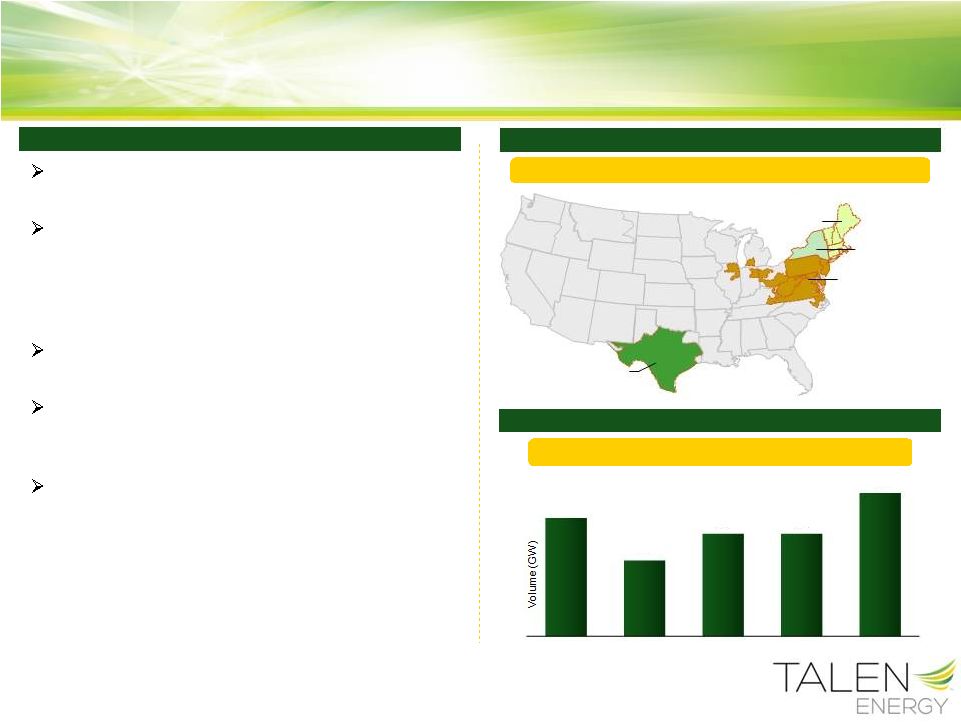
ERCOT –
75 GW
Focus
on
Growth
in
Key,
Competitive
Markets
(1)
Key Growth Initiatives & Opportunities
Talen Energy’s Growth Prospects
Robust Competitive Power Asset Market
Focused on liquid, developed competitive
markets
Operating assets have a priority over
development opportunities
–
Immediate cash flow and EBITDA contribution
–
Synergies fit with existing portfolio value capture
and risk mitigation
Recent history reflects a very robust market for
competitive generation assets
Approximately 300
GW
(1)
of market-based
generation capacity in key markets; provides
significant opportunity for growth
Select development sites and repowering
opportunities within Talen Energy portfolio
currently being evaluated
Source: SNL
(1) Excludes generation capacity from principal competitive generators (CPN,
DYN, NRG, TLN and EXC) About 350 GW sold over past 5 years
PJM –
130 GW
NYISO –
60 GW
ISO-NE –
25 GW
Substantial acquisition opportunity in key markets
75
48
65
65
91
2010
2011
2012
2013
2014 |
 ©
Talen Energy Corporation 2015
10
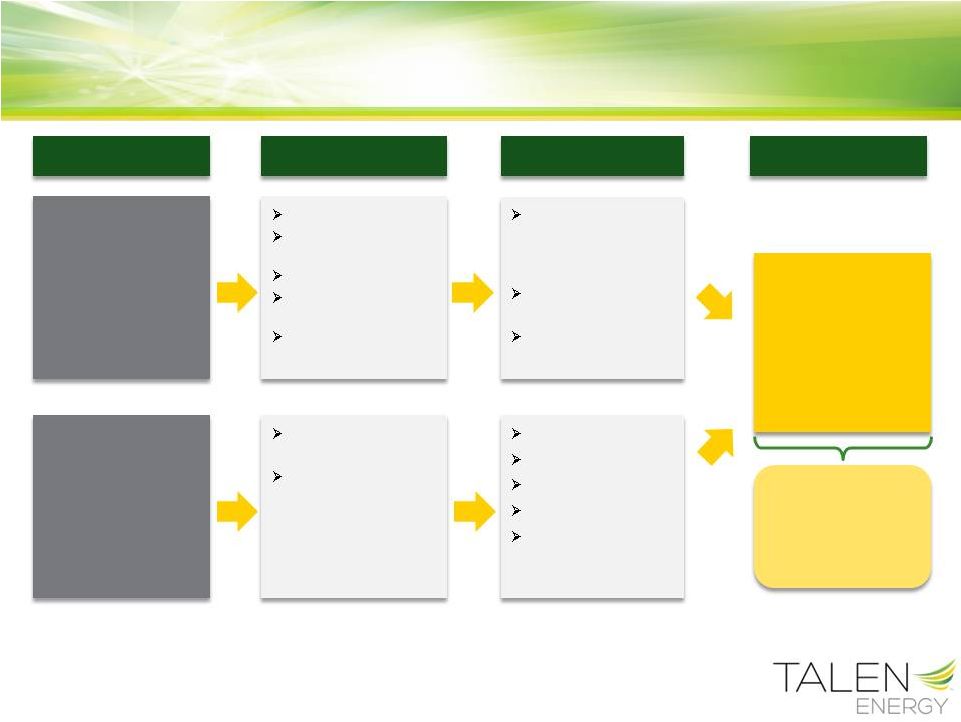
Talen Energy Measures of Success
Goals based on these
metrics form the
backbone of
management incentive
compensation
Operations
Focus
Execution
Key Metrics
Result
Growth
Sustainable
share price
appreciation
driven by
improvements in
EBITDA and Free
Cash Flow
Safety
O&M and Capex
efficiency
Availability
Beyond plan
synergies
Asset
commercialization
Disciplined strategic
acquisitions
Select “in inventory”
development and
repowering
opportunities
Employee lost time,
OSHA recordables,
Total Case Incidence
Rate (TCIR)
$/MW & $/MWh: G&A,
O&M, Totex
Commercial
Availability
IRR
Synergies
Cash flow accretion
Portfolio effects
Credit impacts |
 ©
Talen Energy Corporation 2015
11
Seasoned leaders with the right experience to successfully execute Talen
Energy’s strategy Extensive Operational Experience
Management team has extensive experience in fossil and
nuclear power generation, commercial operations, strategy,
corporate finance and governance
Senior leadership team averages nearly 30 years of
experience in the power sector
Extensive public company experience
Strong Board comprised of individuals with competitive,
sector and technology-specific experience
Strong History of Strategic Execution
PPL’s cash acquisition of E.ON U.S. LLC, parent company of
Louisville Gas & Electric Company and Kentucky Utilities
Company, for $7.6 billion in 2010
PPL’s acquisition of Central Networks from E.ON UK plc for
$5.8 billion in cash and assumption of $800 million of existing
public debt in 2011
PPL’s acquisition of 660 MW Ironwood CCGT for a cash
purchase price of $85 million and $217 million of net project
debt in 2012
PPL’s sale of hydroelectric facilities in Montana to
NorthWestern Energy Corporation for $900 million in cash in
2014
Management Bios
Paul Farr
President, Chief Executive Officer and Director
•
Previously the President of PPL Energy Supply
•
Served as Executive Vice President and CFO of PPL for seven years
•
Five years leading PPL’s International Operations and Strategy
function
Jeremy McGuire
Senior Vice President and Chief Financial Officer
•
Previously the Vice President of PPL Strategic Development
•
Served as a Director in the Global Power & Utilities Group at Lehman
•
20 years of financial advisory and strategic and capital markets
execution experience
Russ Clelland
Vice President and Treasurer
•
Previously the Assistant Treasurer and VP at PPL
•
Has more than 35 years of experience in corporate finance
Joe Hopf
Senior Vice President and Chief Commercial Officer
•
Previously Senior VP -
Fossil and Hydro Generation at PPL
•
Has more than 30 years experience in the electricity generation and
marketing business, as well as expertise in risk management and
credit
Tim Rausch
Senior Vice President and Chief Nuclear Officer
•
Previously Senior VP -
Chief Nuclear Officer at PPL
•
Has 25 years of experience in virtually every discipline of the
nuclear power industry
Experienced Management Team |
 ©
Talen Energy Corporation 2015
12
Commercial & Operational Overview |
 ©
Talen Energy Corporation 2015
13
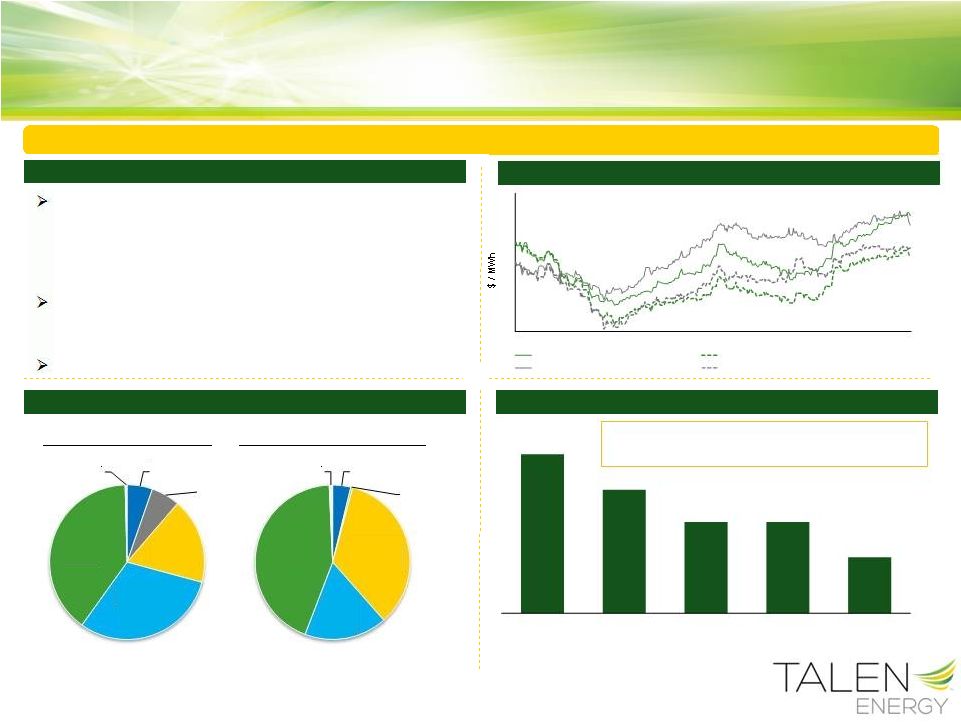
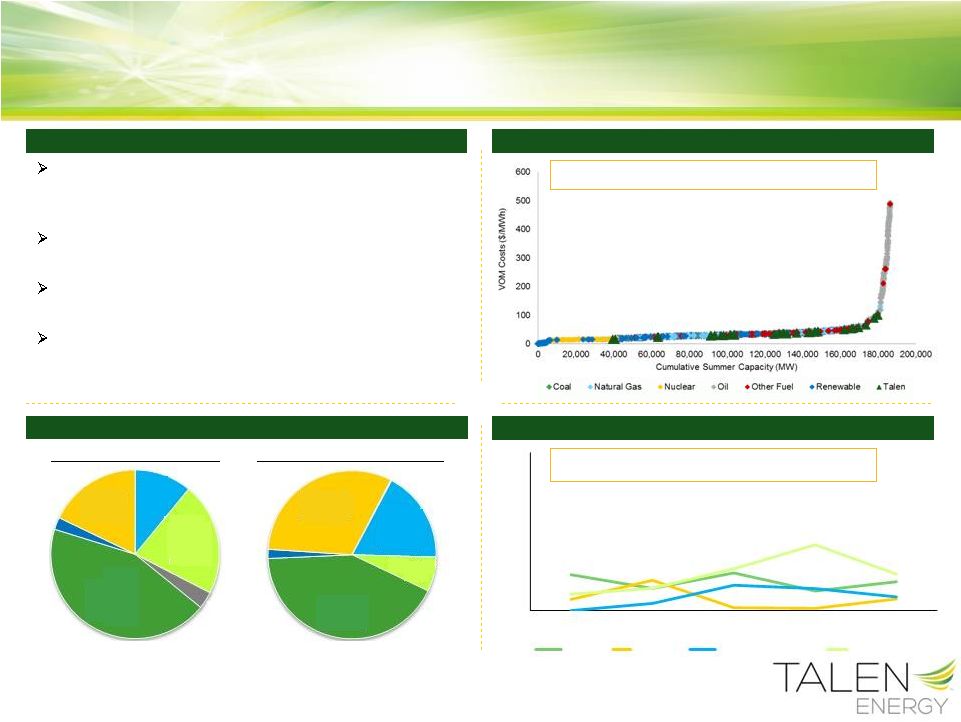
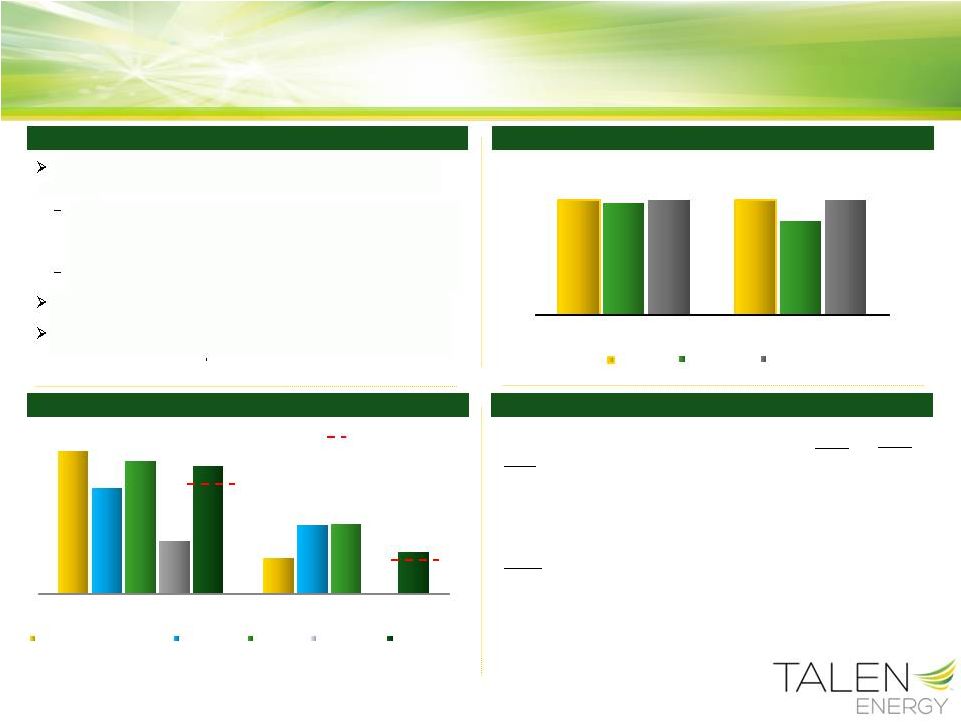
Source: Monitoring Analytics, LLC’s 2014 State of the Market Report for
PJM PJM Highlights
2014
PJM
Fuel
Mix
(1)
Strong capacity market, plant retirements and market reforms support long-term
fundamentals Supportive market fundamentals due to limited import
capacity, significant capacity retirements, improving
demand outlook, and a forward capacity market
providing cash flow certainty to generation asset
owners
Projected Decrease in Reserve Margins
Reserve margin decline driven by retirements of less-
efficient coal generators facing rising environmental costs
and challenged dark spreads
Source: PJM’s February 2, 2015 Forecasted Reserve Margin Graph
Capacity by Fuel Type
Generation by Fuel Type
(1)
Installed capacity as of December 31, 2014 and generation breakdown from January 1
to December 31, 2014 Exposure to Key Markets –
PJM
PJM Spark Spreads
16
22
24
26
5/1/14
6/1/14
7/1/14
8/1/14
9/1/14
10/1/14
11/1/14
12/1/14
1/1/15
2/1/15
3/1/15
4/1/15
18
20
PJM West Hub On-Peak vs Henry Hub -
2016
PJM West Hub On-Peak vs Henry Hub -
2017
PJM West Hub On-Peak vs TETCO M-3 -
2016
PJM West Hub On-Peak vs TETCO M-3 -
2017
21.4%
20.2%
19.1%
19.1%
17.9%
2015E
2016E
2017E
2018E
2019E
Renewables
5%
Oil
6%
Nuclear
18%
Natural Gas
31%
Coal
40%
Other
<1%
Renewables
4%
Oil
<1%
Nuclear
34%
Natural
Gas
17%
Coal
44%
Other
1%
PJM capacity performance product supports potential
capacity price increase, benefiting reliable generation
units
Increasing spark spreads due to lower gas prices |
 ©
Talen Energy Corporation 2015
14
(1)
Excludes EFORd for 354 MW of combustion turbines; EFORd: Equivalent Forced Outage
Rate demand (2)
Includes Ironwood and Lower Mount Bethel
(3)
Excludes statistics for 354 MW of combustion turbines
Diverse PJM Dispatch Capabilities
Talen Energy’s PJM Fuel Mix
PJM Fleet Highlights
Talen Energy’s assets are diverse in fuel and dispatch,
providing operational flexibility and reliable generation to
PJM under a variety of market conditions
Assets earn strong capacity revenues that provide
margin support and predictability
Assets positioned across various regions and serve as
natural hedges to basis risk from congestion constraints
Expansion and development capabilities provide
opportunities to enhance the portfolio
2011 –
2014 EFORd
(1)
The Right Assets in Key Markets –
PJM
Capacity by Fuel Type
Generation by Fuel Type
Strong unit availability an important factor in Capacity
Performance auction outcomes
12,553 MW
Well situated to serve retail and default supply load
0%
5%
10%
15%
20%
25%
2011
2012
2013
2014
Average
Coal
Nuclear
Natural Gas CCGT
Natural Gas/ Oil
(2)
(3)
Natural
Gas
11%
Dual
Fuel
22%
Oil
3%
Coal
44%
Hydro
2%
Nuclear
18%
Natural
Gas
18%
Dual Fuel
7%
Coal
42%
Hydro
2%
Nuclear
31%
Note: Does not reflect sale of approximately 1,300 MW of generating capacity
that is required to comply with the FERC Order or immaterial renewable capacity |
 ©
Talen Energy Corporation 2015
15
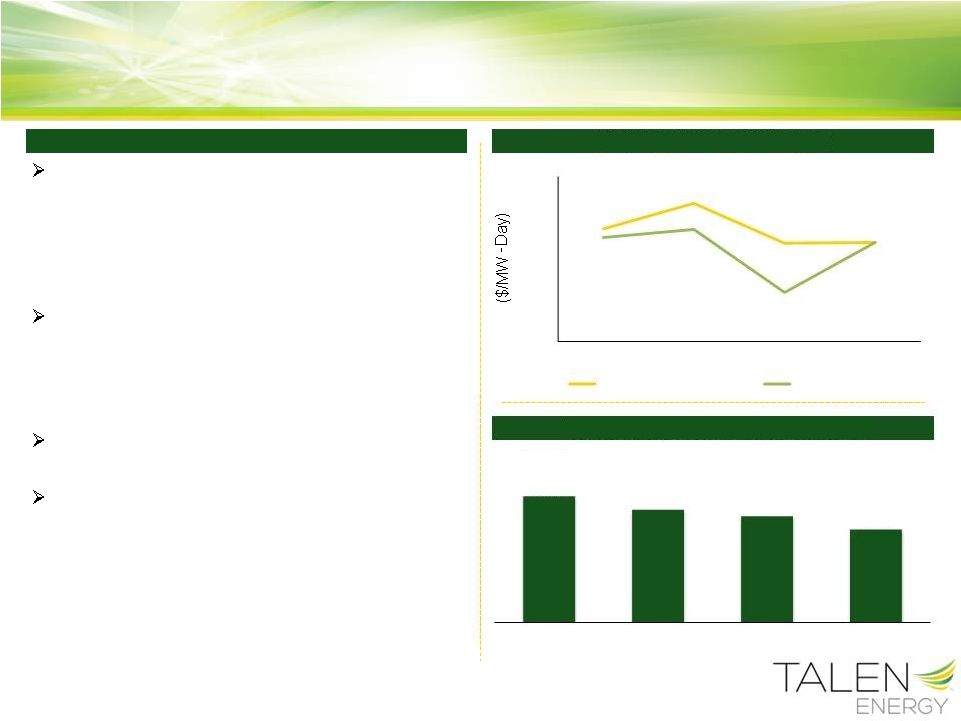
Historical Capacity Prices
PJM Capacity Performance (“CP”) Product
Proposal to add enhanced product to the
capacity market structure to provide additional
compensation for generators to make
necessary investments to maintain system
reliability in exchange for stronger performance
requirements
If approved by FERC, Capacity Performance is
expected to benefit generators like Talen
Energy that have demonstrated reliability
during peak load and extreme weather
conditions
Project 95% of fleet to be eligible to be bid in as
“CP”
under proposed rules
Fleet is substantially leveraged to PJM capacity
prices –
a $10/MW Day increase = a projected
~$45
million increase in potential capacity
revenues
Talen Energy Capacity Revenues
Leverage to PJM Capacity Prices
($ in millions)
$0
$25
$50
$75
$100
$125
$150
$175
$200
2014/2015
2015/2016
2016/2017
2017/2018
PJM MAAC & SWMAAC
PJM RTO
$733
$655
$618
$540
2014
2015E
2016E
2017E |
 ©
Talen Energy Corporation 2015
16
Above-average historical demand growth, increasing price caps
and an increasing reliance on flexible and quickly-dispatchable
natural gas-fired assets
ERCOT’s supply stack can provide significant margin opportunities
driven by unforeseen weather anomalies coupled with variability,
resulting in periods of extremely high power prices known as
“scarcity pricing”
-
Electricity prices are subject to a system-wide offer cap of
$9,000/MWh
The Texas population and gross state product (“GSP”) are growing
well above the national rate
ERCOT System-Wide Offer Cap ($/MWh)
2014 ERCOT Fuel Mix
Tracking double the
national average
Texas GSP / U.S. GDP Growth Rate
Sources: ERCOT, Bureau of Economic Analysis, Texas Office of
Comptroller and Federal Open Market Committee ERCOT Highlights
Capacity
by
Fuel
Type
Generation
by
Fuel
Type
Exposure to Key Markets –
ERCOT
0.7%
(0.5%)
3.0%
4.2%
6.9%
3.7%
3.8%
2.6%
3.8%
3.7%
(0.6%)
(2.7%)
2.2%
1.6%
2.5%
1.8%
2.4%
2.5%
2.5%
2.2%
(4.0%)
(2.0%)
0.0%
2.0%
4.0%
6.0%
8.0%
2008
2009
2010
2011
2012
2013
2014(E)
2015E
2016E
2017E
Texas GSP
U.S. GDP
$1,500
$2,250
$3,000
$3,000
$3,000
$4,500
$5,000
$7,000
$9,000
2007
2008
2009
2010
2011
2012
2013
2014
2015
Coal
16%
Natural Gas
60%
Nuclear
2%
Renewables
21%
Other
1%
Wind
14%
Nuclear
6%
Coal
24%
Natural
Gas
55%
Other
1%
Positive outlook due to strong demand growth and increased price caps |
 Highly reliable, flexible natural gas fleet designed to ramp
up quickly to support grid stability
-
Majority of units ramp up at 20 MW per minute
Opportunities to take advantage of higher scarcity pricing
in ERCOT due to weather variability, unplanned
transmission and generation outages, and potential coal
generation retirements resulting from upcoming EPA
regulations
-
Potential scarcity pricing benefits: a one hour
period at the $9,000/MWh cap equates to about
$20 million in revenue
Quick-Dispatch Assets Positioned for Scarcity
Supportive Ancillary Revenues
ERCOT Fleet Highlights
Declining Reserve Margins
The Right Assets in Key Markets –
ERCOT
(1)
Assumes all owned ERCOT generation is running and unhedged when prices hit
system-wide offer cap (1)
Source: SNL
Source: 5/4/15 ERCOT CDR Report
13.75% Target Reserve Margin
0
100
200
300
400
500
600
0
20,000
40,000
60,000
80,000
100,000
Coal
Natural Gas
Other Fuel
Oil
Renewable
Nuclear
Talen
76%
83%
79%
24%
17%
21%
2012
2013
2014
Energy Revenue
Ancillary Revenue
17
©
Talen Energy Corporation 2015
17.0%
18.5%
21.4%
18.7%
17.1%
16.1%
14.6%
13.2%
11.8%
10.4%
2016
2017
2018
2019
2020
2021
2022
2023
2024
2025
Cumulative Summer Capacity (MW) |
 ©
Talen Energy Corporation 2015
18
Hedging & Commercial Management Strategy
Note: As of March 31, 2015
Hedging & Commercial Strategy
Coal and Nuclear Fuel Hedge Levels
Portfolio Generation Hedge Position
Average Hedge Prices
Portfolio Targets
Focused on providing margin and cash flow visibility on a
one year forward basis
Lower level of financial leverage and strong liquidity
allow for greater resilience to operating cash flow
volatility enabling a shorter-term hedging program
Substantially reduces program costs
Execute strategies in both wholesale and retail markets
Utilize FTRs and basis swaps to reduce the risk of price
differentials between plants and hubs
75%
25%
2015
2016
East:
Power: Nuclear/Coal/Hydro ($/MWh)
$41-43
$44-46
Spark Spread ($/MWh)
$10-11
$8-9
Consumed Coal (Delivered $/ton)
$73-75
$72-74
West:
Power: Coal ($/MWh)
$40-42
$39-41
Spark Spread ($/MWh)
$14-15
-
Consumed Coal (Delivered $/ton)
$27-31
$27-33
100%
25%
74%
48%
93%
49%
37%
0%
90%
29%
2015
2016
East Nuclear, Coal & Hydro
East Gas/Oil
West Coal
West Gas/Oil
Total Portfolio
100%
100%
97%
81%
100%
100%
2015
2016
Nuclear
East Coal
West Coal
©
Talen Energy Corporation 2015
18 |
 ©
Talen Energy Corporation 2015
19
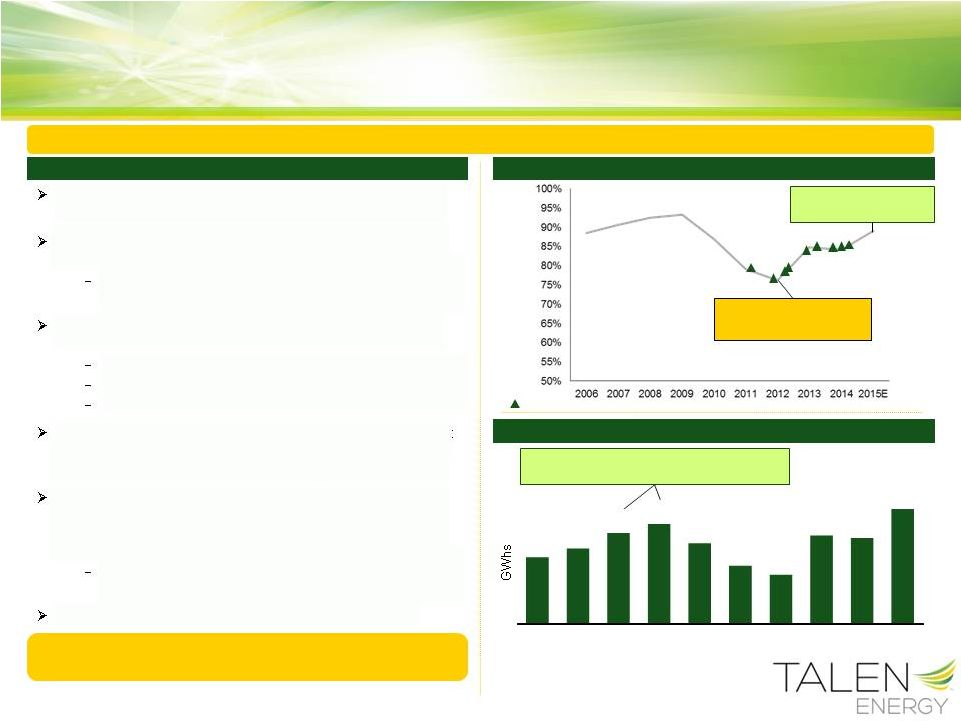
Turbine Blade Design Issues Resolved
Historical Equivalent Availability (“EQA”)
Historical Station Output
Lower EQA primarily driven
by turbine blade cracking
Turbine blade related outage
Set operational records in back-to-back
years prior to turbine blade cracking
Strong track-record of safety and performance
May 2011: First identified cracked blades on both units; first
instance for Siemens
2011 –
2014: 10 blade-related outages; first one lasted 38
days, more recent outages were as little as 12 days
Installation of monitoring gear allowed operations to proceed
within OEM specifications
2014: Installed new shorter last stage blade design on one
turbine
Seeing significantly reduced blade tip vibration
No evidence of root cracking
Plant efficiency unaffected
2015: Completed Root Cause Analysis confirming equipment
deficiencies and installed short blades on two Unit 2 turbines
during scheduled refueling outage
2016: Will install short blades on two additional Unit 1
turbines and perform validation inspections on short blades
installed in 2014 as part of the scheduled Unit 1 refueling
outage
Expect validation inspections to confirm short blade solution
efficacy
2017: Will install short blades on final Unit 2 turbine
Project ~89% EQA for
2015 –
highest in 6 years
No special turbine-related maintenance outages
are projected 2015 or thereafter
©
Talen Energy Corporation 2015
19
16.0
16.4
17.1
17.5
16.7
15.6
15.2
17.0
16.9
18.2
2006
2007
2008
2009
2010
2011
2012
2013
2014
2015
E
Susquehanna Nuclear Operations |
 ©
Talen Energy Corporation 2015
20
Financial Overview |
 ©
Talen Energy Corporation 2015
21
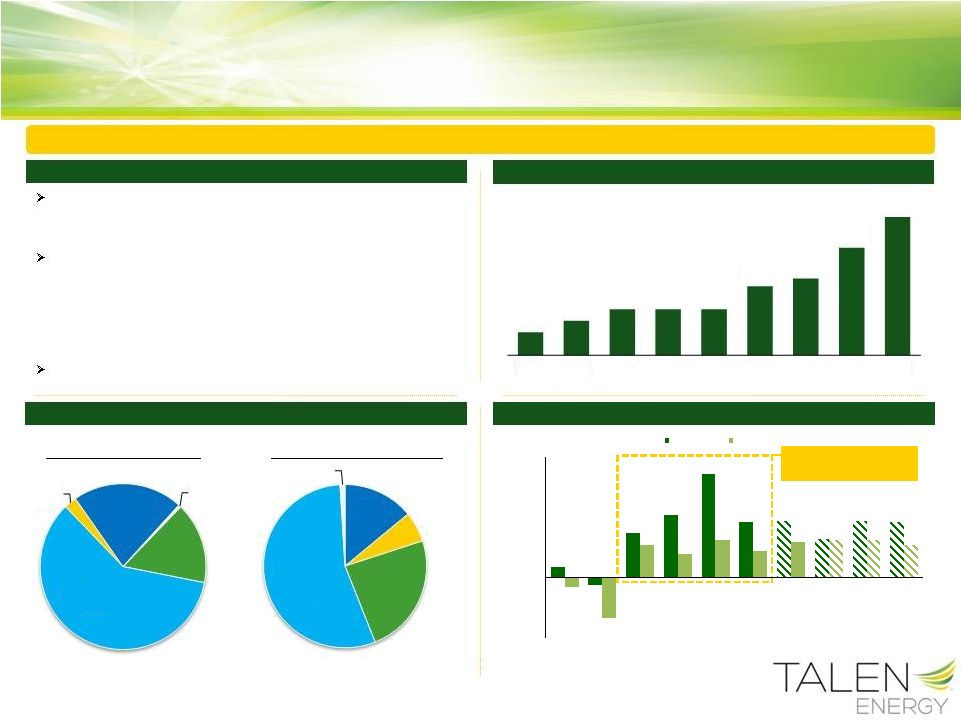
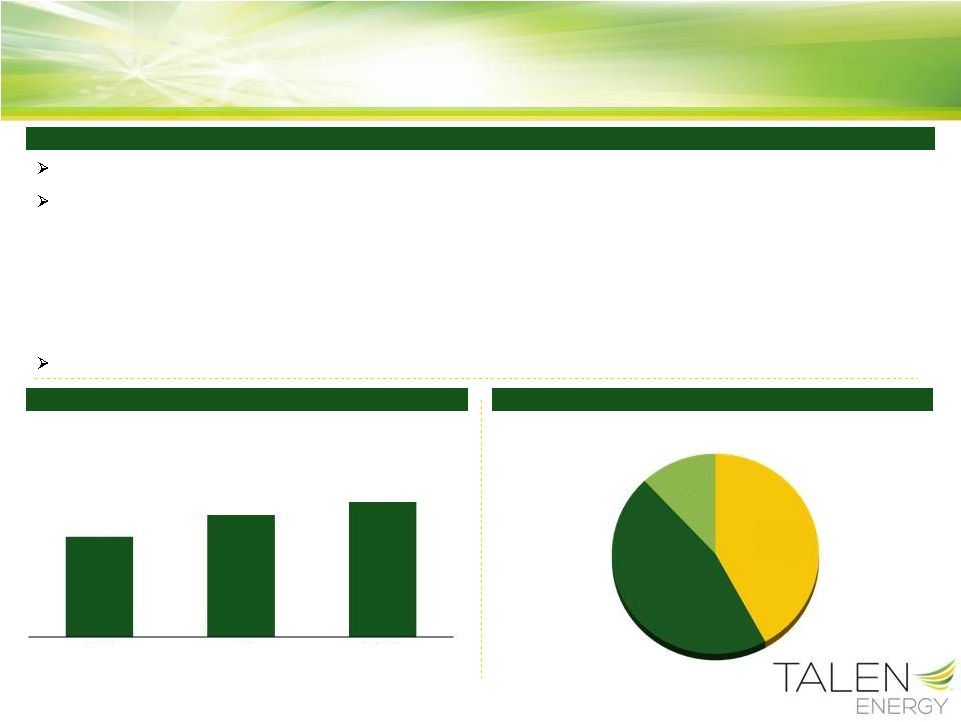
Expected Synergies
On track to deliver at least $155 million on an annual basis by 2017 as originally
forecasted Synergy attainment through multiple channels:
-
Overhead reductions
-
Asset focused commercial strategy
-
Streamlined operational workforce
-
Supply chain savings through greater discounts and enhanced inventory
management -
Margin
enhancement
through
improved
fuel
sourcing
and
commercial
management
-
Fleet-wide economies of scale
Infrastructure in place to add MWs in a cost-effective manner
Synergies
Projected Synergies
($ in millions)
Breakdown of Projected Synergies
$155 million
$115
$140
$155
2015
2016
2017
Operations
42%
Overhead
46%
Margin
12% |
 ©
Talen Energy Corporation 2015
22
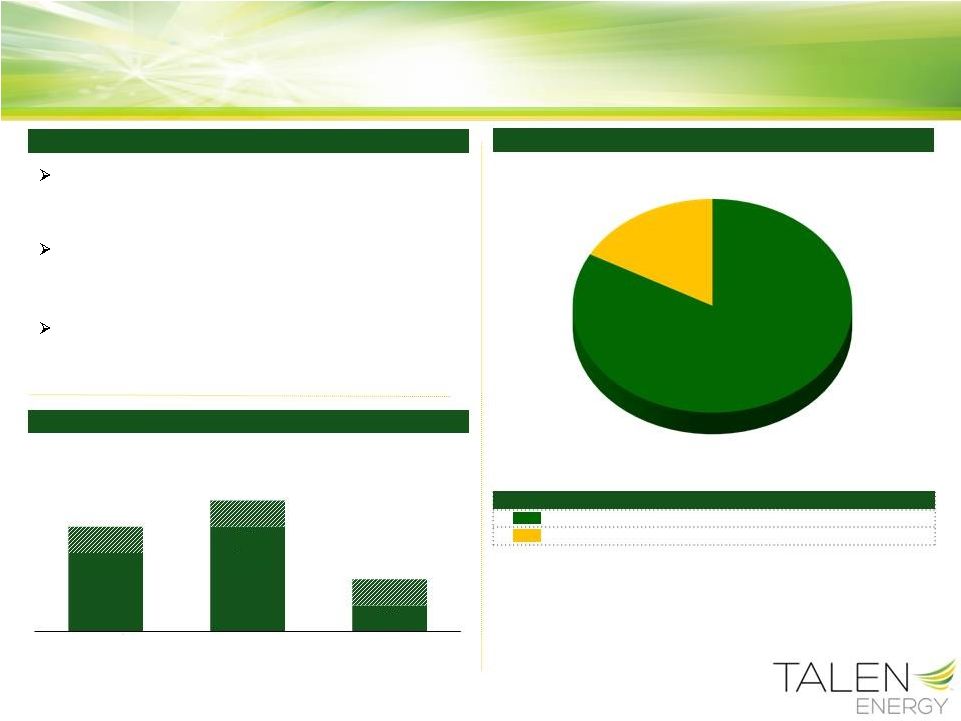
Transition Support Costs
($ in millions)
Estimated TSA Costs by Category
Projected Range for TSA Cost
Category
% of Total Cost
Information Technology
84%
Business Support
(2)
16%
Transition Service Agreements (TSAs)
TSAs are temporary agreements put in place to
help facilitate Talen Energy’s transition to its new
operating model
Transition services are contractually available for
up to two years
-
Talen Energy expects to end TSAs by early 2017
The largest portions of service costs support the
development of reliable information technology
systems and infrastructure
(1)
TSA costs to begin June 1, 2015
(2)
Business Support includes Financial, Legal, Human Resources, Facilities, and
Commercial Services (1)
$30
$40
$10
$40
$50
$20
2015
2016
2017 |
 ©
Talen Energy Corporation 2015
23
Notes: Does not reflect sale of approximately 1.3 GW of generating capacity
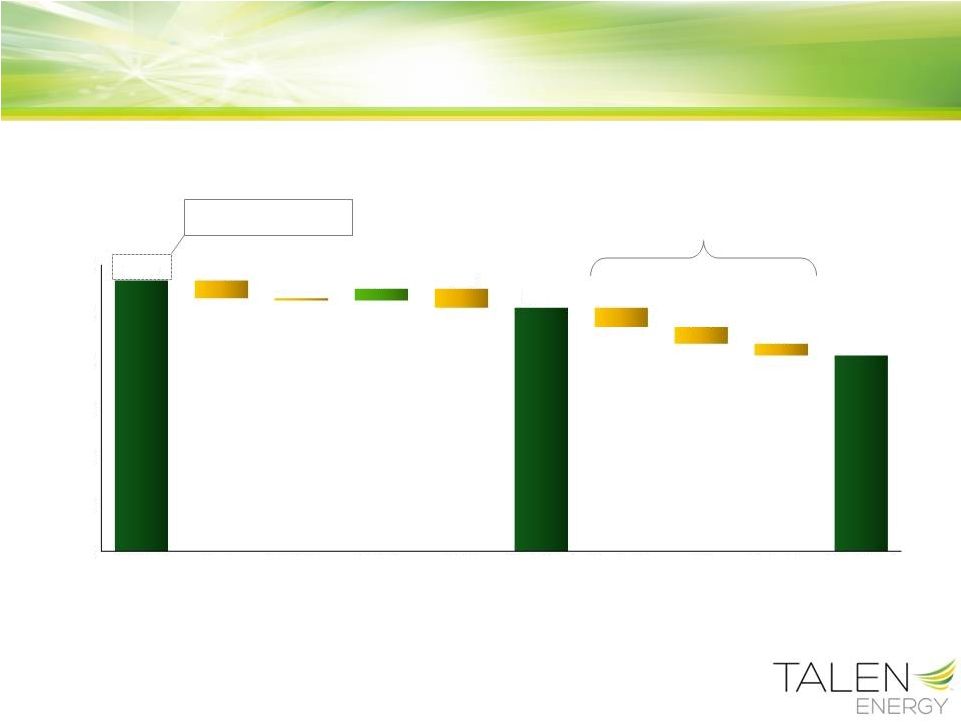
that is required to comply with the FERC Order 2015 Adjusted EBITDA
Expected transitional or
restructuring costs that will not be
experienced on a “run-rate basis”
(2)
(3)
(1)
($ millions)
Estimate provided at 6/9/2014
transaction announcement
$1,067
$1,010
$910
$25
($37)
($5)
($40)
($40)
($35)
($25)
$500
$600
$700
$800
$900
$1,000
$1,100
2015 Model
Year EBITDA
Margins
O&M & Other
Net ARO
Expense
Partial
Synergies
2015 Adjusted
EBITDA
Pre-spin PPL
Charges
TSA
Restructuring
Cost
2015 Adjusted
EBITDA,
including special
items (Midpoint)
(1)
Additional item identified as an adjustment to EBITDA, but was not adjusted in the
original $1,067 million model year EBITDA estimate. Net ARO expense means
ARO expense net of NDT income (2)
Synergies below full run-rate projection of $155 million per year
(3)
Reflects 3 months of Energy Supply actuals
Refer to “Supplemental Information – Regulation G Reconciliations” for reconciliation
of non-GAAP financial measures
|
 ©
Talen Energy Corporation 2015
24
2015 Guidance
($ in Millions)
Low
Mid
High
EBITDA:
Adjusted EBITDA
$935
$1,010
$1,085
Adjusted EBITDA, including special items
$835
$910
$985
Free Cash Flow:
Adjusted
Free
Cash
Flow
$265
$340
$415
Adjusted Free Cash Flow, including special items
$205
$280
$355
Projected Net Debt Outstanding at 12/31/2015
$3,700
Projected Net Debt / Adjusted EBITDA
3.7x
(1)(2)
(2)
(3)
(1)
(1)
Special items include pre-spin PPL charges, TSA costs and restructuring costs
(2)
Does not include growth capex of $48 million
(3)
Includes projection of $170 million in short-term debt outstanding
Notes: Does not reflect sale of approximately 1.3 GW of generating capacity that is required to
comply with the FERC Order
Refer to “Supplemental Information – Regulation G Reconciliations” for reconciliation
of non-GAAP financial measures |
 ©
Talen Energy Corporation 2015
25
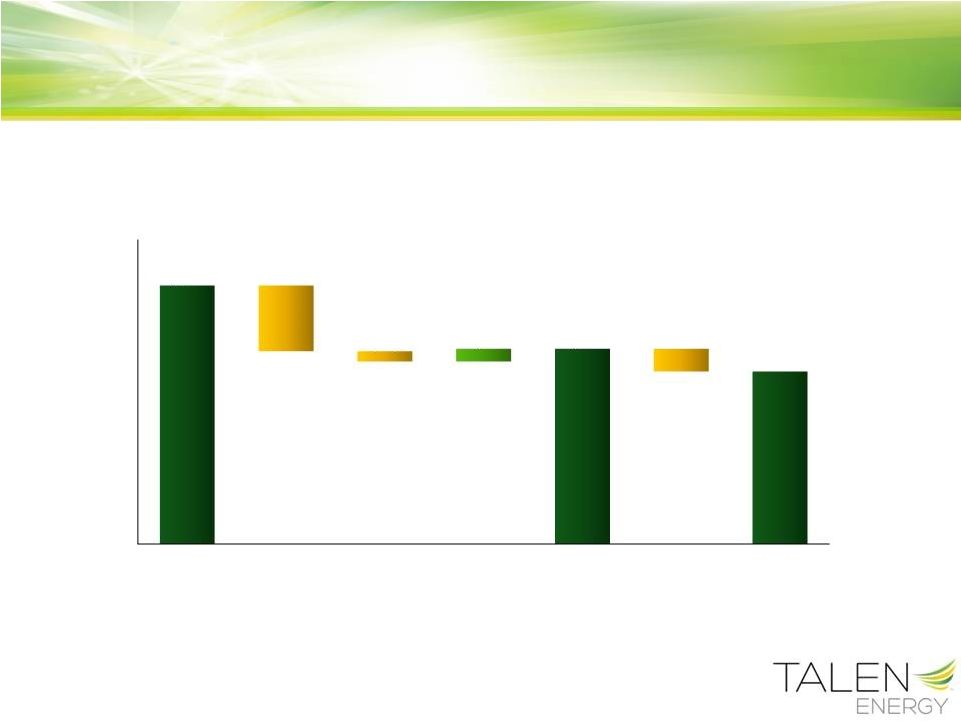
2016 Adjusted EBITDA
($ millions)
$1,010
$885
$840
$25
($130)
($20)
($45)
$500
$600
$700
$800
$900
$1,000
$1,100
2015 Adjusted
EBITDA
Margins
O&M & Other
Partial
Synergies
2016 Adjusted
EBITDA
TSA
2016 Adjusted
EBITDA,
including special
items (Midpoint)
Notes: Does not reflect sale of approximately 1.3 GW of generating capacity that is required to
comply with the FERC Order
Refer to “Supplemental
Information – Regulation G Reconciliations” for reconciliation of non-GAAP financial measures
(1)
(1) Reflects year-over-year increase in expected synergies to
$140 million in 2016 from $115 million in 2015 |
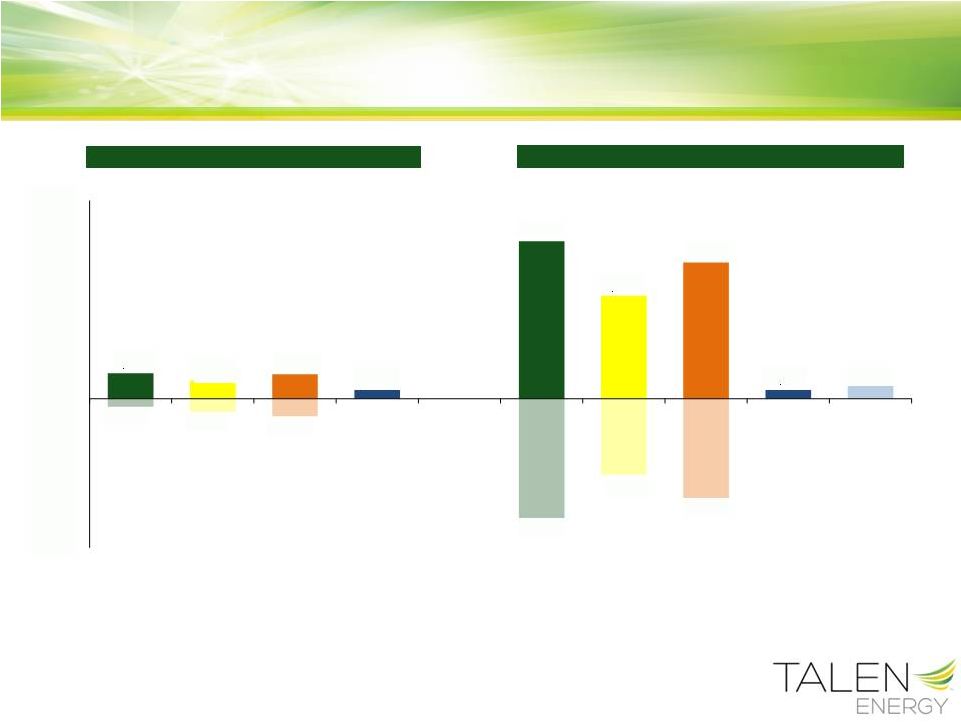 2015
Gas
+/-
$0.50/mmBtu
Heat Rate
+/-
1.0 mmBtu
Power
+/-
$5/MWh
ERCOT
1 hour
@
Offer Cap
2016
PJM
Capacity
+ $10/MW-Day
Margin Sensitivities
($ millions)
Gas
+/-
$0.50/mmBtu
Heat Rate
+/-
1.0 mmBtu
Power
+/-
$5/MWh
ERCOT
1 hour
@
Offer Cap
Notes: Does not reflect sale of approximately 1.3 GW of generating capacity
that is required to comply with the FERC Order Gas price sensitivity assumes
system heat rate is unchanged. Heat Rate sensitivity assumes power price moves and gas price is
unchanged. Power price sensitivity assumes gas price is unchanged.
©
Talen Energy Corporation 2015
26
$52
$37
$50
$18
$318
$208
$275
$18
$26
($16)
($26)
($35)
($240)
($153)
($200)
($300)
($200)
($100)
$0
$100
$200
$300
$400 |
 ©
Talen Energy Corporation 2015
27
Fully committed $1,850 million 5-year senior
secured revolving credit facility
$800 million secured trading facility, cash, and
bilateral agreements bring total liquidity sources
to $3.0 billion
Bilateral credit facilities are expected to be
effective in 2
nd
/3
rd
quarter 2015
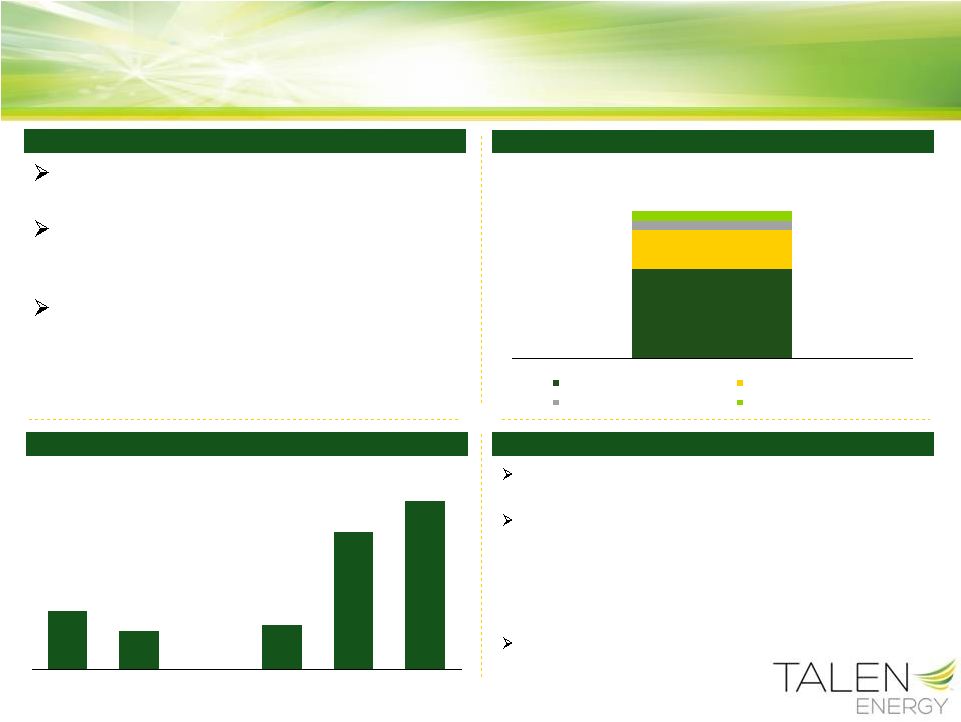
Significant Liquidity Resources
($ in millions)
Liquidity Summary
Liquidity and Financing
Forecasted Long-Term Debt Maturities
Financing Highlights
Issued $600 million of 6.5% senior unsecured notes in
May 2015
Assumed $1,250 million of RJS senior unsecured
notes in connection with the transaction. The
covenants are now comparable to Energy Supply’s
senior unsecured notes covenants. Interest rate will
step down from 5.125% to 4.625% following next
interest payment in July 2015.
Plan to remarket $231 million of tax-exempt securities
in 3
rd
quarter 2015
$3,050
$1,850
$800
$200
$200
Syndicated Secured Credit Facility
Secured Trading Facility
Bilateral Credit Facilities
Cash on Hand
$533
$354
$4
$403
$1,254
$1,538
2015
2016
2017
2018
2019
Thereafter |
 ©
Talen Energy Corporation 2015
28
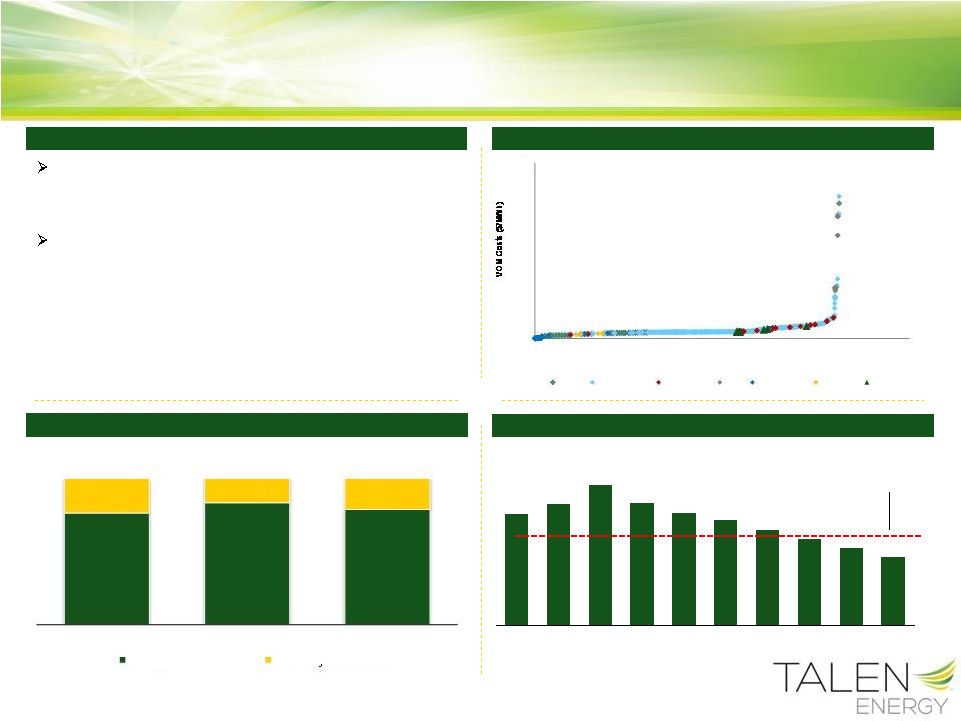
Leverage Lane
Capital decisions will be made on a cash returns basis
Capital Priorities
$2.4B of Projected Capital Spending
Capital Allocation
Modest Environmental Spending
Growth through strategic acquisitions
–
Accretive and supportive of long-term value proposition
–
Focus on synergy opportunities and portfolio
diversification
Growth through higher return asset development or
expansion
–
Brunner Island co-firing project
“Leverage
Lane”
of
3x
–
5x
Net
Debt/EBITDA
–
3x –
bias towards growth investment/capital return
–
5x –
bias towards debt retirement
Fleet substantially compliant with current regulations and
future environmental compliance-driven capital
expenditures projected at a modest $160 million from 2015
through 2019
Represents less than 10% of total capital
expenditures for the same period
Talen Energy is actively engaged with policy makers at the
state and federal levels to promote regulatory flexibility and
develop least-cost implementation scenarios, including
regional programs
Utilize balance sheet
for accretive growth
opportunities, asset
optimization projects
and return of capital
Rebalance capital
structure through
debt retirements
3.0 x
5.0 x
$516
$543
$466
$495
$395
2015
2016
2017
2018
2019
Sustenance
Nuclear Fuel
Environmental / Regulatory
Discretionary / I.T.
Growth |
 ©
Talen Energy Corporation 2015
Key Investment Considerations
29 |
 ©
Talen Energy Corporation 2015
30
Key Investment Considerations
Attractive fleet composition
High degree of strategic optionality across fuels, dispatch and markets Hedging strategy and balance sheet
construction harmonized to extract maximum value and positioned for growth opportunities Experienced management team with
demonstrated track record of delivering value through asset management and strong execution on
strategic initiatives
Management incentives tied directly to investors’ objectives: EBITDA and Free
Cash Flow |
 ©
Talen Energy Corporation 2015
31
Supplemental Information |
 ©
Talen Energy Corporation 2015
32
Asset
Location
Fuel Type
Ownership
Net Heat Rate (Btu / kWh)
Owned Capacity
COD
Region
East Assets
Brandon Shores
(2)
MD
Coal
100%
10,252
1,273
1984 -
1991
PJM-SWMAAC
Brunner Island
PA
Coal
100%
9,842
1,411
1961 -
1969
PJM-MAAC
C.P. Crane
(2)
MD
Coal
100%
10,616
399
1961 -
1967
PJM-SWMAAC
Conemaugh
PA
Coal
16%
9,700
278
1970 -
1971
PJM-RTO
Keystone
PA
Coal
12%
9,600
211
1967 -
1968
PJM-RTO
Montour
PA
Coal
100%
9,661
1,504
1972 -
1973
PJM-MAAC
H.A. Wagner
(2)
MD
Coal/NG/Oil
100%
10,663
976
1956 -
1972
PJM-SWMAAC
Eastern Hydro
(3)
PA
Hydro
100%
N/A
293
1910 -
1926
PJM-MAAC
Ironwood
PA
Natural Gas
100%
7,127
660
2001
PJM-MAAC
Lower Mt. Bethel
PA
Natural Gas
100%
7,170
538
2004
PJM-MAAC
York
(2)
PA
Natural Gas
100%
9,551
52
1989
PJM-MAAC
Bayonne
(2)
NJ
Natural Gas/Oil
100%
8,857
174
1988
PJM-PS North
Camden
(2)
NJ
Natural Gas/Oil
100%
8,675
151
1993
PJM-PSEG
Dartmouth
(2)
MA
Natural Gas/Oil
100%
8,715 (CCGT) / 11,326 (Peaker)
89
1996
ISO-NE
Elmwood Park
(2)
NJ
Natural Gas/Oil
100%
9,500
73
1989
PJM-PS North
Martins Creek 3&4
PA
Natural Gas/Oil
100%
11,744 (Gas) / 10,676 (Oil)
1,700
1975 -
1977
PJM-MAAC
Newark Bay
(2)
NJ
Natural Gas/Oil
100%
8,680
129
1993
PJM-PS North
Peakers
PA
Natural Gas/Oil
100%
Various
354
1967 -
1973
PJM
Pedricktown
(2)
NJ
Natural Gas/Oil
100%
8,455
132
1992
PJM-EMAAC
Susquehanna
PA
Nuclear
90%
N/A
2,245
1983 -
1985
PJM-MAAC
Renewables
(1)
NH, NJ, PA, VT
Renewables
100%
Various
25
Various
Various
Subtotal
12,667
West Assets
Colstrip 1 & 2
MT
Coal
50%
10,941
307
1975, 1976
WECC
Colstrip 3
MT
Coal
30%
10,660
222
1984
WECC
Barney Davis 1
(2)
TX
Natural Gas
100%
10,100
335
1974
ERCOT-South
Barney Davis 2
(2)
TX
Natural Gas
100%
7,100
674
2010
ERCOT-South
Laredo 4
(2)
TX
Natural Gas
100%
8,900
98
2008
ERCOT-South
Laredo 5
(2)
TX
Natural Gas
100%
8,900
98
2008
ERCOT-South
Nueces Bay 7
(2)
TX
Natural Gas
100%
7,100
678
2010
ERCOT-South
Subtotal
2,412
Total Talen Energy
15,079
Talen Energy Asset Overview
Note: Does not reflect sale of approximately 1.3 GW of generating capacity
that is required to comply with the FERC Order (1)Talen Energy is presently
considering divesting its renewables plants (2)Total net generating capacities
are based on average summer and winter capacity (3)Includes Holtwood and
Wallenpaupack |
 ©
Talen Energy Corporation 2015
33
Group 1
Mitigation Overview
PPL and RJS recognized possible FERC horizontal
market power concerns in PJM submarket 5004/5005 in
their FERC application for approval on July 15, 2014 and
proposed two divestiture options
Each divestiture option requires divestiture of one of two
proposed groups of approximately 1,300 MW of
generating capacity (based on summer ratings), with
some overlapping assets
On December 19, 2014, FERC conditionally approved
the transaction pending additional mitigation measures
-
Option 1: Divest all assets from one group while
limiting assets retained from other group to cost-based
rates
-
Option 2: Divest all 2,000 MW of capacity from both
groups
-
Option 3: Propose an alternative mitigation plan
PPL and RJS accepted Option 1 and told FERC they
would divest all assets from one group and bid the
retained assets at cost-based rates in the energy market
Decisions on which group of assets will be divested have
not been made
Group 2
(1)
Total net generating capacities are based on average summer and winter
capacity (2)
Pedricktown capacity includes capacity dedicated to serving landlord load (which
has historically averaged 9 MW) Facility
MW
Bayonne
0174
Camden
0151
Elmwood Park
0073
Newark Bay
0129
Pedricktown
0132
York
0052
Ironwood
0660
Total
1,371
Facility
MW
Bayonne
0174
Camden
0151
Elmwood Park
0073
Newark Bay
0129
Pedricktown
0132
York
0052
C.P. Crane
0399
Holtwood
0249
Wallenpaupack
0044
Total
1,403
FERC Required Mitigation
(1)
(2)
(2)
(1)
(1)
(1)
(1)
(1)
(1)
(1)
(1)
(1)
(1)
(1)
(1) |
 ©
Talen Energy Corporation 2015
34
Net Generation (GWh)
EAF
Capacity Factor
EFORd
2013
2014
2013
2014
2013
2014
2013
2014
East
Coal
24,191
22,580
80.6%
82.7%
48.3%
45.4%
5.9%
3.1%
Hydro
662
931
85.3%
88.5%
40.5%
36.3%
3.1%
1.8%
Nuclear
17,009
16,903
84.7%
84.1%
85.6%
85.6%
0.4%
0.3%
Natural Gas CCGT
8,794
9,411
82.0%
88.7%
83.9%
89.4%
4.0%
3.5%
Natural Gas/ Oil
2,283
3,822
91.8%
84.5%
11.8%
17.2%
6.4%
10.2%
Net Generation (GWh)
EAF
Capacity Factor
EFORd
2013
2014
2013
2014
2013
2014
2013
2014
West
Coal
3,502
3,449
81.0%
86.4%
76.0%
74.4%
15.6%
6.9%
Natural Gas
4,678
3,451
88.0%
84.0%
28.4%
21.1%
6.6%
7.8%
Operational Statistics
(1)
Includes Ironwood and Lower Mount Bethel
(2)
Excludes statistics for 354 MW of combustion turbines
(2)
(1) |
 ©
Talen Energy Corporation 2015
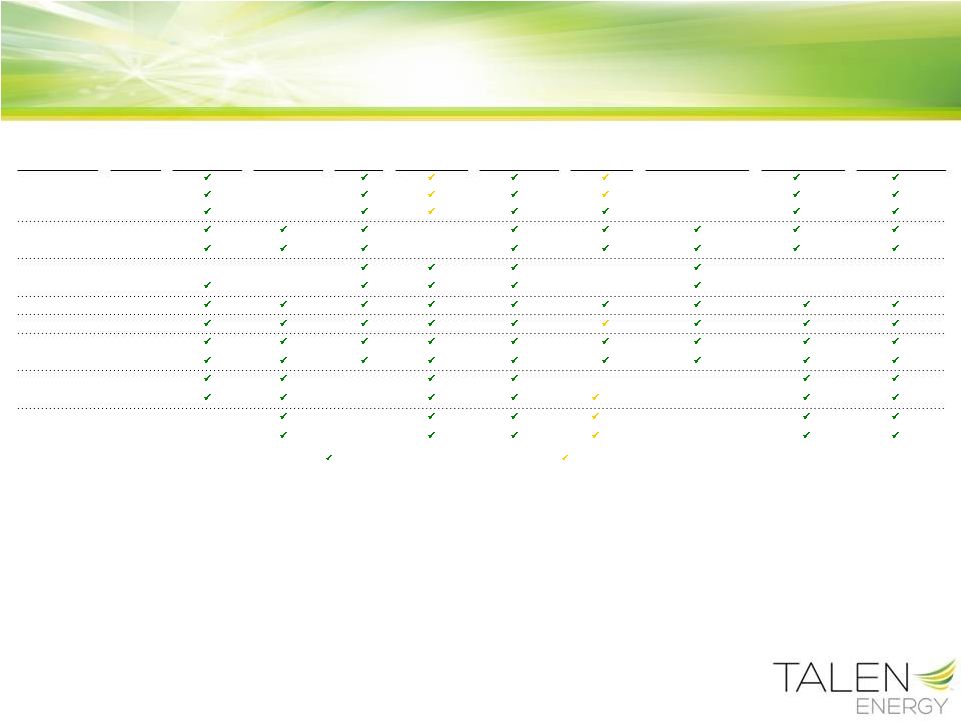
35
Asset
Unit
Low NOx
Burners
(Nox)
SCR/SNCR
(Nox)
Scrubbers
(SO )
Chemical Additive
(Mercury)
ESP/ Baghouse
(PM)
Dry Injection
(Acid Gases)
Closed-Cycle Cooling
Tower
Water Intake, 316(b)
Dry Handling/
Disposal/ Beneficial
Use
(CCRs)
Waste Water
Treatment
(Mainly Metals)
Brunner Island
Unit 1
NR
(1)
(3)
(6)
Unit 2
NR
(1)
(3)
(6)
Unit 3
NR
(1)
(3)
(6)
Montour
Unit 1
NR
(3)
(6)
Unit 2
NR
(3)
(6)
Colstrip
Units 1 & 2
(2)
(2)
(2)
(2)
NR
(3)
NR
(5)
Units 3 & 4
NR
NR
(3)
NR
(5)
Keystone
Units 1 & 2
(6)
Conemaugh
Units 1 & 2
(6)
Brandon Shores
Units 1
(6)
Units 2
(6)
Wagner
Unit 2
(7)
(7)
(4)
(4)
(1)
(6)
Unit 3
(4)
(4)
(1)
(6)
Crane
Unit 1
(7)
(7)
(4)
(4)
(1)
(6)
Unit 2
(7)
(7)
(4)
(4)
(1)
(6)
NR
= Not Required by Applicable Current or Proposed Regulations
= Installed
= Under Consideration/Construction
Environmental Controls
(1) 316(b)
regulations
finalized
in
2014
will
likely
require
intake
structure
modifications
for
some
sites,
particularly
those
with
once-through
cooling
water
systems.
If
needed,
Brunner
Island,
Crane
and Wagner will
install necessary equipment or make operational changes to comply
(2) New and pending NOx, SO2, and PM requirements will be met through boiler and
scrubber modifications; Talen Energy is appealing EPA's final Regional Haze FIP for Montana
(3) CCR regulations finalized in 2015 will likely require modifications to existing
operations or new controls at plants which utilize CCR disposal impoundments. Operation of the recently installed Wastewater Treatment
Plant at Brunner Island (which would replace the only remaining active disposal
impoundment) will commence following renewal of NPDES permit (4) Wagner
Unit
3
will
install
a
new
DSI
system,
Wagner
Unit
2
will
burn
a
low
chlorine
coal
(Adaro
from
Indonesia
or
Colorado)
and
they
will
average
emissions
with
Brandon
Shores
for
MATS
compliance.
Crane
burns
low-sulfur
PRB
(sub-bituminous)
coal
and
DSI
systems
will
also
be
installed
at
Crane
for
MATS
compliance.
Crane
and
Wagner
could
also
use
ultra-low
sulfur
Adaro
coal
to
comply
with
MATS,
or
if
needed,
to
meet
future
ambient
SO2
standards
(5) Colstrip
is
a
Zero-Liquid
Discharge
operation
and
therefore
does
not
have
discharge
permit
(6) Pending ELG revisions and NPDES permit renewals could require additional waste
water treatment (7) Crane is a cyclone boiler and is equipped with
over-fired air with SNCR for NOx control. MDE is developing new NOx requirements for MD coal plants which could require additional controls or operational changes
in 2020.
Wagner Unit 2, which has low NOx burners with SNCR for NOx control, could also be
required to install additional controls or make operational changes in 2020 as a result of MDE’s pending rule
2 |
 ©
Talen Energy Corporation 2015
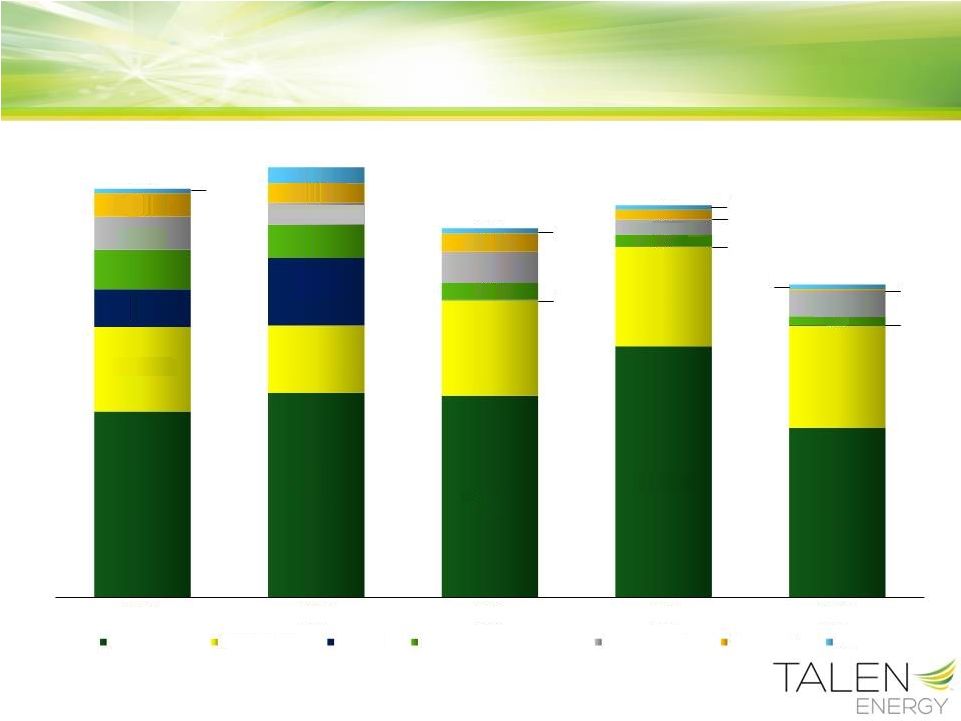
36
Projected Capital Expenditures
$107
$85
$120
$126
$129
$1
$1
$1
$29
$24
$23
$12
$2
$6
$20
$7
$6
$6
$516
$543
$466
$495
$395
2015
2016
2017
2018
2019
Sustenance
Nuclear Fuel
Growth
Information Technology
Environmental
Regulatory
Discretionary
$228
$42
$50
$48
$254
$28
$41
$85
$252
$39
$21
$307
$20
$15
$214
$32
$11 |
 ©
Talen Energy Corporation 2015
37
Long-term Debt Outstanding
(1)
Required
to
be
put
by
existing
holders
on
October
15,
2015
for
either
(a)
purchase
and
remarketing
by
a
designated
dealer
or
(b)
repurchase
by
Energy
Supply
(2)
As a result of meeting the “merger ratings event”, effective with the
interest period beginning July 15, 2015, the Senior Notes coupon will step down to 4.625%
(3)
Fair Market Value = $689 million
(4)
Put date September 2015
(5)
Amortizing Security; Fair Market Value = $47 million
Debt
Coupon
Maturity Date
Balance as of
5/31/2015
Senior Notes
5.700%
Oct 2035
(1)
$300
Senior Notes
6.200
May 2016
350
Senior Notes
6.500
May 2018
400
Senior Notes
5.125
Jul 2019
(2)
1,250
Senior Notes
4.600
Dec 2021
(3)
712
Senior Notes
6.000
Dec 2036
200
Senior Notes
6.500
May 2025
600
Muni Bonds
Various
Dec 2038
(4)
100
Muni Bonds
Various
Dec 2038
(4)
50
Muni Bonds
Various
Dec 2037
(4)
81
Secured Notes
8.857
Nov 2025
(5)
44
Total as of 5/31/2015
$4,086 |
 ©
Talen Energy Corporation 2015
38
Regulation G Reconciliations
Adjusted EBITDA
($ in Millions)
6/9/2014
(1)
–
2015E
(2)
Low –
2015E
(2)
Midpoint -
2015E
(2)
High -
2015E
(2)
Midpoint –
2016E
Net Income/(Loss)
$214
$55
$100
$145
$105
Income Taxes
143
23
53
83
56
Interest Expense
244
327
327
327
209
Depreciation & Amortization
439
410
410
410
422
EBITDA
1,040
815
890
965
792
Non-Cash Compensation
27
23
23
23
21
ARO
(3)
35
35
35
37
MTM losses (gains)
(28)
(28)
(28)
NDT losses (gains)
(10)
(10)
(10)
(10)
Adjusted EBITDA, including special items
1,067
835
910
985
840
Special items:
TSA costs and allocations
(4)
75
75
75
45
Other
(5)
25
25
25
Adjusted EBITDA
$1,067
$935
$1,010
$1,085
$885
(1) Estimate provided at 6/9/2014, the date of the
transaction announcement. (2)
RJS Power will be consolidated into Talen Energy’s financials as of June 1,
2015. Forecasted amounts include twelve months of performance from RJS Power, including the five-month period prior to
acquisition
with
respect
to
2015
estimates.
Low,
midpoint
and
high
forecast
2015
reflects
three
months
of
Energy
Supply
actuals.
Adjusted
EBITDA
from
RJS
Power
for
the
five-month
period
prior
to
acquisition is estimated at $41 million.
(3)
Additional item identified as an adjustment to EBITDA that was not included in the
original $1,067 model year Adjusted EBITDA estimate. (4)
Low, midpoint, and high 2015 amounts include $40 million of allocations from PPL and
$35 million of TSA costs that are not expected to continue in future periods.
(5)
Restructuring costs that are not expected to continue in future periods.
|
 ©
Talen Energy Corporation 2015
39
Regulation G Reconciliations
Adjusted Free Cash Flow
($ in Millions)
Low -
2015E
Midpoint –
2015E
High –
2015E
Cash from Operations
(1)
$752
$797
$842
Sustenance Capital Expenditures
(547)
(517)
(487)
Adjusted Free Cash Flow, including special items
205
280
355
Special items:
TSA costs & allocations (after tax)
(2)
45
45
45
Other (after tax)
(3)
15
15
15
Adjusted Free Cash Flow
$265
$340
$415
(1)
RJS Power will be consolidated into Talen Energy’s financials as of June 1,
2015. Forecasted amounts include twelve months of performance from RJS Power, including the five-
month period prior to acquisition with respect to 2015 estimates. Reflects three
months of Energy Supply actuals. Adjusted Free Cash Flow from RJS Power for the five-month
period prior to acquisition is estimated at $14 million.
(2) Includes $24 million of allocations from PPL and $21 million
of TSA costs that are not expected to continue in future periods.
(3) Restructuring costs that are not expected to continue in
future periods. |
 ©
Talen Energy Corporation 2015
40
Forward-Looking Information Statement
Statements contained in this presentation, including statements with respect to
future earnings, EBITDA results, cash flows, financing, regulation and
corporate strategy are "forward-looking statements" within the meaning of the federal
securities
laws.
Although
Talen
Energy
Corporation
believes
that
the
expectations
and
assumptions
reflected
in
these
forward-looking statements are reasonable, these statements are subject to a
number of risks and uncertainties, and actual results may differ materially
from the results discussed in the statements. The following are among the important
factors that could cause actual results to differ materially from the
forward-looking statements: market demand and prices for energy,
capacity and fuel; weather conditions affecting customer energy usage and operating costs; competition in
power markets; the effect of any business or industry restructuring; the
profitability and liquidity of Talen Energy Corporation
and
its
subsidiaries;
new
accounting
requirements
or
new
interpretations
or
applications
of
existing
requirements; operating performance of generating plants and other facilities; the
length of scheduled and unscheduled outages at our generating plants;
environmental conditions and requirements and the related costs of compliance,
including environmental capital expenditures and emission allowance and other
expenses; system conditions and operating costs; development of new
projects, markets and technologies; performance of new ventures; asset or
business acquisitions and dispositions; any impact of hurricanes
or other severe weather on our business, including any
impact on fuel prices; receipt of necessary government permits or approvals;
capital market conditions and decisions regarding capital structure; the
impact of state, federal or foreign investigations applicable to Talen Energy Corporation
and its subsidiaries; the outcome of litigation against Talen Energy Corporation
and its subsidiaries; stock price performance; the market prices of equity
securities and the impact on pension income and resultant cash funding
requirements for defined benefit pension plans; the securities and credit ratings
of Talen Energy Corporation and its subsidiaries; political, regulatory or
economic conditions in states, regions or countries where Talen Energy Corporation
or its subsidiaries conduct business, including any potential effects of threatened
or actual terrorism or war or other hostilities; foreign exchange rates; new
state, federal or foreign legislation, including new tax legislation; and the
commitments and liabilities of Talen Energy Corporation and its subsidiaries. Any
such forward-looking statements should be considered in light of such
important factors and in conjunction with Talen Energy Corporation's Registration
statement on Form S-1 and other reports on file with the Securities and
Exchange Commission. |
 ©
Talen Energy Corporation 2015
41
In this presentation the company presents EBITDA, Adjusted EBITDA and Adjusted
EBITDA, including special items, each of which are non-GAAP financial
measures. EBITDA represents net income (loss) before interest expense, income
taxes, depreciation and amortization. Adjusted EBITDA, represents EBITDA adjusted
for certain items as detailed in the reconciliation. Adjusted EBITDA,
including special items, is Adjusted EBITDA prior to adjustment for items management
considers special including TSA costs, pre-spin PPL charges and restructuring
costs. EBITDA, Adjusted EBITDA and Adjusted EBITDA, including special items,
are not intended to represent cash flows from operations or net income (loss)
as defined by U.S. GAAP as indicators of operating performance and are not
necessarily comparable to similarly-titled measures reported by other
companies. We believe EBITDA, Adjusted EBITDA and Adjusted EBITDA, including special
items, are useful to investors and other users of our financial statements in
evaluating our operating performance because they provide additional tools
to compare business performance across companies and across periods. We
believe that EBITDA is widely used by investors to measure a company’s
operating performance without regard to such items as interest expense,
income taxes, depreciation and amortization, which can vary substantially from company to
company depending upon accounting methods and book value of assets, capital
structure and the method by which assets were acquired. Additionally, we
believe that investors commonly adjust EBITDA information to eliminate the effect
of restructuring and other expenses, which vary widely from company to company and
impair comparability. We adjust for these and other items as our management
believes that these items would distort their ability to efficiently view and
assess our core operating trends.
In summary, our management uses EBITDA, Adjusted EBITDA and Adjusted EBITDA,
including special items, as measures of operating performance to assist in
comparing performance from period to period on a consistent basis and to
readily view operating trends, as measures for planning and forecasting overall expectations and for evaluating actual
results against such expectations, and in communications with our Board of
Directors, shareholders, creditors, analysts and investors concerning our
financial performance. Definitions of Non-GAAP Financial
Measures |
 ©
Talen Energy Corporation 2015
42
Adjusted free cash flow is derived by deducting sustenance capital expenditures and
after-tax special items from cash flow from operations, while adjusted
free cash flow, including special items, is derived from adjusted free cash flow prior
to adjustment for after-tax special items. These two non-GAAP measures
should not be considered alternatives to cash flow from operations, which is
determined in accordance with GAAP. We believe that adjusted free cash flow and
adjusted free cash flow, including special items, although both non-GAAP
measures, are important measures to both management and investors as
indicators of the company’s ability to sustain operations and growth without additional
outside financing beyond the requirement to fund maturing debt obligations. These
measures are not necessarily comparable to similarly-titled measures
reported by other companies as they may be calculated differently.
Definitions of Non-GAAP Financial Measures |