Attached files
| file | filename |
|---|---|
| 8-K - FORM 8-K - CITIZENS FINANCIAL GROUP INC/RI | d857433d8k.htm |
| EX-99.1 - EXHIBIT 99.1 - CITIZENS FINANCIAL GROUP INC/RI | d857433dex991.htm |
| EX-99.3 - EXHIBIT 99.3 - CITIZENS FINANCIAL GROUP INC/RI | d857433dex993.htm |
 4Q14 and FY 2014
Financial Results January 26, 2015
Exhibit 99.2 |
 Forward-looking statements
1
This document contains forward-looking statements within the Private Securities Litigation
Reform Act of 1995. Statements regarding potential future share repurchases and future
dividends are forward-looking statements. Also, any statement that does not describe
historical or current facts is a forward-looking statement. These statements often include the
words “believes,” “expects,” “anticipates,”
“estimates,” “intends,” “plans,” “goals,” “targets,” “initiatives,” “potentially,” “probably,” “projects,” “outlook” or similar expressions or future
conditional verbs such as “may,” “will,” “should,”
“would,” and “could.” Forward-looking statements are based upon the current beliefs and expectations of
management, and on information currently available to management. Our statements speak as of
the date hereof, and we do not assume any obligation to update these statements or to update
the reasons why actual results could differ from those contained in such statements in
light of new information or future events. We caution you, therefore, against relying on any
of these forward-looking statements. They are neither statements of historical fact nor
guarantees or assurances of future performance. While there is no assurance that any list of
risks and uncertainties or risk factors is complete, important factors that could cause actual
results to differ materially from those in the forward-looking statements include the
following, without limitation: •
negative economic conditions that adversely affect the general economy, housing prices, the
job market, consumer confidence and spending habits which may affect, among other
things, the level of nonperforming assets, charge-offs and provision expense;
•
the rate of growth in the economy and employment levels, as well as general business and
economic conditions;
•
our ability to implement our strategic plan, including the cost savings and efficiency
components, and achieve our indicative performance targets;
•
our ability to remedy regulatory deficiencies and meet supervisory requirements and
expectations;
•
liabilities resulting from litigation and regulatory investigations; •
our capital and liquidity requirements (including under regulatory capital standards, such as
the Basel III capital standards) and our ability to generate capital internally or
raise capital on favorable
terms;
•
the effect of the current low interest rate environment or changes in interest rates on our
net interest income, net interest margin and our mortgage originations, mortgage
servicing rights and mortgages held for sale; •
changes in interest rates and market liquidity, as well as the magnitude of such changes,
which may reduce interest margins, impact funding sources and affect the ability to
originate and distribute financial products in the primary and secondary markets; •
the effect of changes in the level of checking or savings account deposits on our funding
costs and net interest margin;
•
financial services reform and other current, pending or future legislation or regulation that
could have a negative effect on our revenue and businesses, including the Dodd-
Frank Act and other legislation and regulation relating to bank products and services; •
a failure in or breach of our operational or security systems or infrastructure, or those of
our third party vendors or other service providers, including as a result of cyber
attacks;
•
management’s ability to identify and manage these and other risks; and •
any failure by us to successfully replicate or replace certain functions, systems and
infrastructure provided by The Royal Bank of Scotland Group plc (RBS).
In addition to the above factors, we also caution that the amount and timing of any future
common stock dividends will depend on our financial condition, earnings, cash needs,
regulatory constraints, capital requirements (including requirements of our subsidiaries), and
any other factors that our Board of Directors deems relevant in making such a
determination. Therefore, there can be no assurance that we will pay any dividends to holders
of our common stock, or as to the amount of any such dividends. In addition, the timing
and manner of the sale of RBS's remaining ownership of our common stock remains uncertain, and
we have no control over the manner in which RBS may seek to divest such remaining
shares. Any such sale would impact the price of our shares of common stock.
More information about factors that could cause actual results to differ materially from those
described in the forward-looking statements can be found under “Risk Factors” in our
Registration Statement on Form S-1 filed with the United States Securities and Exchange
Commission and declared effective on September 23, 2014. Note: Percentage changes, per share amounts, and ratios presented in this document are
calculated using whole dollars. |
 4Q14
highlights 2
Improving
profitability and
returns
GAAP diluted EPS of $0.36; Adjusted diluted EPS of $0.39, up 30% from 4Q13
Adjusted ROTCE of 6.8% vs. 5.2% in 4Q13
YoY period-end loan growth of 9% with 8% growth in net interest income
Benefit
of
growth
and
efficiency
initiatives
driving
continued
positive
operating
leverage
Strong capital,
liquidity, and
funding
Excellent credit
quality and
progress on risk
management
Strong progress
on strategic
growth and
efficiency
initiatives
Robust capital levels with a Tier 1 Common Equity Ratio of 12.4%. 2% growth from 3Q14 in
tangible book value/share to $23.46
Period-end deposits grew $8.8 billion, or 10% vs. 4Q13; Loan-to-deposit ratio of
98% remained relatively stable
Issued $1.5 billion of senior notes in December
Strong balance sheet supports targeted future loan growth
Continued strong credit quality with net charge-off ratio of 0.35%, down 3 bps from 3Q14
and 18 bps from 4Q13
NPLs broadly stable with 3Q14 and strong NPL coverage of 109%
Allowance for loan and lease losses of 1.28% of total loans and leases
Expense initiatives on track; achieved 28% in 2014 of targeted $200 million goal by
2016 Progress in recruiting mortgage loan officers: 412 at year end, up 62 net for
2014, with 41 net in 4Q14 as attrition has slowed
YoY Period-end loan growth of $7.6 billion broadly on target with $3.8 billion in
commercial, $3.3 billion in Auto, and a net $0.5 billion across other portfolios
1
Adjusted results are non-GAAP items and exclude the effect of net restructuring charges
and special items associated with Chicago Divestiture, efficiency and effectiveness
programs and separation from RBS. See important information on use of Non-GAAP items in the Appendix. “Chicago Divestiture“ refers to the June 23, 2014 sale of the
Chicago-area Charter One branches, small business and select middle market relationships.
1
1 |
 Financial summary
– GAAP
3
1
Non-GAAP item. See important information on use of Non-GAAP items in the Appendix.
2
Includes held for sale.
3
Return on average tangible common equity.
4
Return on average total tangible assets.
5
Full-time equivalent employees.
Linked quarter:
Net income up 4% driven by 2% total
revenue growth and lower provision
expense
NII rose 2% driven by continued earning
asset growth and higher securities
portfolio income
Noninterest income up slightly excluding
swing in MSR
Expense management initiatives
continue to gain traction
Noninterest expense up $14 million
driven by $12 million increase in
restructuring charges and special
items
Continue investments to drive
enhanced revenue growth
Prior year quarter:
Net income up 30%
NII up 8% driven by 9% earning asset
growth. Runoff of pay-fixed swap
book helped mitigate continued
impact of the low-rate environment
Noninterest income down 11%
driven by the impact of the
Chicago Divestiture and a posting-
order change
Noninterest expense up $6 million,
or 1%
Provision decreased 45%
Highlights
Quarterly trends
Full year
4Q14 change from
2014 change
$s in millions
4Q14
3Q14
4Q13
3Q14
4Q13
2014
2013
from 2013
Net interest income
840
$
820
$
779
$
20
$
61
$
3,301
$
3,058
$
243
$
Noninterest income
339
341
379
(2)
(40)
1,678
1,632
46
Total revenue
1,179
1,161
1,158
18
21
4,979
4,690
289
Noninterest expense
824
810
818
14
6
3,392
7,679
(4,287)
Pre-provision profit (loss)
355
351
340
4
15
1,587
(2,989)
4,576
Provision for credit losses
72
77
132
(5)
(60)
319
479
(160)
Income (loss) before
income tax expense (benefit)
283
274
208
9
75
1,268
(3,468)
4,736
Income tax expense
(benefit)
86
85
56
1
30
403
(42)
445
Net income (loss)
197
$
189
$
152
$
8
$
45
$
865
$
(3,426)
$
4,291
$
$s in billions
Average interest earning
assets
118.7
$
117.2
$
109.0
$
1.5
$
9.8
$
116.2
$
107.1
$
9.0
$
Average deposits
2
94.8
$
91.7
$
93.2
$
3.1
$
1.6
$
92.6
$
93.3
$
(0.8)
$
Key metrics
Net interest margin
2.80
%
2.77
%
2.83
%
3
bps
(3)
bps
2.83
%
2.85
%
(2)
bps
Loan-to-deposit ratio
(period-end)
2
97.9
%
97.3
%
94.5
%
60
bps
340
bps
97.9
%
94.5
%
340
bps
ROTCE
1,3
6.12
%
5.81
%
4.71
%
31
bps
141
bps
6.71
%
(25.91)
%
3,262
bps
ROTA
1,4
0.63
%
0.61
%
0.53
%
2
bps
10
bps
0.71
%
(3.05)
%
376
bps
Efficiency ratio
1
70
%
70
%
71
%
4
bps
(74)
bps
68
%
164
%
(9,561)
bps
FTEs
5
17,677
17,852
19,152
(175)
(1,475)
17,677
19,152
(1,475)
Per common share
Diluted earnings
0.36
$
0.34
$
0.27
$
0.02
$
0.09
$
1.55
$
(6.12)
$
7.67
$
Tangible book value
23.46
$
23.04
$
22.61
$
0.42
$
0.85
$
23.46
$
22.61
$
0.85
$
Average diluted shares
outstanding (in millions)
550.7
560.2
560.0
(9.6)
(9.3)
557.7
560.0
(2.3) |
 Restructuring
charges and special items 4
GAAP results included restructuring charges and special items related to enhancing efficiencies
and improving processes across the organization and separation from The Royal Bank of
Scotland Group plc (“RBS”). Expect
to
utilize
the
balance
of
the
Chicago
Divestiture
gain
to
continue
to
reinvest
to
drive
future
growth,
and
to
fund
an
additional
$30-$50
million
of
further
restructuring
charges
and
special
expense
items
in
1H15.
as of and for the three months ended
as of and for the twelve months ended
Restructuring charges and special items
($s in millions, except per share data)
pre-tax
after-tax
pre-tax
after-tax
pre-tax
after-tax
pre-tax
after-tax
Noninterest income special items:
Other income
Net Gain on Chicago Divestiture
—
$
—
$
—
$
—
$
288
$
180
$
—
$
—
$
Total noninterest income special items
—
$
—
$
—
$
—
$
288
$
180
$
—
$
—
$
Noninterest expense restructuring charges
and special items:
Salaries and employee benefits
Chicago Divestiture
—
$
—
$
—
$
—
$
3
$
2
$
—
$
—
$
Efficiency initiatives
(1)
—
—
—
39
24
5
3
Separation/IPO related
1
—
—
—
1
1
—
—
Other
1
—
—
—
1
—
—
—
Non-compensation expense
Chicago Divestiture
—
—
—
—
14
9
—
—
Efficiency initiatives
11
8
1
—
58
37
—
—
Separation/IPO related
7
3
5
3
19
10
—
—
Other
14
9
15
10
34
22
21
14
Goodwill impairment
—
—
—
—
—
—
4,435
4,080
Total noninterest expense restructuring
charges and special items
33
$
20
$
21
$
13
$
169
$
105
$
4,461
$
4,097
$
Net restructuring charges and special items
(33)
$
(20)
$
(21)
$
(13)
$
119
$
75
$
(4,461)
$
(4,097)
$
Diluted EPS impact
(0.03)
$
(0.02)
$
0.13
$
(7.32)
$
December 31, 2014
September 30, 2014
December 31, 2014
December 31, 2013 |
 Adjusted
4Q14
financial
summary
-
excluding
restructuring
charges
and
special
items
1
5
1
Non-GAAP item. Adjusted results exclude the effect of net restructuring charges and
special items associated with Chicago Divestiture, efficiency and effectiveness
programs and separation from RBS. See important information on use of Non-GAAP items in the Appendix.
2
Includes held for sale.
3
Return on average tangible common equity.
4
Return on average total tangible assets.
5
Full-time equivalent employees.
Linked quarter:
Adjusted net income up 7% reflecting solid
operating leverage and continued
improvement in credit quality
Adjusted pre-provision profit up 4%
Total revenue up $18 million
–
NII up $20 million, or 2%
–
Noninterest income impacted by MSR
swing
Adjusted noninterest expense broadly flat
despite continued investment to drive
future revenue growth
Adjusted efficiency ratio improved 91 bps
Prior year quarter:
Adjusted pretax income up 35% reflecting
positive operating leverage and a $60
million reduction in provision expense
Total revenue up $21 million despite
estimated $30 million impact of Chicago
Divestiture and posting-order change
Adjusted efficiency ratio improved
124 bps
Highlights
–
NII up 8% on 9% earning asset growth
–
Adjusted noninterest income down
11%
4Q14 change from
$s in millions
4Q14
3Q14
4Q13
3Q14
4Q13
$
%
$
%
184
Net interest income
840
$
820
$
779
$
20
$
2 %
61
$
8 %
185
Noninterest income
339
341
379
(2)
(1) %
(40)
(11) %
186
Total revenue
1,179
1,161
1,158
18
2 %
21
2 %
187
Adjusted noninterest expense
1
791
789
792
2
—
%
(1)
—
%
188
Adjusted pre-provision profit
1
388
372
366
16
4 %
22
6 %
189
Provision for credit losses
72
77
132
(5)
(6) %
(60)
(45) %
190
Adjusted pretax income
1
316
295
234
21
7 %
82
35 %
191
Adjusted income tax expense
1
99
93
65
6
6 %
34
52 %
192
Adjusted net income
1
217
$
202
$
169
$
15
$
7 %
48
$
28 %
$s in billions
193
Average interest earning assets
118.7
$
117.2
$
109.0
$
1.5
$
1 %
9.8
$
9 %
194
Average deposits
2
94.8
$
91.7
$
93.2
$
3.1
$
3 %
1.6
$
2 %
Key metrics
195
Net interest margin
2.80
%
2.77
%
2.83
%
3
bps
(3)
bps
109
Loan-to-deposit ratio (period-end)
2
97.9
%
97.3
%
94.5
%
60
bps
340
bps
197
Adjusted ROTCE
1,3
6.76
%
6.22
%
5.24
%
54
bps
152
bps
198
Adjusted ROTA
1,4
0.69
%
0.66
%
0.59
%
3
bps
10
bps
199
Adjusted efficiency ratio
1
67
%
68
%
68
%
(91)
bps
(124)
bps
200
FTEs
5
17,677
17,852
19,152
(175)
(1) %
(1,475)
(8) %
Per common share
156
Adjusted diluted EPS
1
0.39
$
0.36
$
0.30
$
0.03
$
8 %
0.09
$
30 %
157
Tangible book value
23.46
$
23.04
$
22.61
$
0.42
$
2 %
0.85
$
4 %
158
Average diluted shares outstanding
(in millions)
550.7
560.2
560.0
(9.6)
(2) %
(9.3)
(2) % |
 Adjusted full
year financial summary - excluding restructuring charges and special items
1
6
1
Non-GAAP item. Adjusted results exclude the effect of net restructuring charges and
special items associated with Chicago Divestiture, efficiency and effectiveness
programs and separation from RBS. See important information on use of Non-GAAP items in the Appendix.
2
Includes held for sale.
3
Return on average tangible common equity.
4
Return on average total tangible assets.
5
Full-time equivalent employees.
Adjusted net income up 18% driven by a 33% decrease
in provision expense
Adjusted pre-provision profit relatively stable
Adjusted total revenue stable, higher-quality
–
Underlying strength in NII and fee income more
than offset by the estimated $50 million impact of
the Chicago Divestiture and $43 million decrease in
service charges related to posting-order change
–
NII up $243 million; up $269 million before the
estimated $26 million impact of the Chicago
Divestiture
–
Adjusted noninterest income down $242 million
driven by a net $183 million decrease related to
lower securities gains, the Chicago Divestiture and
the posting-order change
–
Underlying strength in capital markets fees and
trust and management
Adjusted noninterest expense relatively stable as $42
million benefit from the Chicago Divestiture was largely
offset by higher regulatory costs and incentives expense
and investments to drive growth
Highlights
2014 change from
$s in millions
2014
2013
2013
$
%
Net interest income
3,301
$
3,058
$
243
$
8 %
Adjusted noninterest income
1
1,390
1,632
(242)
(15) %
Adjusted total revenue
1
4,691
4,690
1
—
%
Adjusted noninterest expense
1
3,223
3,218
5
—
%
Adjusted pre-provision profit
1
1,468
1,472
(4)
—
%
Provision for credit losses
319
479
(160)
(33) %
Adjusted pretax income
1
1,149
993
156
16 %
Adjusted income tax expense
1
359
322
37
11 %
Adjusted net income
1
790
$
671
$
119
$
18 %
$s in billions
Average interest earning assets
116.2
$
107.1
$
9.0
$
8 %
Average deposits
2
92.6
$
93.3
$
(0.8)
$
(1) %
Key metrics
Net interest margin
2.83
%
2.85
%
(2)
bps
Loan-to-deposit ratio (period-end)
2
97.9
%
94.5
%
340
bps
Adjusted ROTCE
1,3
6.13
%
5.08
%
105
bps
Adjusted ROTA
1,4
0.65
%
0.60
%
5
bps
Adjusted efficiency ratio
1
69
%
69
%
9
bps
FTEs
5
17,677
19,152
(1,475)
(8) %
Per common share
Adjusted diluted EPS
1
1.42
$
1.20
$
0.22
$
18 %
Tangible book value
23.46
$
22.61
$
0.85
$
4 %
Average diluted shares outstanding
(in millions)
557.7
560.0
(2.3)
—
% |
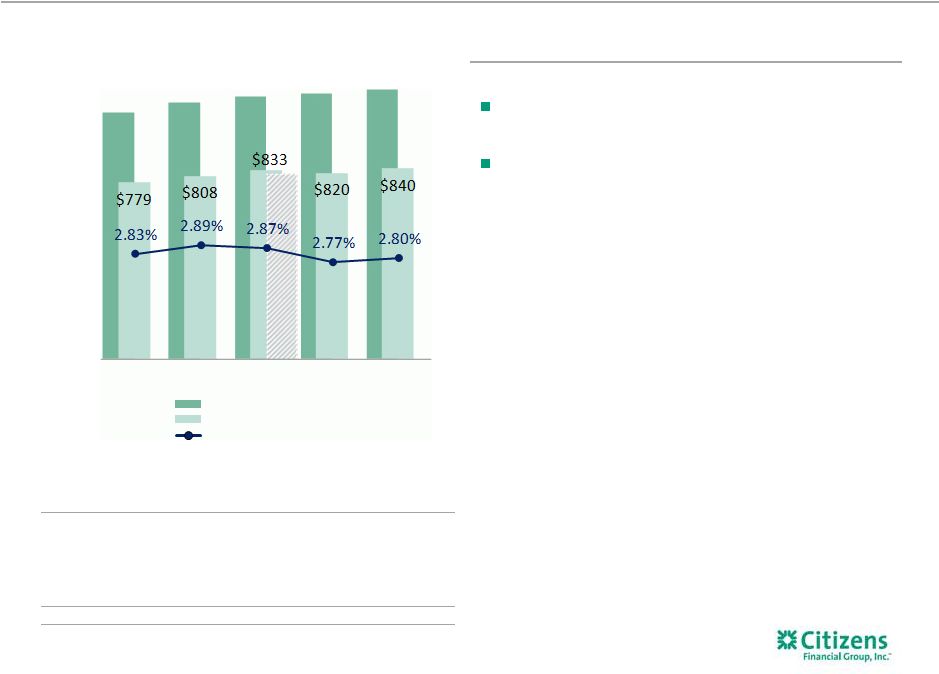 Net interest
income Linked quarter:
NII up $20 million, or 2%, driven by increased investment
portfolio income and 3% loan growth
NIM improved 3 bps to 2.80%
–
4Q14 included an estimated 4 bps benefit related to
the securities portfolio duration extension trade and
reduction in excess cash position, of which 2 bps is
expected to persist
–
Underlying NIM relatively stable –
the benefit of yield
initiatives associated with loan growth, improved
origination fees and lower pay-fixed swap costs was
offset by the effect of loan originations skewing to
Commercial and Auto, plus higher deposit costs and
borrowing costs tied to the issuance of subordinated
debt and senior notes
7
Highlights
Net interest income
$s in millions,
except earning
assets
Average interest-earning assets
Average interest earning assets
Net interest income
Net interest margin
$820²
$109B
$113B
$116B
$117B
$119B
4Q13
1Q14
2Q14
3Q14
4Q14
$s in billions
4Q13
1Q14
2Q14
3Q14
4Q14
210
Retail Loans
$46.3
$46.4
$47.5
$48.5
$49.8
211
Commercial Loans
39.5
39.7
40.5
41.2
42.3
212
Investments and interest-
bearing deposits
22.9
25.2
26.8
27.3
26.5
213
Loans held for sale
1
0.2
1.2
1.2
0.2
0.2
214
Total interest-earning assets
$109.0
$112.5
$116.0
$117.2
$118.7
1
1Q14 and 2Q14 include other loans held for sale associated with Chicago Divestiture. 2
Represents estimated underlying net interest income adjusted for the effect of
Chicago Divestiture.
|
 Linked
quarter: Noninterest
income
up
by
$5
million
excluding
MSR swing:
–
Higher capital markets fees and other income
largely offset by lower mortgage banking fees
with all other categories relatively stable
–
Mortgage banking fees down $5 million
including the $7 million impact of a change in
MSR valuation
–
Strength in capital markets fees and higher FX &
trade finance fees and underlying momentum in
other core fees more than offset by
–
$34 million decrease in securities gains and
other income
–
$12 million decrease tied to the Chicago
Divestiture
–
$5
million
decrease
related
to
check
posting-
order changes in service charges
8
Highlights
1
Other income includes interest rate product fees, leasing income, bank owned life insurance,
and other income. Fee income before the
impact of securities
gains and other income
relatively stable despite
impact of Chicago
Divestiture and a
posting-order change
1
$339
$341
$379
4Q14
3Q14
4Q13
Service charges and fees
Card fees
Trust and inv services
FX & trade finance fees
Mortgage banking fees
Capital markets fee income
Securities gains (losses)
Other
income
4Q14 change from
$s in millions
4Q14
3Q14
4Q13
3Q14
4Q13
$
%
$
%
215
Service charges and fees
144
$
144
$
152
$
—
$
—
%
(8)
$
(5) %
216
Card fees
58
58
58
—
—
%
—
—
%
217
Trust & investment services fees
38
39
40
(1)
(3) %
(2)
(5) %
218
FX & trade finance fees
25
26
24
(1)
(4) %
1
4 %
219
Mortgage banking fees
16
21
20
(5)
(24) %
(4)
(20) %
220
Capital markets fees
25
22
18
3
14 %
7
39 %
221
Securities gains, net
1
2
25
(1)
(50) %
(24)
(96) %
222
Other income
1
32
29
42
3
10 %
(10)
(24) %
225
Noninterest income
339
$
341
$
379
$
(2)
$
(1) %
(40)
$
(11) %
Noninterest income
Prior year quarter:
Noninterest income down $40 million |
 Adjusted
noninterest
expense
–
excluding
restructuring
charges
and
special
items
1
Linked quarter:
Adjusted noninterest expense and
efficiency ratio remained relatively
stable
—
Adjusted salaries and benefits down
$13 million driven by lower
incentive and benefits expense
•
FTEs down 175 driven by our
efficiency initiatives
—
Adjusted other expense up $10
million
•
Includes higher marketing and
regulatory expenses
Efficiency initiatives drove incremental
cost savings of $16 million
9
Highlights
.
4Q14 change from
$s in millions
4Q14
3Q14
4Q13
3Q14
4Q13
$
%
$
%
235
Adjusted salaries and benefits ¹
396
$
409
$
386
$
(13)
$
(3) %
10
$
3 %
236
Adjusted outside services ¹
88
87
101
1
1 %
(13)
(13) %
237
Adjusted occupancy ¹
76
75
72
1
1 %
4
6 %
238
Adjusted equipment expense ¹
62
58
61
4
7 %
1
2 %
239
Adjusted amortization of software ¹
37
38
32
(1)
(3) %
5
16 %
240
Adjusted other expense ¹
132
122
140
10
8 %
(8)
(6) %
241
Adjusted noninterest expense ¹
791
$
789
$
792
$
2
$
—
%
(1)
$
—
%
242
Restructuring charges and special items
33
21
26
12
57 %
7
27 %
243
Total noninterest expense
824
$
810
$
818
$
14
$
2 %
6
$
Adjusted salary and benefits
Adjusted occupancy & equip
Adjusted all other
Adjusted efficiency ratio
$791
$789
$792
1
Non-GAAP item. Adjusted results exclude the effect of net restructuring charges and
special items associated with Chicago Divestiture, efficiency and effectiveness programs
and separation from RBS. See important information on use of Non-GAAP items in the
Appendix. Additional details on restructuring charges and special items provided on page 28.
2
Excludes restructuring charges and special items . 1 %
4Q14
3Q14
4Q13
2
2
2 |
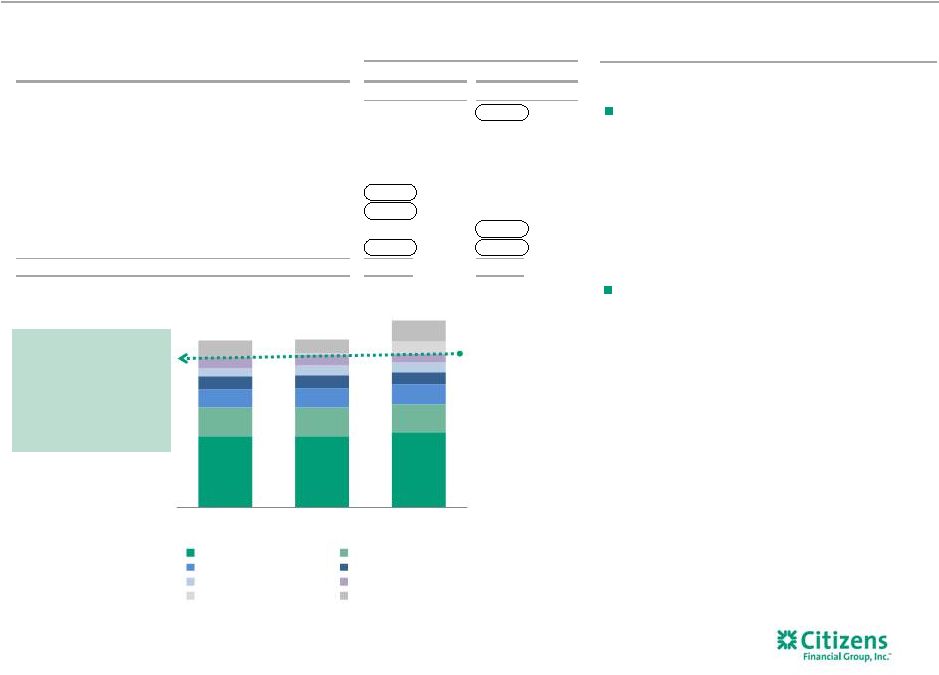
 Consolidated 4Q14
average balance sheet Linked quarter:
Total earning assets up 1%
Commercial loans up $1.1 billion, driven by
strength in Mid-Corporate, Commercial Real
Estate, Asset Finance, Healthcare, and
Franchise Finance
Retail loans up $1.3 billion driven by growth
in auto, mortgage, and student
Total deposits increased 3%, reflecting strength
in all product categories
$1.0 billion increase in low-cost core
deposits
Borrowed funds decreased $1.0 billion
Total earning assets up 9%
Retail loans up 8% driven by growth in auto
and mortgage
Commercial loans up 7% driven by growth
in Mid-Corporate, Commercial Real Estate,
Asset Finance, Franchise Finance,
Healthcare, and Technology
$1.1
billion decrease related to the Chicago
Divestiture
Total deposits up $1.6 billion driven by
strength in low-cost core deposits
10
Highlights
$118.7 billion
Interest-earning assets
$108.8 billion
Deposits/borrowed funds
Total
Consumer
42%
Total
Commercial
36%
1
Low-cost core deposits include demand, checking with interest, and regular savings.
2
Total deposits includes deposits held for sale.
CRE
Other
Commercial
Residential
mortgage
Total home
equity
Automobile
Other
Consumer
Investments
and
interest-bearing
deposits
Retail /
Personal
Commercial/
Municipal
Wholesale
4Q14 change from
$s in billions
4Q14
3Q14
4Q13
3Q14
4Q13
$
%
$
%
265
Investments and interest bearing
deposits
26.5
$
27.3
$
22.9
$
(0.9)
$
(3) %
3.5
$
15 %
266
Total commercial loans
42.3
41.2
39.5
1.1
3 %
2.7
7 %
267
Total retail loans
49.8
48.5
46.3
1.3
3 %
3.5
8 %
268
Total loans and leases
92.0
89.7
85.8
2.4
3 %
6.2
7 %
269
Loans held for sale
0.2
0.2
0.2
—
15 %
—
(1) %
270
Total interest-earning assets
118.7
117.2
109.0
1.5
1 %
9.8
9 %
271
Total noninterest-earning assets
11.9
11.5
11.4
0.4
4 %
0.5
5 %
272
Total assets
130.7
$
128.7
$
120.4
$
2.0
$
2 %
10.3
$
9 %
273
Low-cost core deposits
49.7
48.7
48.1
1.0
2 %
1.7
4 %
274
Money market deposits
33.2
32.4
33.9
0.8
3 %
(0.7)
(2) %
275
Term deposits
11.9
10.6
11.3
1.3
12 %
0.6
6 %
276
Total deposits
94.8
$
91.7
$
93.2
$
3.1
$
3 %
1.6
$
2 %
277
Total borrowed funds
14.0
15.0
5.7
(1.0)
(6) %
8.4
147 %
278
Total liabilities
111.5
$
109.3
$
101.0
$
2.2
$
2 %
10.5
$
10 %
279
Total stockholders' equity
19.2
19.4
19.4
(0.2)
(1) %
(0.2)
(1) %
280
Total liabilities and equity
130.7
$
128.7
$
120.4
$
2.0
$
2 %
10.3
$
9 %
1
Prior year quarter: |
 $44.8B
$46.2B
$47.4B
$47.8B
$49.4B
3.68%
3.70%
3.69%
3.67%
3.68%
4Q13
1Q14
2Q14
3Q14
4Q14
Total loans and leases
Loan yields
$35.7B
$36.6B
$37.4B
$37.8B
$38.9B
2.74%
2.71%
2.67%
2.61%
2.63%
4Q13
1Q14
2Q14
3Q14
4Q14
Total loans and leases
Loan yields
$5.6B
$4.6B
$4.4B
$4.2B
$4.0B
4.28%
4.46%
4.99%
4.30%
4.43%
4Q13
1Q14
2Q14
3Q14
4Q14
Total loans and leases
Loan yields
Total average loans and leases and LHFS
Linked quarter:
Consumer Banking segment loans increased $1.5 billion
Purchased $493 million of residential mortgages and
$415 million of auto loans in 4Q14
~$550 million remaining growth across mortgage, auto
and student portfolios
Consumer loan yields up one basis point, reflects loan
yield initiatives offsetting the impact of the persistent
low-rate environment
Commercial Banking segment loans increased $1.1 billion on
strength in Asset Finance, Mid-Corporate, Commercial Real
Estate, and Franchise Finance
Loan yields increased two basis points largely reflecting
higher loan fees and interest recoveries, partially offset
by the continued effect of the low-rate environment
Purchased $400 million oil & gas reserve-based lending
portfolio from RBS, which increased average loans by
$216 million
Other loans decreased $217 million reflecting continued
runoff in the non-core portfolio
11
Highlights
Consumer Banking
Average loans
Commercial Banking
Other
Average loans
1
Includes loans held for sale.
2
Excludes the impact of interest rate swaps.
1
1
1
Average loans
2 |
 Average deposits
and rates Linked quarter:
Average deposits increased $3.1 billion, or 3%, with growth in
all categories and particular strength in Commercial Banking
–
Term deposits up $1.3 billion, money market & savings up
$760 million, interest checking up $563 million and DDA up
$502 million
–
Total deposit costs increased 2 basis points to 0.20%,
reflecting shift in mix to longer duration deposits
12
Highlights
1
1
Average deposits and
deposits held for sale
$93.2B
$91.6B
$92.2B
$91.7B
$94.8B
0.17%
0.16%
0.15%
0.18%
0.20%
0.24%
0.22%
0.22%
0.25%
0.28%
4Q13
1Q14
2Q14
3Q14
4Q14
Term & time deposits
Checking
with
interest
Non int bearing deposits
Money market & savings
Int bearing HFS
Non-int bearing HFS
Total deposit costs
Int bearing deposit costs |
 Capital and
liquidity remain strong 13
Highlights
Loan-to-deposit ratio
5
Capital ratio trend
95%
95%
97%
97%
98%
4Q13
1Q14
2Q14
3Q14
4Q14
1
1
Capital levels remain well above regional
peers
–
As part of plan to adjust capital mix we
completed $334 million sub-debt
issuance/14.3 million share repurchase
on October 8th with RBS
4Q14 Basel III common equity tier 1 down
approximately 40 basis points from 3Q14
–
Net income: 18 bps increase
–
RWA growth: 30 bps decrease
–
Share repurchase: 30 bps decrease
–
Dividend/other: 5 bps decrease
LDR remained relatively stable at 98%
despite strong loan growth
Already meet initial LCR requirement
4
Issued $1.5 billion in senior notes
as of
$s in billions (period-end)
4Q13
1Q14
2Q14
3Q14
4Q14
Basel I
1
Tier 1 common capital
13.3
$
13.5
$
13.4
$
13.3
$
13.2
$
Basel I risk-weighted assets
98.6
$
100.4
$
101.4
$
103.2
$
106.1
$
13.5 %
13.4 %
13.3 %
12.9 %
12.4 %
Total capital ratio
16.1 %
16.0 %
16.2 %
16.1 %
15.8 %
Basel III
1,2,3
Common equity tier 1 capital ratio
13.1 %
13.1 %
13.0 %
12.5 %
12.1 %
Basel III minimum for CET1 ratio
2015
2016
2017
2018
2019
Basel III minimum plus
Phased-in capital conservation buffer
4.5 %
5.1 %
5.8 %
6.4 %
7.0 %
Tier 1 common equity ratio
1
2
3
4
5
Current reporting period regulatory capital ratios are preliminary. Pro forma Basel III
ratios assume that certain definitions impacting qualifying Basel III capital, which otherwise will phase in through 2018, are fully phased-in. Ratios also
reflect the required US Standardized methodology for calculating RWAs, effective January 1,
2015. Non-GAAP
item. See important information on use of Non-GAAP items in the Appendix.
Based on the September 2014 release of the U.S. version of the Liquidity Coverage Ratio (LCR).
Note that as a modified LCR company, CFG’s formal compliance requirement of 90%
does not begin until January 2016.
Includes held for sale.
16.1%
16.0%
16.2%
16.1%
15.8%
13.5%
13.4%
13.3%
12.9%
12.4%
4Q13
1Q14
2Q14
3Q14
4Q14
Basel
I
total
capital
ratio
Basel
I
tier
1
common
equity
ratio |
 $18
($8)
($13)
$4
$2
$79
$80
$70
$75
$72
$18
$15
$11
$9
$6
$115
$87
$68
$88
$80
0.53%
0.41%
0.31%
0.38%
0.35%
4Q13
1Q14
2Q14
3Q14
4Q14
Commercial
Retail
SBO
Net c/o ratio
$115
$87
$68
$88
$80
$132
$121
$49
$77
$72
$1.4B
$1.4B
$1.2B
$1.1B
$1.1B
4Q13
1Q14
2Q14
3Q14
4Q14
Net charge-offs
Provision
NPLs
$1,221
$1,259
$1,210
$1,201
$1,195
86%
92%
101%
111%
109%
4Q13
1Q14
2Q14
3Q14
4Q14
Allowance for loan and lease losses
Coverage Ratio
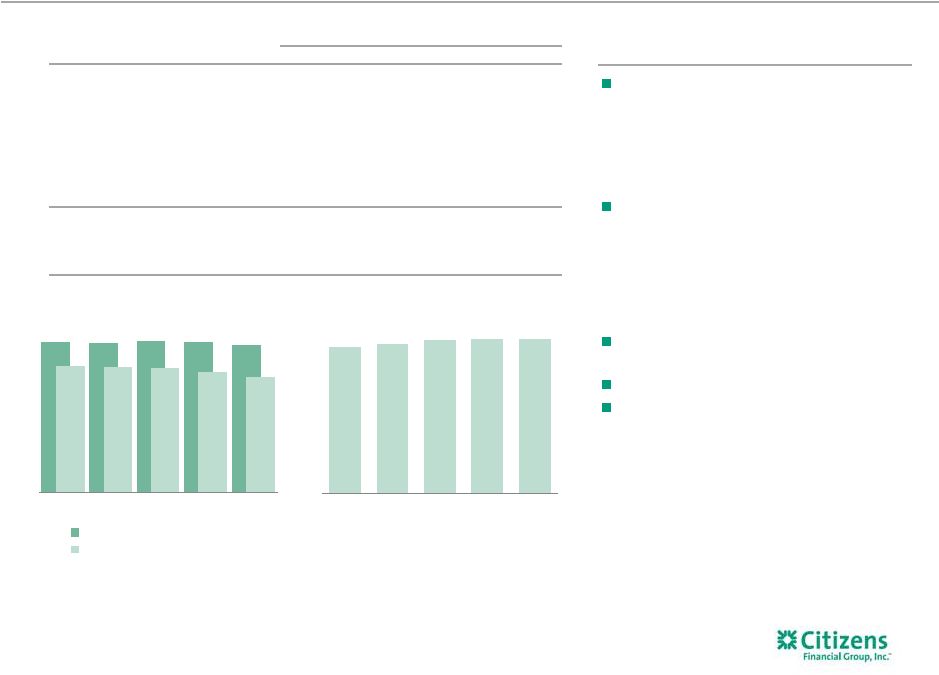
Credit quality continues to improve
Overall credit quality remains strong
Net charge-offs were $80 million, or 0.35% of average loans
and leases
Allowance coverage for NPLs remained relatively stable at
109% vs. 111% in 3Q14
Provision for credit losses of $72 million decreased $5 million
vs. 3Q14
Results reflect reserve release of $8 million vs. $11 million
in 3Q14
NPLs to total loans stable, 1.18% vs. 1.19% in 3Q14
14
Highlights
Net charge-offs (recoveries)
Provision for credit losses, charge-offs, NPLs
Allowance for loan and lease losses
$s in millions
1 Allowance
for
loan
and
lease
losses
to
nonperforming
loans
and
leases.
For credit
losses
1 |
 7
8
9
10
11b
11c
Summary of progress on strategic initiatives
15
1
2
3
4
6
5
11a
2014 Status
INITIATIVE
2015
Outlook
Commentary
CFG
Execution
Market
Condition
Reenergize household growth
Arrested household decline with new offerings. Contending with
competition and reduced foot traffic. Key is training/improved lead
generation.
Expand mortgage sales force
Achieved 2014 hiring goals; increased LOs by 66 in FY14 including 41 in
Q4, with attrition starting to normalize.
Market conforming product mix and refi
activity
are
wild
cards.
Grow Auto
Performed well in 2014 with 35% YoY
portfolio
growth
&
yield
expansion
throughout the year (+10bps from 1Q’14 to 4Q’14).
Grow Student
Strong new refi product origination of $169 million in 4Q’14.
Expand Business Banking
Expand Wealth sales force
Build out Mid-Corp & verticals
Met RM hiring goals in 2014 and well-positioned for growth in 2015.
Continue development of Capital
Markets
Capital markets rank and fees up nicely in 2014. Improved capabilities in
FX and Sales & Trading will be operational in 2015.
Build out Treasury Solutions
New leader in place. Expect to see ramp up in benefits from recent
people and technology investments over 2015.
Grow Franchise Finance
Solid loan origination & deposit performance expected to continue.
Strong market conditions have created competitive hiring environment
for financial consultants.
Strong
performance
due
to
pace
of
new
client
acquisition
(60+
in
’14).
Core: Middle Market
portfolio run-off and optimizing pricing.
Strong origination activity expected to continue; focus on reducing
Core: CRE
CRE loans up 12% YoY
expected with focus on improvements in yield.
Core: Asset Finance
2015 performance continues to look promising.
to
$7.8
billion
at
YE
2014.
Continued
momentum |
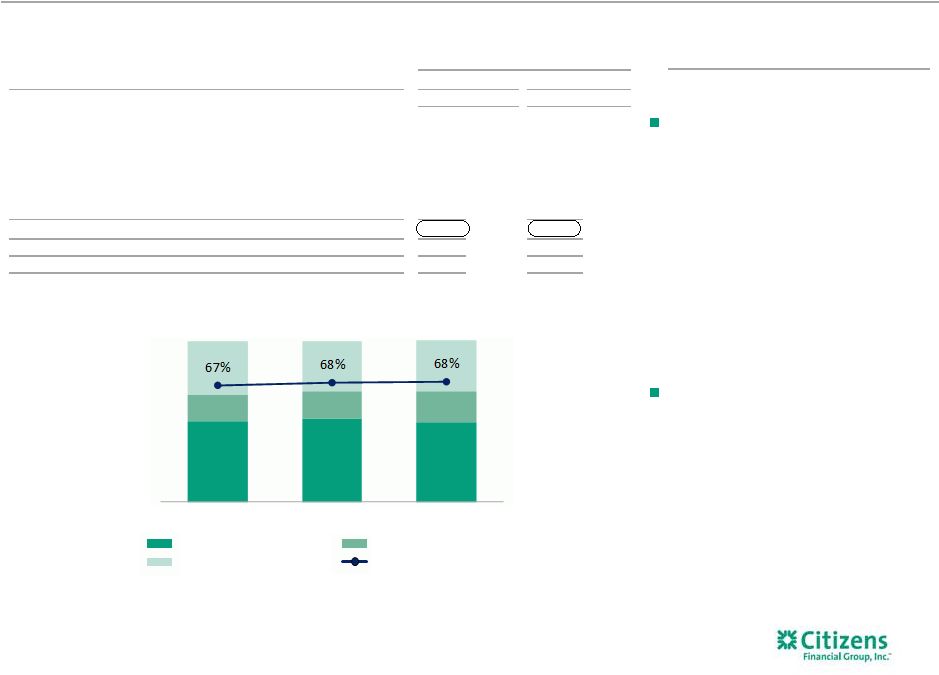
 Steady progress
against key financial targets 16
Key Indicators
4Q13
4Q14
End 2016
targets
Adjusted return on average tangible common
equity
1
5.2%
6.8%
10%+
Adjusted return on average total tangible
assets
1
0.6%
0.7%
1.0%+
Adjusted efficiency ratio
1
68%
67%
~60%
Tier 1 common equity ratio
2
13.5%
12.4%
~11%
3
Delivering on our plan to improve returns
1
Non-GAAP item. Adjusted results exclude the effect of net restructuring charges and
special items associated with Chicago Divestiture, efficiency and effectiveness
programs and separation from RBS. See important information on use of Non-GAAP items in the Appendix.
2
Current reporting period regulatory capital ratio is preliminary.
3
Target represents fully phased in Basel III. |
 1Q15/FY2015
outlook 17
Net interest
income, net
interest margin
Target 5-7% earning asset growth
Net interest margin broadly stable, though with
risks
Operating
leverage, efficiency
ratio
Credit trends
and cost
Adjusted expense growth relatively modest
Target mid-single digit operating leverage
Efficiency ratio improves to mid 60’s
Credit costs $350-400 million given reserve
build
Broadly stable asset quality trends
FY2015 expectations vs. FY2014
Earning asset growth consistent with 4Q14/3Q14
Net interest margin relatively stable
Day count impact of $12 million
Seasonal expense growth –
low single digits
Stable asset quality trends
Provision tick up assuming no reserve release
Restructuring
costs
Restructuring costs of $30-$50 million, all in
1H15
Restructuring costs of $15-$20 million in 1Q
1Q15 expectations vs. 4Q14
Capital, liquidity
and funding
Year-end B3 common equity Tier 1 ratio ~11.5%
Loan-to-deposit ratio ~100%
Focusing on cost-effective deposit growth
Quarter-end B3 common equity Tier 1 ratio
~12.1%
Loan-to-deposit ratio 98-99%
Continue to diversify funding sources
•
Expected FY 2015 effective tax rate of ~33.5% up from 31.8% in 2014. Low income housing credit
accounting change expected to increase fees and taxes by $48 million in 2015 impacting
rate by ~2.5%. |
 Key
messages 18
Underlying business performance continues to make progress, marked
by loan growth, positive operating leverage and growing customer
satisfaction
2014 was a successful transition year, with Chicago region gain funding
various initiatives to drive better performance over 2015/2016
Tracking well on all strategic and regulatory initiatives, maintain intense
focus on execution
Asset quality and capital ratios remain strong |
 Appendix
19 |
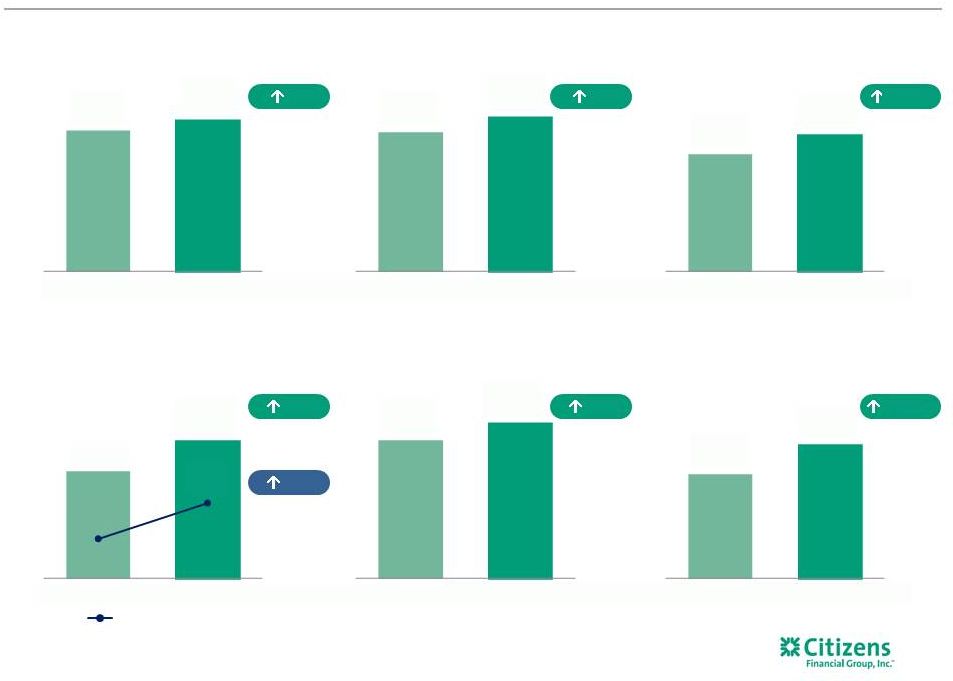 Quarter over
quarter results 20
Adjusted pre-provision profit
$s in millions
Adjusted return on average
tangible assets
Adjusted net income
$s in millions
Adjusted return on average
Period-end loans
$s in billions
Period-end deposits
$s in billions
Adjusted Diluted EPS
6%
9%
28%
10%
152 bps
30%
1
2
1
1
2
1
$366
$388
4Q13
4Q14
$169
$217
$0.39
4Q13
4Q14
$85.9
$93.4
4Q13
4Q14
$86.9
$95.7
4Q13
4Q14
0.59%
0.69%
4Q13
4Q14
5.24%
6.76%
4Q13
4Q14
$0.30
1
tangible common equity
10 bps
1
Adjusted results are non-GAAP items and exclude the effect of net restructuring charges
and special items associated with Chicago Divestiture, efficiency and
effectiveness programs and separation from RBS. See important information on use of
Non-GAAP items in the Appendix.
2
Excludes loans and deposits held for sale. |
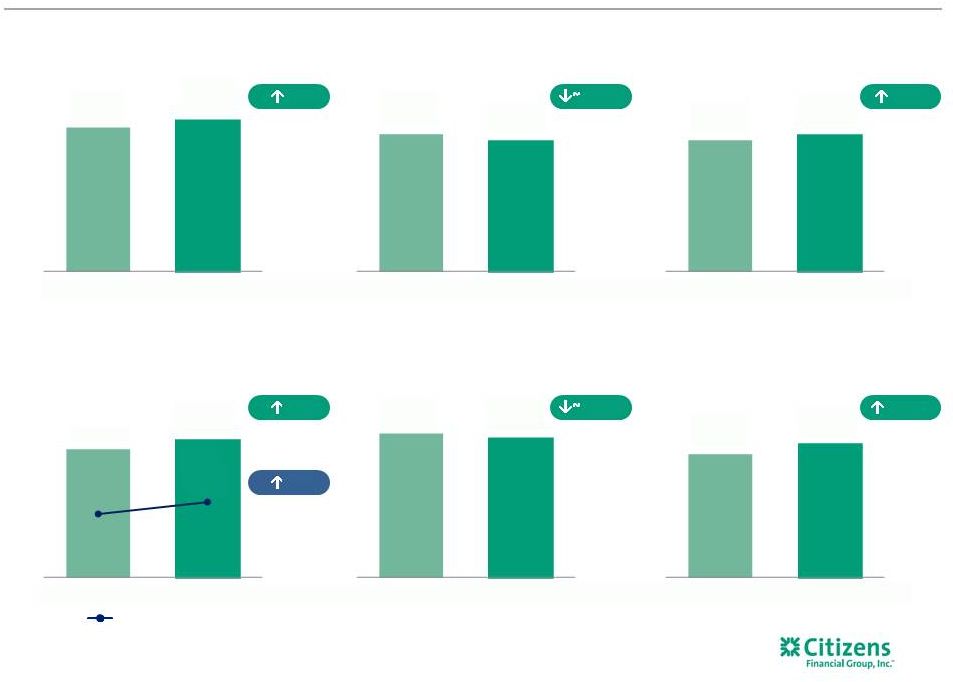 Linked quarter
results 21
Adjusted pre-provision profit
$s in millions
Basel I tier 1 common equity
capital ratio
Adjusted return on average
tangible assets
Adjusted net income
$s in millions
Adjusted return on average
Leverage ratio
Adjusted Diluted EPS
4%
50 bps
3 bps
7%
30 bps
54 bps
8%
1
2
1
2
1
tangible common equity
1
$372
$388
3Q14
4Q14
12.9%
12.4%
3Q14
4Q14
0.66%
0.69%
3Q14
4Q14
10.9%
10.6%
3Q14
4Q14
6.22%
6.76%
3Q14
4Q14
$202
$217
$0.36
$0.39
3Q14
4Q14
1
1
Adjusted results are non-GAAP items and exclude the effect of net restructuring charges
and special items associated with Chicago Divestiture, efficiency and effectiveness
programs and separation from RBS. See important information on use of Non-GAAP items in
the Appendix.
2
Current reporting period regulatory capital ratios are preliminary. |
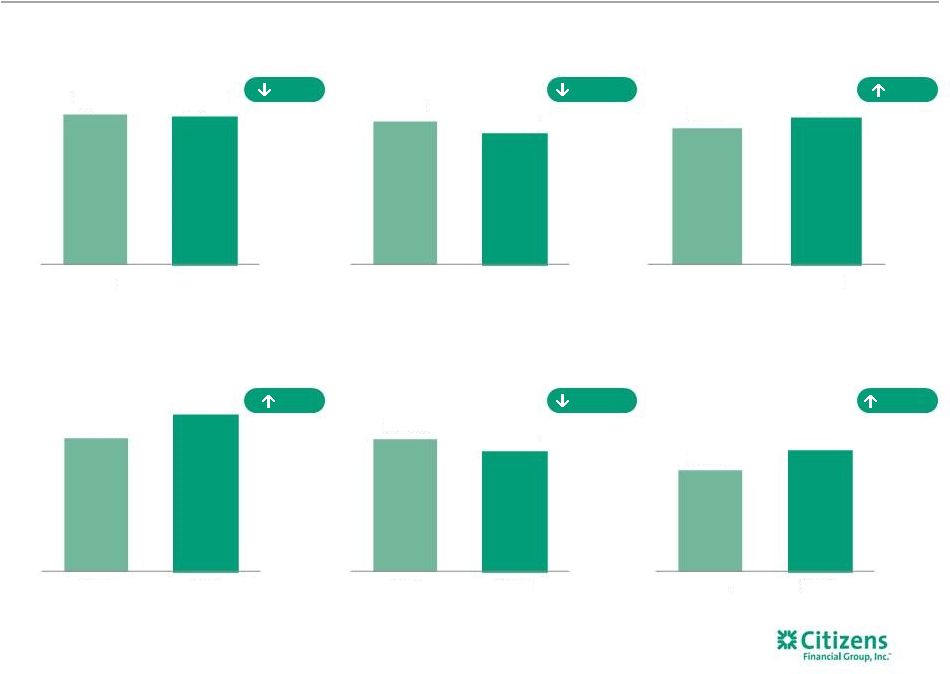 Full year
results 22
Adjusted pre-provision profit
1
$s in millions
Basel I tier 1 common equity
capital ratio
2
Adjusted return on average
tangible assets
1
Adjusted net income
1
$s in millions
Adjusted return on average
tangible common equity
1
Leverage ratio
2
105 bps
5 bps
~100 bps
~110 bps
0.3%
1
2
18%
$1,472
$1,468
2013
2014
13.5%
12.4%
2013
2014
0.60%
0.65%
2013
2014
$671
$790
2013
2014
11.6%
10.6%
2013
2014
5.08%
6.13%
2013
2014
Adjusted results are non-GAAP items and exclude the effect of net restructuring charges
and special items associated with Chicago Divestiture, efficiency and effectiveness
programs and separation from RBS. See important information on use of Non-GAAP items in the Appendix.
Current reporting period regulatory capital ratios are preliminary.
|
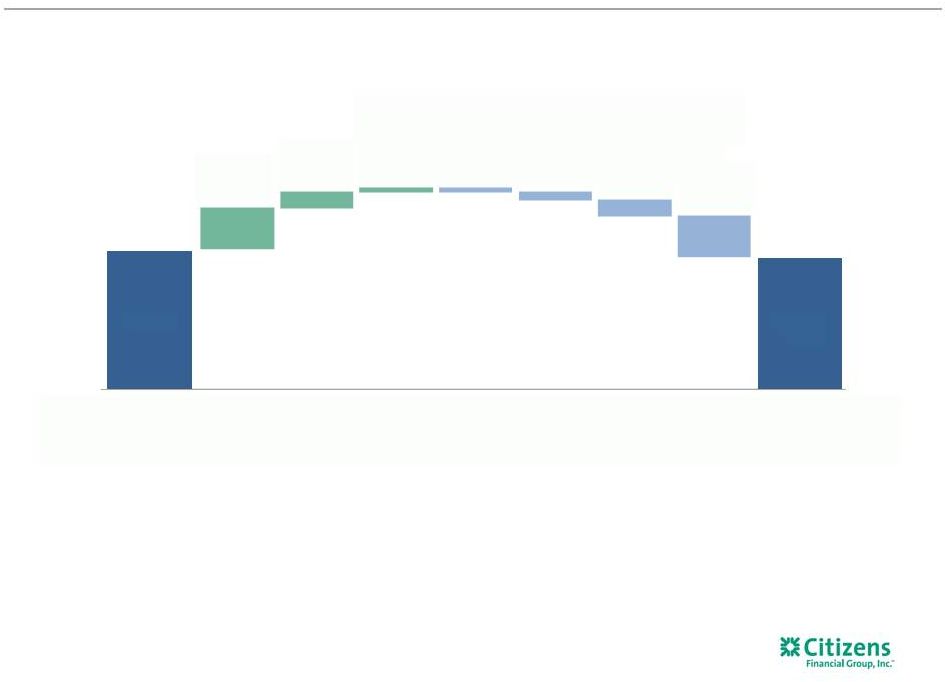
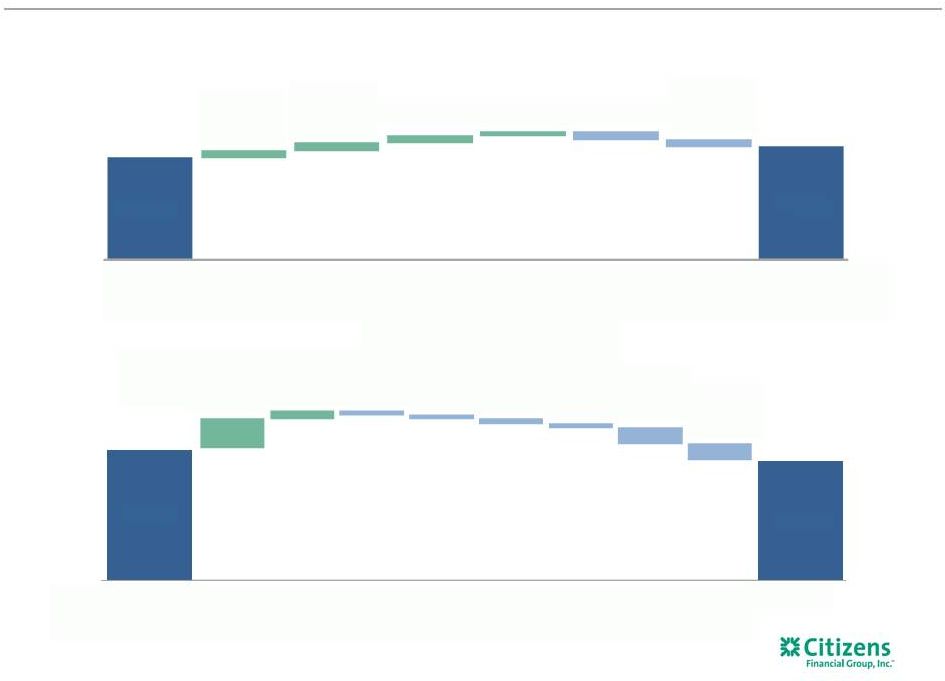 Net interest
margin NIM% walk 4Q13 to 4Q14
NIM% walk 3Q14 to 4Q14
23
4Q13 NIM%
Pay-fixed
swap costs
Investment
yields
Investment
portfolio
growth
Deposit
yields
Chicago
Divestiture
Loan growth/
mix/fees
Loan
yields
Sub-debt
issuance
4Q14 NIM%
3Q14 NIM%
Excess cash
at Fed
Investment
yields
Loan growth/
mix/fees
Pay-fixed
swap costs
Deposit growth/
yields
Sub-debt
issuance
4Q14 NIM%
2.77%
2.80%
0.02%
0.02%
0.02%
0.01%
(0.02%)
(0.02%)
2.83%
2.80%
0.07%
0.02%
(0.01%)
(0.01%)
(0.01%)
(0.01%)
(0.04%)
(0.04%) |
 Net interest
margin NIM% walk FY2013 to FY2014
24
FY2013 NIM%
Pay-fixed swap
cost
Deposit
mix/yields
Other
borrowings
Chicago
Divestiture
Investment
portfolio
growth
Sub-debt
issuance
Loan growth/
mix/fees
FY2014 NIM%
2.85%
2.83%
0.10%
0.04%
0.01%
(0.01%)
(0.02%)
(0.04%)
(0.10%) |
 Consumer Banking
segment 25
Highlights
1
Non-GAAP item. Adjusted results exclude the effect of net restructuring charges and
special items associated with Chicago Divestiture, efficiency and effectiveness
programs and separation from RBS. See important information on use of Non-GAAP items in the Appendix.
2
Includes held for sale.
3
Operating segments are allocated capital on a risk-adjusted basis considering economic and
regulatory capital requirements. We approximate that regulatory capital is equivalent
to a sustainable target level for Tier 1 common equity and then allocate that
approximation to the segments based on economic capital.
Linked quarter:
Consumer Banking net income down $2
million with pre-provision profit down
$6 million
Net interest income increased $4
million driven by the benefit of loan
growth and improved loan yields,
partially offset by higher deposit costs
–
Average loans up $1.5 billion
–
Average deposits up $765 million
–
Mortgage originations up 8%
Noninterest expense increased $2
million driven by $7 million increase in
advertising, including $5 million related
to the launch of our new education
refinance product, as well as higher
equipment expense, largely offset by
lower insurance and franchise tax
expense as well as the benefit of
efficiency initiatives
Noninterest income decreased $8
million driven by a $5 million change
in mortgage banking fees, which
included a $7 million change in MSR
valuation
4Q14 change from
$s in millions
4Q14
3Q14
4Q13
3Q14
4Q13
$
%
$
%
310
Net interest income
536
$
532
$
543
$
4
$
1 %
(7)
$
(1) %
311
Noninterest income
218
226
235
(8)
(4) %
(17)
(7) %
312
Total revenue
754
758
778
(4)
(1) %
(24)
(3) %
313
Noninterest expense
611
609
638
2
—
%
(27)
(4) %
314
Profit before provision for
credit losses
143
149
140
(6)
(4) %
3
2 %
315
Provision for credit losses
64
66
65
(2)
(3) %
(1)
(2) %
316
Income before income tax
expense
79
83
75
(4)
(5) %
4
5 %
317
Income tax expense
27
29
25
(2)
(7) %
2
8 %
318
Net income
52
$
54
$
50
$
(2)
$
(4) %
2
$
4 %
Average balances
319
Total
loans
and
leases
2
49.4B
$
47.8B
$
44.8B
$
1.5B
$
3 %
4.6B
$
10 %
320
Total deposits
66.4B
$
65.6B
$
71.4B
$
0.8B
$
1 %
(5.0B)
$
(7) %
Mortgage Banking metrics
Originations
1,101
$
1,018
$
926
$
83
$
8 %
175
$
19 %
Origination Pipeline
1,110
973
663
137
14 %
447
67 %
Gain on sale of secondary
originations
1.96%
1.69%
1.20%
27
bps
76
bps
Performance metrics
321
ROTCE
1,3
4.30%
4.57%
4.40%
(27)
bps
(10)
bps
322
Efficiency ratio
1
81%
80%
82%
67
bps
(75)
bps |
 Commercial
Banking segment 26
Highlights
1
Non-GAAP item. Adjusted results exclude the effect of net restructuring charges and
special items associated with Chicago Divestiture, efficiency and effectiveness
programs and separation from RBS. See important information on use of Non-GAAP items in the Appendix.
2
Includes held for sale.
3
Operating segments are allocated capital on a risk-adjusted basis considering economic and
regulatory capital requirements. We approximate that regulatory capital is equivalent
to a sustainable target level for Tier 1 common equity and then allocate that
approximation to the segments based on economic capital.
4Q14 change from
$s in millions
4Q14
3Q14
4Q13
3Q14
4Q13
$
%
$
%
323
Net interest income
283
$
270
$
260
$
13
$
5 %
23
$
9 %
324
Noninterest income
111
104
105
7
7 %
6
6 %
325
Total revenue
394
374
365
20
5 %
29
8 %
326
Noninterest expense
180
162
164
18
11 %
16
10 %
327
Profit before provision for
credit losses
214
212
201
2
1 %
13
6 %
328
Provision for credit losses
1
—
14
1
—
%
(13)
(93) %
329
Income before income tax
expense
213
212
187
1
—
%
26
14 %
330
Income tax expense
73
73
64
—
—
%
9
14 %
331
Net income
140
$
139
$
123
$
1
$
1 %
17
$
14 %
Average balances
332
Total loans and leases
2
38.9B
$
37.8B
$
35.7B
$
1.1B
$
3 %
3.2B
$
9 %
333
Total deposits
22.5B
$
21.0B
$
17.6B
$
1.5B
$
7 %
4.9B
$
28 %
Performance metrics
334
ROTCE
1,3
12.76%
13.10%
12.10%
(34)
bps
66
bps
335
Efficiency ratio
1
45%
43%
45%
213
bps
75
bps
Linked quarter:
Commercial Banking net income
increased $1 million from 3Q14
Total revenue up $20 million with net
interest income up $13 million on a 3%
increase in loans and 7% increase in
deposits
–
Strength in Asset Finance, Mid-
Corporate, Commercial Real Estate,
Healthcare, and Franchise Finance
–
Deposits up $1.5 billion, or 7%
Noninterest income up $7 million
driven by leasing, capital markets,
and card fees
Noninterest expense up $18 million
driven by higher regulatory costs,
operating lease residual write-down,
incentives and recruiting expense |
 Other
Linked quarter:
Other net income increased $9
million from 3Q14
–
Net interest income increased
$3 million, driven by lower
swap expense and higher
investment securities
interest, partially offset by
increased wholesale funding
–
Noninterest income
decreased $1 million
–
Noninterest expense
decreased $6 million from
3Q14, despite a $12 million
increase in restructuring
charges and special items
27
Highlights
1
Includes held for sale.
4Q14 change from
$s in millions
4Q14
3Q14
4Q13
3Q14
4Q13
$
%
$
%
336
Net interest income (expense)
21
$
18
$
(24)
$
3
$
17 %
45
$
188 %
337
Noninterest income
10
11
39
(1)
(9) %
(29)
(74) %
338
Total revenue
31
29
15
2
7 %
16
107 %
339
Noninterest expense
33
39
16
(6)
(15) %
17
106 %
340
Profit (loss) before provision
for credit losses
(2)
(10)
(1)
8
80 %
(1)
(100) %
341
Provision for credit losses
7
11
53
(4)
(36) %
(46)
(87) %
342
Income (loss) before income
tax expense
(9)
(21)
(54)
12
57 %
45
83 %
343
Income tax expense (benefit)
(14)
(17)
(33)
3
18 %
19
58 %
344
Net income (loss)
5
$
(4)
$
(21)
$
9
$
225 %
26
$
124 %
Average balances
345
Total loans and leases
1
4.0B
$
4.2B
$
5.6B
$
(0.2B)
$
(5) %
(1.6B)
$
(28) %
346
Total deposits
5.9B
$
5.1B
$
4.1B
$
0.8B
$
17 %
1.8B
$
43 % |
 Restructuring
charges and special items 28
GAAP results included restructuring charges and special items related to enhancing efficiencies
and improving processes across the organization and separation from the Royal Bank of
Scotland Group plc (“RBS”). Expect
to
utilize
the
balance
of
the
Chicago
Divestiture
gain
to
continue
to
reinvest
to
drive
future
growth,
and
to
fund
an
additional
$30-$50
million
of
further
restructuring
charges
and
special
expense
items
in
in
1H15.
as of and for the three months ended
as of and for the twelve months ended
Restructuring charges and special items
($s in millions, except per share data)
pre-tax
after-tax
pretax
after tax
pre-tax
after-tax
pre-tax
after-tax
Noninterest income special items:
Other income
Net Gain on Chicago Divestiture
—
$
—
$
—
$
—
$
288
$
180
$
—
$
—
$
Total noninterest income restructuring
charges and special items
—
$
—
$
—
$
—
$
288
$
180
$
—
$
—
$
Noninterest expense restructuring charges
and special items:
Salaries and employee benefits
1
—
—
—
44
27
5
3
Outside services
18
12
19
12
78
50
—
—
Occupancy
5
3
2
1
16
10
11
8
Equipment expense
1
—
—
—
4
2
7
4
Software expense
6
4
—
—
6
4
—
—
Other operating expense
2
1
—
—
21
12
3
2
Goodwill impairment
—
—
—
—
—
—
4,435
4,080
Total noninterest expense restructuring
charges and special items
33
$
20
$
21
$
13
$
169
$
105
$
4,461
$
4,097
$
Net restructuring charges and special items
(33)
$
(20)
$
(21)
$
(13)
$
119
$
75
$
(4,461)
$
(4,097)
$
Diluted EPS impact
(0.03)
$
(0.02)
$
0.13
$
(7.32)
$
December 31, 2014
September 30, 2014
December 31, 2014
December 31, 2013 |
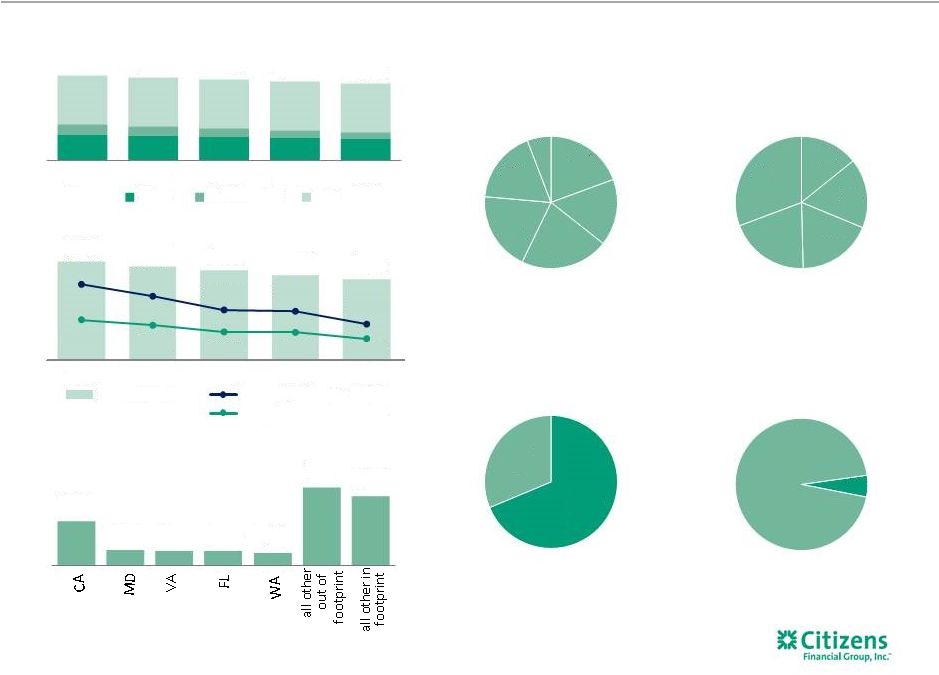 Non-core
home equity portfolio serviced by others (SBO) SBO balances by FICO
SBO balances by LTV
SBO balances and charge-offs
Top
5
SBO
balances
by
state
Non-core period-end loans
SBO
balances
by
product
SBO Lien Position
1st Lien
2nd Lien
< 70
70-79
80-89
90-99
100-119
120+
< 620
620-679
680-719
720-759
760+
HE Loan
HELOC
29
$s in millions
1
A portion of the serviced by others portfolio is serviced by CFG.
2
SBO distribution gross period-end balances as of December 31, 2014.
3
FICO scores updated quarterly.
SBO balance
Charge-offs loans
Charge-offs line of credit
2
2,3
2
2
2
$3.8B
$3.6B
$3.4B
$3.2B
$3.0B
4Q13
1Q14
2Q14
3Q14
4Q14
Retail
Commercial
SBO
$2.2B
$2.1B
$2.0B
$1.9B
$1.8B
4.02%
3.32%
2.51%
2.43%
1.67%
1.93%
1.60%
1.21%
1.18%
0.81%
4Q13
1Q14
2Q14
3Q14
4Q14
$331
$116
$112
$109
$96
$583
$515
19%
16%
22%
19%
18%
6%
14%
17%
18%
20%
31%
5%
95%
$1.3B
69%
$0.6B
31%
1 |
 Non-GAAP
Financial Measures 30
This document contains non-GAAP financial measures. The table below presents
reconciliations of certain non-GAAP measures. These reconciliations exclude goodwill
impairment, restructuring charges and/or special items, which are usually included, where
applicable, in the financial results presented in accordance with GAAP. Special
items include regulatory expenses and expenses relating to our initial public offering.
The non-GAAP measures set forth below include "total revenue", "noninterest
income"," noninterest expense", "pre-provision profit", "income before income tax expense
(benefit)", "income tax expense (benefit)", "net income (loss)",
"salaries and employee benefits", "outside services", "occupancy", "equipment expense", "amortization of
software", "other operating expense", "net income (loss) per average common
share", "return of average common equity" and "return on average total assets". In addition,
we present computations for "tangible common equity (period-end)', "pro forma
Basel III common equity tier 1 capital", "return on average tangible common equity", "return
on average total tangible assets" and "efficiency ratio" as part of our
non-GAAP measures.“ We believe these non-GAAP measures provide useful information to investors because these
are among the measures used by our management team to evaluate our operating
performance and make day-to-day operating decisions. In addition, we believe goodwill impairment, restructuring charges and special items in any period do not
reflect the operational performance of the business in that period and, accordingly, it is
useful to consider these line items with and without goodwill impairment, restructuring
charges and special items. We believe this presentation also increases comparability of period-to-period results.
We also consider pro forma capital ratios defined by banking regulators but not effective at
each period end to be non-GAAP financial measures. Since analysts and banking
regulators may assess our capital adequacy using these pro forma ratios, we believe they are
useful to provide investors the ability to assess our capital adequacy on the same
basis.
Other companies may use similarly titled non-GAAP financial measures that are calculated
differently from the way we calculate such measures. Accordingly, our non-GAAP
financial measures may not be comparable to similar measures used by other companies. We
caution investors not to place undue reliance on such non-GAAP measures, but
instead to consider them with the most directly comparable GAAP measure. Non-GAAP
financial measures have limitations as analytical tools, and should not be considered
in isolation, or as a substitute for our results as reported under GAAP. |
 Non-GAAP
Reconciliation Table 31
(Excluding restructuring charges and special items)
$s in millions, except per share data
4Q14
3Q14
2Q14
1Q14
4Q13
2014
2013
Noninterest income, excluding special items:
Noninterest income (GAAP)
A
$339
$341
$640
$358
$379
$1,678
$1,632
Less: Special items -
Chicago gain
—
—
288
—
—
288
—
Noninterest income, excluding special items (non-GAAP)
B
$339
$341
$352
$358
$379
$1,390
$1,632
Total revenue, excluding special items:
Total revenue (GAAP)
C
$1,179
$1,161
$1,473
$1,166
$1,158
$4,979
$4,690
Less: Special items -
Chicago gain
—
—
288
—
—
288
—
Total revenue, excluding special items (non-GAAP)
D
$1,179
$1,161
$1,185
$1,166
$1,158
$4,691
$4,690
Noninterest expense, excluding restructuring charges and special
items:
Noninterest expense (GAAP)
E
$824
$810
$948
$810
$818
$3,392
$7,679
Less: Restructuring charges and special expense items
JJ
33
21
115
—
26
169
4,461
Noninterest expense, excluding restructuring charges and special
items (non-GAAP)
F
$791
$789
$833
$810
$792
$3,223
$3,218
Net income (loss), excluding restructuring charges and special
items:
Net income (loss) (GAAP)
G
$197
$189
$313
$166
$152
$865
($3,426)
Add: Restructuring charges and special items, net of income
tax expense (benefit)
20
13
(108)
—
17
(75)
4,097
Net income (loss), excluding restructuring charges and special
items (non-GAAP)
H
$217
$202
$205
$166
$169
$790
$671
Return on average common equity, excluding restructuring
charges and special items:
Average common equity (GAAP)
I
$19,209
$19,411
$19,607
$19,370
$19,364
$19,399
$21,834
Return on average common equity, excluding restructuring
charges and special items (non-GAAP)
H/I
4.48 %
4.14 %
4.19 %
3.48 %
3.47 %
4.07 %
3.08 %
Return on average tangible common equity and return on
average tangible common equity, excluding restructuring charges
and special items:
Average common equity (GAAP)
I
$19,209
$19,411
$19,607
$19,370
$19,364
$19,399
$21,834
Less: Average goodwill (GAAP)
6,876
6,876
6,876
6,876
6,876
6,876
9,063
Less: Average other intangibles (GAAP)
6
6
7
7
8
7
9
Add: Average deferred tax liabilities related to goodwill
(GAAP)
403
384
369
351
342
377
459
Average tangible common equity (non-GAAP)
J
$12,730
$12,913
$13,093
$12,838
$12,822
$12,893
$13,221
Return on average tangible common equity (non-GAAP)
G/J
6.12 %
5.81 %
9.59 %
5.24 %
4.71 %
6.71 %
(25.91)%
Return on average tangible common equity, excluding
restructuring charges and special items (non-GAAP)
H/J
6.76 %
6.22 %
6.28 %
5.24 %
5.24 %
6.13 %
5.08 %
Return on average total assets, excluding restructuring charges
and special items:
Average total assets (GAAP)
K
$130,671
$128,691
$127,148
$123,904
$120,393
$127,624
$120,866
Return on average total assets, excluding restructuring charges
and special items (non-GAAP)
H/K
0.66 %
0.62 %
0.65 %
0.54 %
0.56 %
0.62 %
0.56 %
Return on average total tangible assets and return on average
total tangible assets, excluding restructuring charges and special
items:
Average total assets (GAAP)
K
$130,671
$128,691
$127,148
$123,904
$120,393
$127,624
$120,866
Less: Average goodwill (GAAP)
6,876
6,876
6,876
6,876
6,876
6,876
9,063
Less: Average other intangibles (GAAP)
6
6
7
7
8
7
9
Add: Average deferred tax liabilities related to goodwill
(GAAP)
403
384
369
351
342
377
459
Average tangible assets (non-GAAP)
L
$124,192
$122,193
$120,634
$117,372
$113,851
$121,118
$112,253
Return on average total tangible assets (non-GAAP)
G/L
0.63 %
0.61 %
1.04 %
0.57 %
0.53 %
0.71 %
(3.05)%
Return on average total tangible assets, excluding restructuring
charges and special items (non-GAAP)
H/L
0.69 %
0.66 %
0.68 %
0.57 %
0.59 %
0.65 %
0.6 %
QUARTERLY TRENDS
FULL YEAR |
 Non-GAAP
Reconciliation Table 32
(Excluding restructuring charges and special items)
$s in millions, except per share data
$s in millions, except per share data
4Q14
3Q14
2Q14
1Q14
4Q13
2014
2013
Efficiency ratio and efficiency ratio, excluding restructuring charges and
special items:
Net interest income (GAAP)
$840
$820
$833
$808
$779
$3,301
$3,058
Add: Noninterest income (GAAP)
339
341
640
358
379
1,678
1,632
Total revenue (GAAP)
C
$1,179
$1,161
$1,473
$1,166
$1,158
$4,979
$4,690
Efficiency ratio (non-GAAP)
E/C
69.88 %
69.84 %
64.33 %
69.43 %
70.62 %
68.12 %
163.73 %
Efficiency ratio, excluding restructuring charges and special items
(non-GAAP)
F/D
67.11 %
68.02 %
70.23 %
69.43 %
68.35 %
68.70%
68.61 %
Net income (loss) per average common share -
basic and diluted,
excluding restructuring charges and special items:
Average common shares outstanding -
basic (GAAP)
M
546,810,009
559,998,324
559,998,324
559,998,324
559,998,324
556,674,146
559,998,324
Average common shares outstanding -
diluted (GAAP)
N
550,676,298
560,243,747
559,998,324
559,998,324
559,998,324
557,724,936
559,998,324
Net income (loss) applicable to common stockholders (GAAP)
O
197
189
313
166
152
865
(3,426)
Net income (loss) per average common share -
basic (GAAP)
O/
M
0.36
0.34
0.56
0.30
0.27
1.55
(6.12)
Net income (loss) per average common share -
diluted (GAAP)
O/N
0.36
0.34
0.56
0.30
0.27
1.55
(6.12)
Net income (loss) applicable to common stockholders, excluding
restructuring charges and special items (non-GAAP)
P
217
202
205
166
169
790
671
Net income per average common share -
basic, excluding restructuring
charges and special items (non-GAAP)
P/M
0.40
0.36
0.37
0.30
0.30
1.42
1.20
Net income per average common share -
diluted, excluding
restructuring charges and special items (non-GAAP)
P/N
0.39
0.36
0.37
0.30
0.30
1.42
1.20
Pro forma Basel III common equity Tier 1 capital ratio:
Tier 1 common capital (regulatory)
$13,173
$13,330
$13,448
$13,460
$13,301
Change in DTA and other threshold deductions (GAAP)
(6)
(5)
(7)
(7)
6
Basel III common equity Tier 1 (non-GAAP)
Q
$13,179
$13,335
$13,455
$13,467
$13,295
Risk-weighted assets (regulatory general risk weight approach)
105,964
103,207
101,397
100,368
98,634
Net change in credit and other risk-weighted assets (regulatory)
2,882
3,207
2,383
2,450
2,687
Basel III standardized approach risk-weighted assets (non-GAAP)
R
$108,846
$106,414
$103,780
$102,818
$101,321
Pro forma Basel III common equity Tier 1 capital ratio (non-GAAP)
Q/R
12.1 %
12.5 %
13.0 %
13.1 %
13.1 %
Salaries and employee benefits, excluding restructuring charges and
special items:
Salaries and employee benefits (GAAP)
S
$397
$409
$467
$405
$391
$1,678
$1,652
Less: Restructuring charges and special items
1
—
43
—
5
44
5
Salaries and employee benefits, excluding restructuring charges and
special items (non-GAAP)
T
$396
$409
$424
$405
$386
$1,634
$1,647
Outside services, excluding restructuring charges and special items:
Outside services (GAAP)
U
$106
$106
$125
$83
$101
$420
$360
Less: Restructuring charges and special items
18
19
41
—
—
78
—
Outside services, excluding restructuring charges and special items
(non-GAAP)
V
$88
$87
$84
$83
$101
$342
$360
Occupancy, excluding restructuring charges and special items:
Occupancy (GAAP)
W
$81
$77
$87
$81
$83
$326
$327
Less: Restructuring charges and special items
5
2
9
—
11
16
11
Occupancy, excluding restructuring charges and special items
(non-GAAP)
X
$76
$75
$78
$81
$72
$310
$316
Equipment expense, excluding restructuring charges and special items:
Equipment expense (GAAP)
Y
$63
$58
$65
$64
$68
$250
$275
Less: Restructuring charges and special items
1
—
3
—
7
4
7
Equipment expense, excluding restructuring charges and special items
(non-GAAP)
Z
$62
$58
$62
$64
$61
$246
$268
QUARTERLY TRENDS
FULL YEAR |
 Non-GAAP
Reconciliation Table 33
(Excluding restructuring charges and special items)
$s in millions, except per share data
4Q14
3Q14
2Q14
1Q14
4Q13
2014
2013
Amortization of software, excluding restructuring charges and
special items:
Amortization of software
AA
$43
$38
$33
$31
$32
$145
$102
Less: Restructuring charges and special items
6
—
—
—
—
6
—
Amortization of software, excluding restructuring charges and
special items (non-GAAP)
BB
$37
$38
$33
$31
$32
$139
$102
special items:
Other operating expense (GAAP)
CC
$134
$122
$171
$146
$143
$573
$528
Less: Restructuring charges and special items
2
—
19
—
3
21
3
special items (non-GAAP)
DD
$132
$122
$152
$146
$140
$552
$525
Total revenue, excluding restructuring charges and special items
(non-GAAP)
D
$1,179
$1,161
$1,185
$1,166
$1,158
$4,691
$4,690
Less: Noninterest expense, excluding restructuring charges
and special items (non-GAAP)
F
791
789
833
810
792
3,223
3,218
Pre-provision profit, excluding restructuring charges and special
items (non-GAAP)
EE
$388
$372
$352
$356
$366
$1,468
$1,472
Income before income tax expense (benefit), excluding
restructuring charges and special items:
Income
before
income
tax
expense
(benefit)
(GAAP)
FF
$283
$274
$476
$235
$208
$1,268
($3,468)
Less: Income before income tax expense (benefit) related to
restructuring charges and special items (GAAP)
(33)
(21)
173
—
(26)
119
(4,461)
Income
before
income
tax
expense
(benefit),
excluding
restructuring charges and special items (non-GAAP)
GG
$316
$295
$303
$235
$234
$1,149
$993
Income tax expense (benefit), excluding restructuring
charges
and special items:
Income tax expense (benefit) (GAAP)
HH
$86
$85
$163
$69
$56
$403
($42)
Less: Income tax (benefit) related to restructuring charges and
special items (GAAP)
(13)
(8)
65
—
(9)
44
(364)
Income
tax
expense
(benefit),
excluding
restructuring
charges
and special items (non-GAAP)
II
$99
$93
$98
$69
$65
$359
$322
Restructuring
charges
and
special
expense
items
include:
Goodwill impairment
-
-
-
-
-
-
$4,435
Restructuring charges
10
1
103
—
26
114
26
Special items
23
20
12
—
—
55
—
Restructuring charges and special expense items
JJ
$33
$21
$115
$0
$26
$169
$4,461
Tangible Common Equity (period-end):
Stockholders' equity
$19,268
$19,383
$19,597
$19,442
$19,196
$19,268
$19,196
Less: Goodwill
(6,876)
(6,876)
(6,876)
(6,876)
(6,876)
(6,876)
(6,876)
Less: Other intangible assets
(6)
(6)
(7)
(7)
(8)
(6)
(8)
Add: Deferred tax liabilities
420
399
384
366
350
420
350
Total tangible common equity
KK
$12,806
$12,900
$13,098
$12,925
$12,662
$12,806
$12,662
QUARTERLY TRENDS
FULL YEAR
Other operating expense, excluding restructuring charges and
Pre-provision profit, excluding restructuring charges and
Other operating expense, excluding restructuring charges and
Special items |
 Non-GAAP
Reconciliation Table 34
Non-GAAP
Reconciliation
-
Segments
$s in millions
Consumer
Banking
Commercial
Banking
Other
Consolidated
Consumer
Banking
Commercial
Banking
Other
Consolidated
Consumer
Banking
Commercial
Banking
Other
Consolidated
Net income (loss) (GAAP)
A
$52
$140
$5
$197
$54
$139
($4)
$189
$44
$141
$128
$313
Return on average tangible common equity
Average common equity (GAAP)
B
$4,756
$4,334
$10,119
$19,209
$4,685
$4,205
$10,521
$19,411
$4,640
$4,129
$10,838
$19,607
Less: Average goodwill (GAAP)
—
—
6,876
6,876
—
—
6,876
6,876
—
—
6,876
6,876
Average other intangibles (GAAP)
—
—
6
6
—
—
6
6
—
—
7
7
Add: Average deferred tax liabilities related to goodwill (GAAP)
—
—
403
403
—
—
384
384
—
—
369
369
Average tangible common equity (non-GAAP)
C
$4,756
$4,334
$3,640
$12,730
$4,685
$4,205
$4,023
$12,913
$4,640
$4,129
$4,324
$13,093
Return on average tangible common equity (non-GAAP)
A/C
4.30%
12.76%
NM
6.12%
4.57%
13.10%
NM
5.81%
3.87%
13.78%
NM
9.59%
Return on average total tangible assets
Average total assets (GAAP)
D
$50,546
$40,061
$40,064
$130,671
$49,012
$38,854
$40,825
$128,691
$48,556
$38,022
$40,570
$127,148
Less: Average goodwill (GAAP)
—
—
6,876
6,876
—
—
6,876
6,876
—
—
6,876
6,876
Average other intangibles (GAAP)
—
—
6
6
—
—
6
6
—
—
7
7
Add: Average deferred tax liabilities related to goodwill (GAAP)
—
—
403
403
—
—
384
384
—
—
369
369
Average tangible assets (non-GAAP)
E
$50,546
$40,061
$33,585
$124,192
$49,012
$38,854
$34,327
$122,193
$48,556
$38,022
$34,056
$120,634
Return on average total tangible assets (non-GAAP)
A/E
0.40%
1.38%
NM
0.63%
0.44%
1.42%
NM
0.61%
0.37%
1.50%
NM
1.04%
Efficiency ratio
Noninterest expense (GAAP)
F
$611
$180
$33
$824
$609
$162
$39
$810
$655
$157
$136
$948
Net interest income (GAAP)
536
283
21
840
532
270
18
820
546
264
23
833
Noninterest income (GAAP)
218
111
10
339
226
104
11
341
236
107
297
640
Total revenue
G
$754
$394
$31
$1,179
$758
$374
$29
$1,161
$782
$371
$320
$1,473
Efficiency ratio (non-GAAP)
F/G
81.09%
45.48%
NM
69.88%
80.42%
43.35%
NM
69.84%
83.61%
42.36%
NM
64.33%
Consumer
Banking
Commercial
Banking
Other
Consolidated
Consumer
Banking
Commercial
Banking
Other
Consolidated
Net income (loss) (GAAP)
A
$32
$141
($7)
$166
$50
$123
($21)
$152
Return on average tangible common equity
Average common equity (GAAP)
B
$4,568
$4,023
$10,779
$19,370
$4,448
$3,978
$10,938
$19,364
Less: Average goodwill (GAAP)
—
—
6,876
6,876
—
—
6,876
6,876
Average other intangibles (GAAP)
—
—
7
7
—
—
8
8
Add: Average deferred tax liabilities related to goodwill (GAAP)
—
—
351
351
—
—
342
342
Average tangible common equity (non-GAAP)
C
$4,568
$4,023
$4,247
$12,838
$4,448
$3,978
$4,396
$12,822
Return on average tangible common equity (non-GAAP)
A/C
2.81%
14.17%
NM
5.24%
4.40%
12.10%
NM
4.71%
Return on average total tangible assets
Average total assets (GAAP)
D
$47,610
$36,955
$39,339
$123,904
$46,225
$36,094
$38,074
$120,393
Less: Average goodwill (GAAP)
—
—
6,876
6,876
—
—
6,876
6,876
Average other intangibles (GAAP)
—
—
7
7
—
—
8
8
Add: Average deferred tax liabilities related to goodwill (GAAP)
—
—
351
351
—
—
342
342
Average tangible assets (non-GAAP)
E
$47,610
$36,955
$32,807
$117,372
$46,225
$36,094
$31,532
$113,851
Return on average total tangible assets (non-GAAP)
A/E
0.27%
1.54%
NM
0.57%
0.42%
1.33%
NM
0.53%
Efficiency ratio
Noninterest expense (GAAP)
F
$638
$153
$19
$810
$638
$164
$16
$818
Net interest income (GAAP)
537
256
15
808
543
260
(24)
779
Noninterest income (GAAP)
219
107
32
358
235
105
39
379
Total revenue
G
$756
$363
$47
$1,166
$778
$365
$15
$1,158
Efficiency ratio (non-GAAP)
F/G
84.39%
42.13%
NM
69.43%
81.84%
44.73%
NM
70.62%
Three Months Ended March 31, 2014
Three Months Ended December 31, 2013
Three Months Ended December 31, 2014
Three Months Ended September 30, 2014
Three Months Ended June 30, 2014 |
 35 |