Attached files
| file | filename |
|---|---|
| 8-K - FORM 8-K - GAIN Capital Holdings, Inc. | dp50675_8k.htm |
| EX-99.1 - EXHIBIT 99.1 - GAIN Capital Holdings, Inc. | dp50675_ex9901.htm |
Exhibit 99.2
GAIN Capital to Acquire City Index

Creating a Global Leader in Online Trading

October 31, 2014

                                                                               1
|
 |
Safe Harbor Statement

Forward Looking Statements
The forward -looking statements contained herein include, without limitation,
statements relating to GAIN Capital's and/or City Index (Holdings) Limited
("City Index") expectations regarding the opportunities and strengths of the
combined company created by the proposed business combination, anticipated cost
and revenue synergies, the strategic rationale for the proposed business
combination, including expectations regarding product offerings, growth
opportunities, value creation, and financial strength, and the timing of the
closing. All forward looking statements are based upon current expectations and
beliefs and various assumptions. There can be no assurance that GAIN Capital or
City Index will realize these expectations or that these beliefs will prove
correct. In addition, a variety of important factors could cause results to
differ materially from such statements. These factors are noted throughout GAIN
Capital's annual report on Form 10-K, as filed with the Securities and Exchange
Commission on March 17, 2014, and include, but are not limited to, the actions
of both current and potential new competitors, fluctuations in market trading
volumes, financial market volatility, evolving industry regulations, including
changes in regulation of the futures companies, errors or malfunctions in GAIN
Capital's systems or technology, rapid changes in technology, effects of
inflation, customer trading patterns, the success of our products and service
offerings, our ability to continue to innovate and meet the demands of our
customers for new or enhanced products, our ability to successfully integrate
assets and companies we have acquired, our ability to effectively compete in
the futures industry, changes in tax policy or accounting rules, fluctuations
in foreign exchange rates and commodity prices, adverse changes or volatility
in interest rates, as well as general economic, business, credit and financial
market conditions, internationally or nationally, and our ability to continue
paying a quarterly dividend in light of future financial performance and
financing needs. The forward -looking statements included herein represent GAIN
Capital's views as of the date of this release. GAIN Capital undertakes no
obligation to revise or update publicly any forward -looking statement for any
reason unless required by law.

Non-GAAP Financial Measures
This presentation contains various non-GAAP financial measures, including
Adjusted EBITDA and Cash EPS. These non-GAAP financial measures have certain
limitations, including that they do not have a standardized meaning and,
therefore, our definitions may be different from similar non-GAAP financial
measures used by other companies and/or analysts. Thus, it may be more
difficult to compare our financial performance to that of other companies. We
believe our reporting of these non-GAAP financial measures assist investors in
evaluating our historical and expected operating performance. However, because
these are not measures of financial performance calculated in accordance with
GAAP, such measures should be considered in addition to, but not as a
substitute for, other measures of our financial performance reported in
accordance with GAAP, such as net income.

                                                                               2
|
 |
and

Glenn Stevens

CEO, GAIN Capital

                                                                               3
|
 |
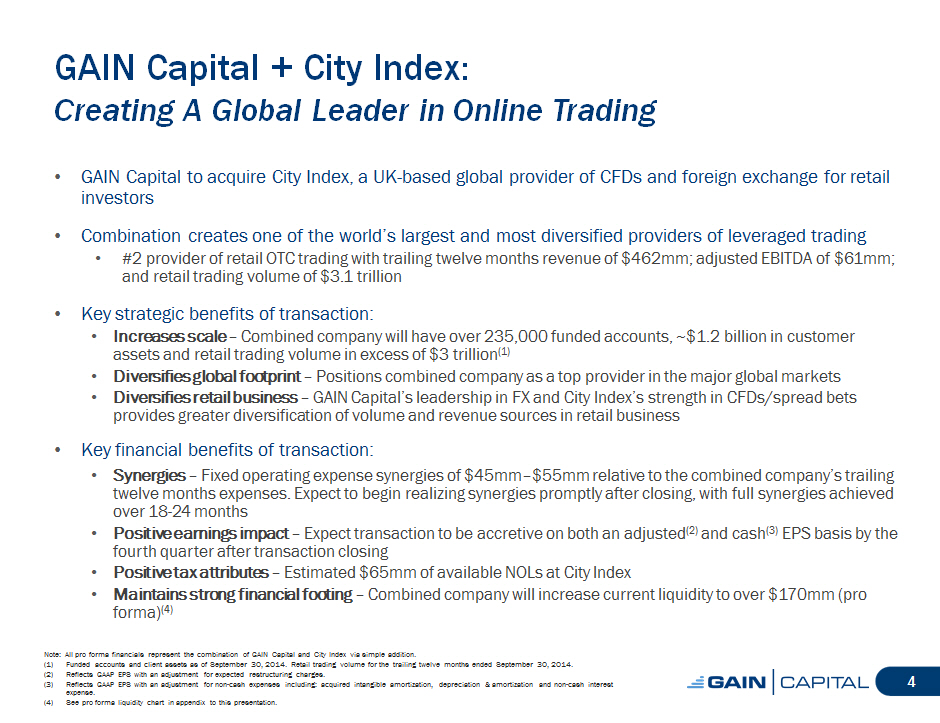
GAIN Capital + City Index:

Creating A Global Leader in Online Trading

[] GAIN Capital to acquire City Index, a UK-based   global provider of CFDs and
foreign exchange for retail investors

[] Combination creates one of the world's largest and most diversified
providers of leveraged trading
[] #2 provider of retail OTC trading with trailing twelve months revenue of
$462mm;  adjusted EBITDA of $61mm;  and retail trading volume of $3.1
trillion

[] Key strategic benefits of transaction:
[] Increases scale -- Combined company will have over 235,000 funded accounts,
~$1.2    billion in customer assets and retail trading volume in excess of $3
trillion(1)
[] Diversifies global footprint -- Positions combined company as a top provider
in the major global markets
[] Diversifies retail business -- GAIN Capital's leadership in FX and City
Index's strength in CFDs/spread bets provides greater diversification of volume
and revenue sources in retail business

[] Key financial benefits of transaction:

[] Synergies -- Fixed operating expense synergies of $45mm--$55mm     relative
to the combined company's trailing twelve months expenses. Expect to begin
realizing synergies promptly after closing, with full synergies achieved over
18-24   months
[] Positive earnings impact -- Expect transaction to be accretive on both an
adjusted (2) and cash(3) EPS basis by the fourth quarter after transaction
closing
[] Positive tax attributes -- Estimated $65mm of available NOLs at City Index
[] Maintains strong financial footing -- Combined company will increase current
liquidity to over $170mm (pro forma)(4)

Note: All pro forma financials represent the combination of GAIN Capital and
City Index via simple addition.
(1) Funded accounts and client assets as of September 30, 2014. Retail trading
volume for the trailing twelve months ended September 30, 2014. (2) Reflects
GAAP EPS with an adjustment for expected restructuring charges.
(3) Reflects GAAP EPS with an adjustment for non-cash   expenses including:
acquired intangible amortization, depreciation and amortization and non-cash
interest expense.
(4) See pro forma liquidity chart in appendix to this presentation.

                                                                               4
|
 |
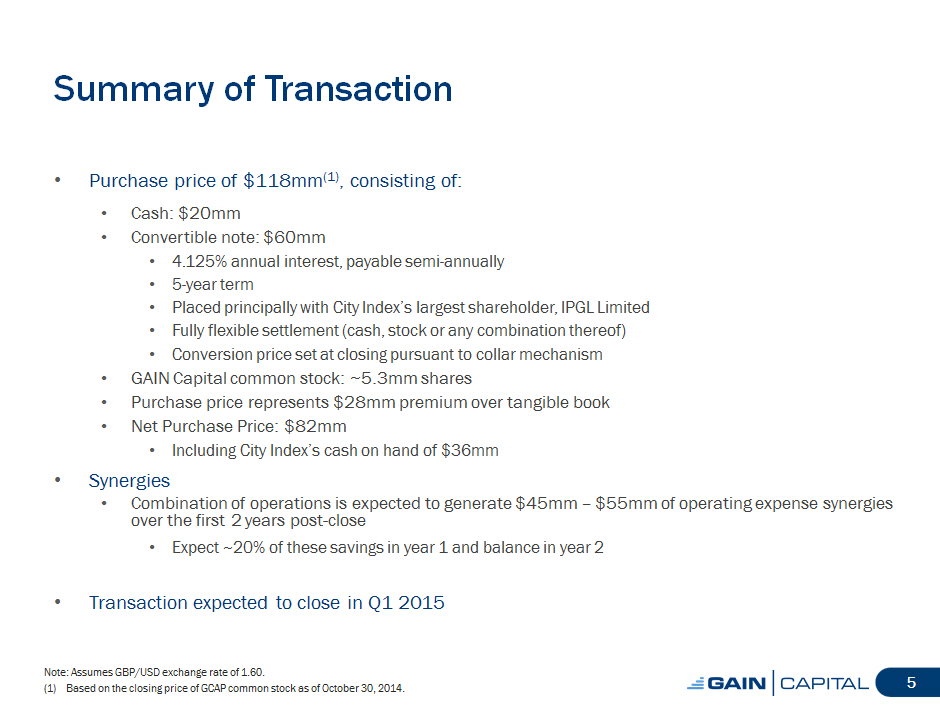
Summary of Transaction

[] Purchase price of $118mm (1)  , consisting of:

[] Cash: $20mm

[] Convertible note: $60mm

[] 4.125%  annual interest, payable semi-annually

[] 5-year  term

[] Placed principally with City Index's largest shareholder, IPGL Limited

[] Fully flexible settlement (cash, stock or any combination thereof)

[] Conversion price set at closing pursuant to collar mechanism

[] GAIN Capital common stock: ~5.3mm  shares

[] Purchase price represents $28mm  premium over tangible book

[] Net Purchase Price: $82mm

[] Including City Index's cash on hand of $36mm

[] Synergies
[] Combination of operations is expected to generate $45mm  -- $55mm of
operating expense synergies over the first 2 years post-close

[] Expect ~20% of these savings in year 1 and balance in year 2

[] Transaction expected to close in Q1 2015

Note: Assumes GBP/USD exchange rate of 1.60.
(1) Based on the closing price of GCAP common stock as of October 30, 2014.

                                                                               5
|
 |
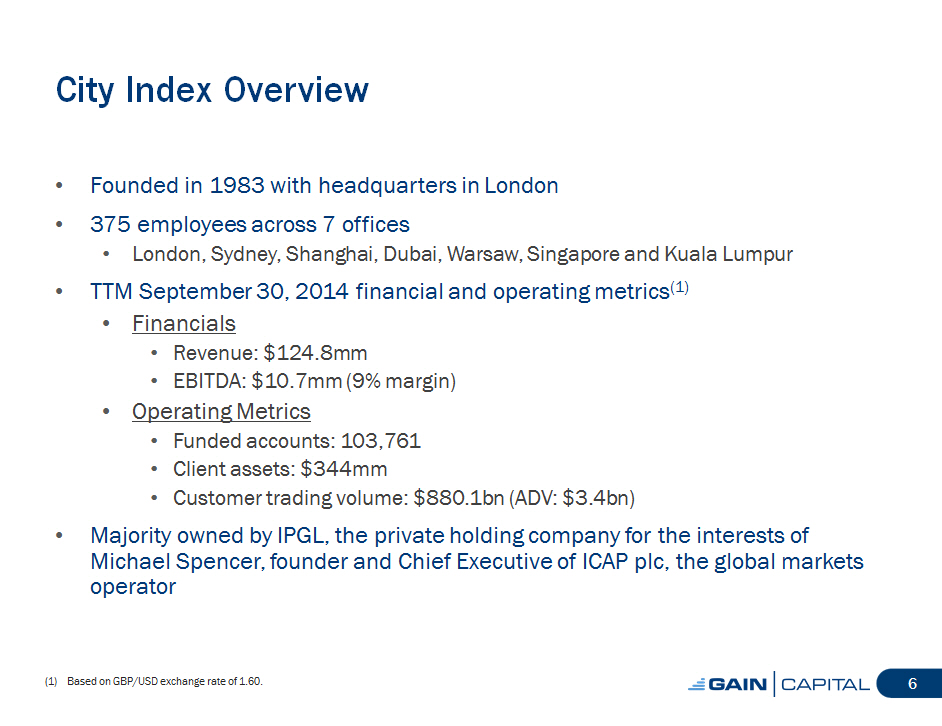
City Index Overview

[] Founded in 1983 with headquarters in London

[] 375 employees across 7 offices

[] London, Sydney, Shanghai, Dubai, Warsaw, Singapore and Kuala Lumpur

[] TTM September 30, 2014 financial and operating metrics (1)

[] Financials

[] Revenue: $124.8mm

[] EBITDA: $10.7mm   (9% margin)

[] Operating Metrics

[] Funded accounts: 103,761

[] Client assets: $344mm

[] Customer trading volume: $880.1bn   (ADV: $3.4bn)

[] Majority owned by IPGL, the private holding company for the interests of
Michael Spencer, founder and Chief Executive of ICAP plc, the global markets
operator

(1) Based on GBP/USD exchange rate of 1.60.

                                                                               6
|
 |
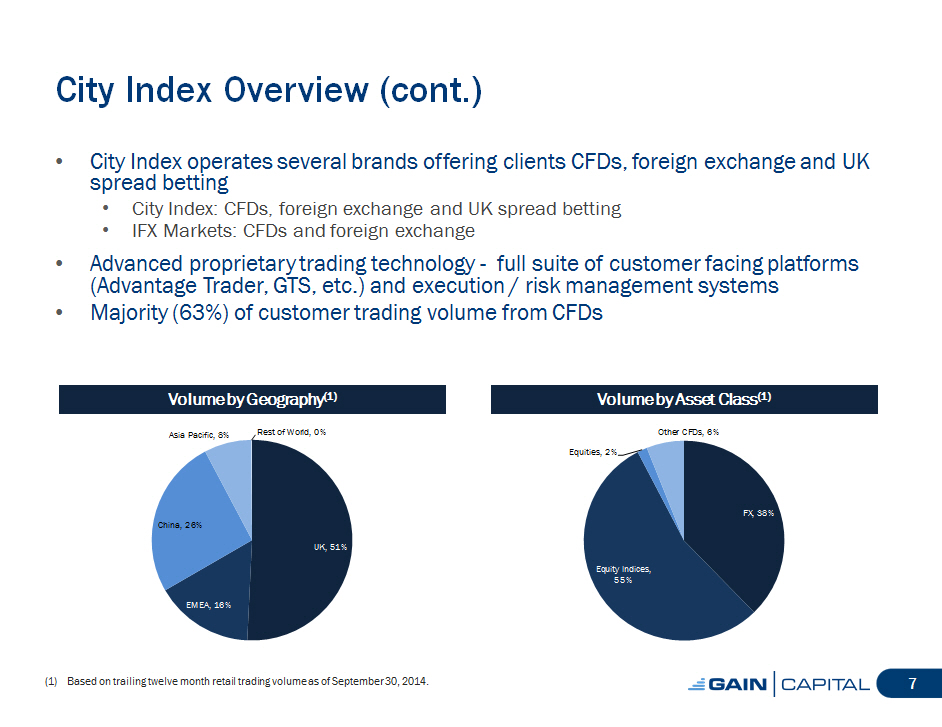
City Index Overview (cont. )

[] City Index operates several brands offering clients CFDs, foreign exchange
and UK spread betting
[] City Index: CFDs, foreign exchange and UK spread betting
[] IFX Markets: CFDs and foreign exchange

[] Advanced proprietary trading technology - full suite of customer facing
platforms (Advantage Trader, GTS, etc. ) and execution / risk management
systems
[] Majority (63%) of customer trading volume from CFDs

Volume by Geography (1)

Asia Pacific, 8% Rest of World, 0%

China, 26%

UK, 51%

EMEA, 16%

Volume by Asset Class (1)

Other CFDs, 6%

Equities, 2%

FX, 38%

Equity Indices, 55%

(1) Based on trailing twelve month retail trading volume as of September 30,
2014.

                                                                               7
|
 |
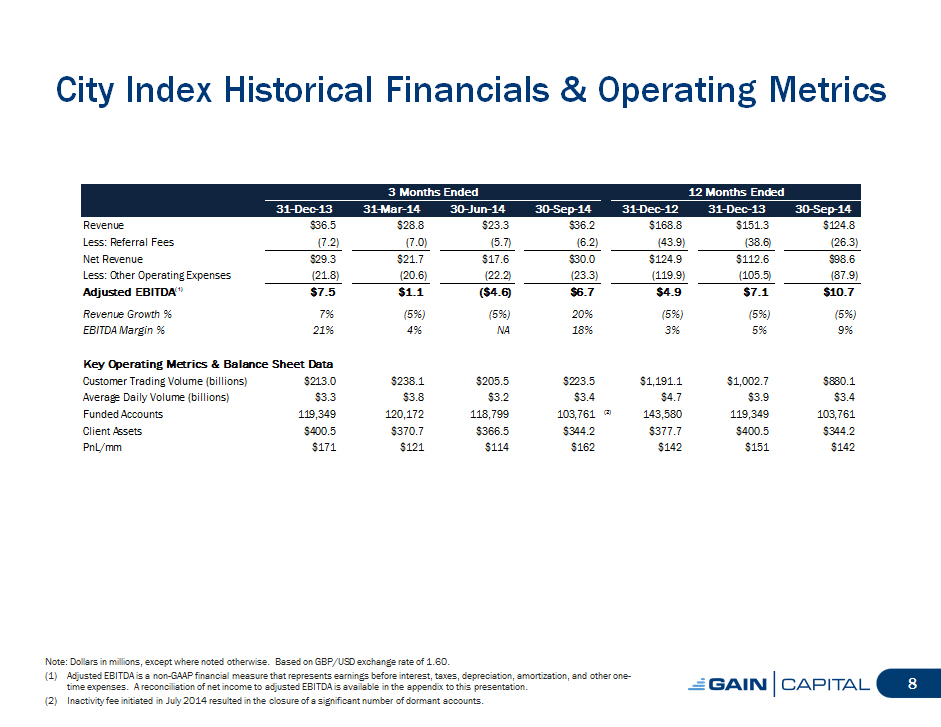
City Index Historical Financials and Operating Metrics


                                                         3 Months Ended
                                     31- Dec - 13    31- Mar - 14  30- Jun - 14
Revenue                                    $36.5         $28.8          $23.3
Less: Referral Fees                         (7.2)         (7.0)          (5.7)
                                   =============== =============== =============
Net Revenue                                $29.3         $21.7          $17.6
Less: Other Operating Expenses             (21.8)        (20.6)         (22.2)
                                   =============== =============== =============
Adj usted EBITDA()1 )                     $7.5           $1. 1         ($4. 6)
Revenue Growth %                             7%             (5%)          (5%)
EBITDA Margin %                             21%              4%             NA
Key Operati ng Metri cs and Bal ance Sheet Data
Customer Trading Volume (billions)      $213.0          $238.1         $205.5
Average Daily Volume (billions)           $3.3            $3.8           $3.2
Funded Accounts                        119,349         120,172        118,799
Client Assets                           $400.5          $370.7         $366.5
PnL/mm                                    $171            $121           $114


                                  12 Months Ended
  30- Sep - 14        31- Dec - 12       31- Dec - 13   30- Sep - 14
        $36.2            $168.8              $151.3         $124.8
         (6.2)            (43.9)              (38.6)         (26.3)
================== ============== =================== ==============
        $30.0            $124.9              $112.6          $98.6
        (23.3)           (119.9)             (105.5)         (87.9)
================== ============== =================== ==============
         $6.7              $4.9                $7.1          $10.7
           20%               (5%)                (5%)           (5%)
           18%                3%                  5%             9%
       $223.5          $1,191.1            $1,002.7         $880.1
         $3.4              $4.7                $3.9           $3.4
      103,761 (2)       143,580             119,349        103,761
       $344.2            $377.7              $400.5         $344.2
         $162              $142                $151           $142


Note: Dollars in millions, except where noted otherwise. Based on GBP/USD
exchange rate of 1.60.
(1) Adjusted EBITDA is a non-GAAP   financial measure that represents earnings
before interest, taxes, depreciation, amortization, and other one- time
expenses. A reconciliation of net income to adjusted EBITDA is available in the
appendix to this presentation.
(2) Inactivity fee initiated in July 2014 resulted in the closure of a
significant number of dormant accounts.

                                                                               8
|
 |
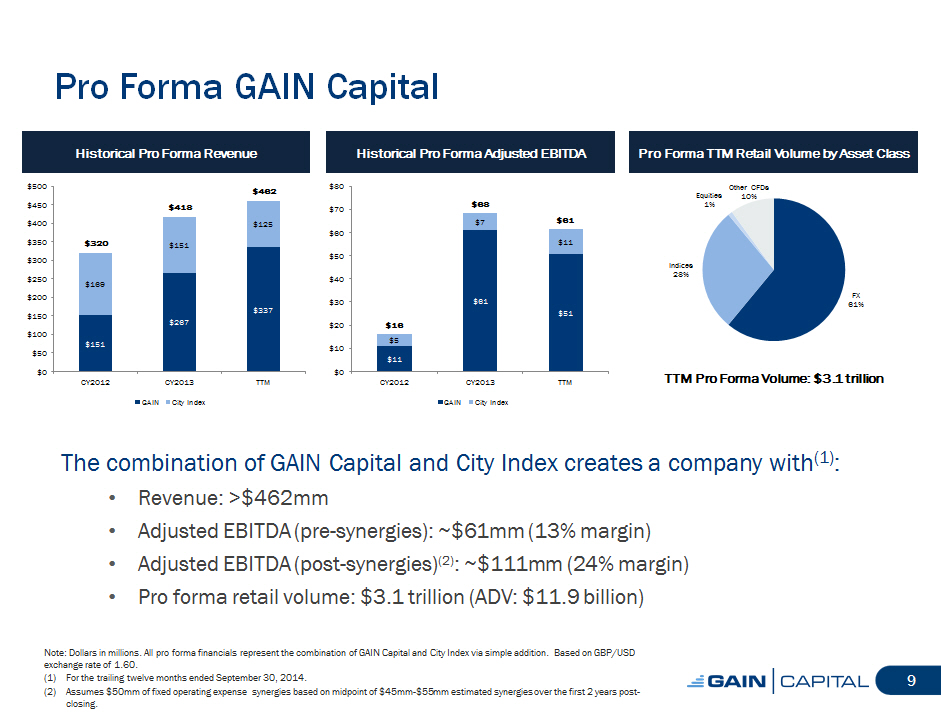
Pro Forma GAIN Capital

Historical Pro Forma Revenue

$500 $462 $450 $418 $400 $125 $350 $320 $151 $300

$250 $169 $200 $337 $150 $267 $100 $151 $50

$0
CY2012 CY2013 TTM

GAIN City Index

Historical Pro Forma Adjusted EBITDA

$80

                                  $68 $70 $7 $61 $60 $11 $50

$40

$30 $61 $51 $20 $16 $5 $10 $11 $0 CY2012 CY2013 TTM

GAIN City Index

Pro Forma TTM Retail Volume by Asset Class

        Other CFDs Equities 10% 1%

Indices 28%

FX 61%

TTM Pro Forma Volume: $3.1 trillion

The combination of GAIN Capital and City Index creates a company with(1):

[] Revenue: >$462mm

[] Adjusted EBITDA (pre-synergies):   ~$61mm  (13% margin)

[] Adjusted EBITDA (post-synergies) (2)  : ~$111mm  (24% margin)

[] Pro forma retail volume: $3.1   trillion (ADV: $11.9   billion)

Note: Dollars in millions. All pro forma financials represent the combination
of GAIN Capital and City Index via simple addition. Based on GBP/USD exchange
rate of 1.60.
(1) For the trailing twelve months ended September 30, 2014.
(2) Assumes $50mm  of fixed operating expense synergies based on midpoint of
$45mm-$55mm     estimated synergies over the first 2 years post- closing.

                                                                               9
|
 |
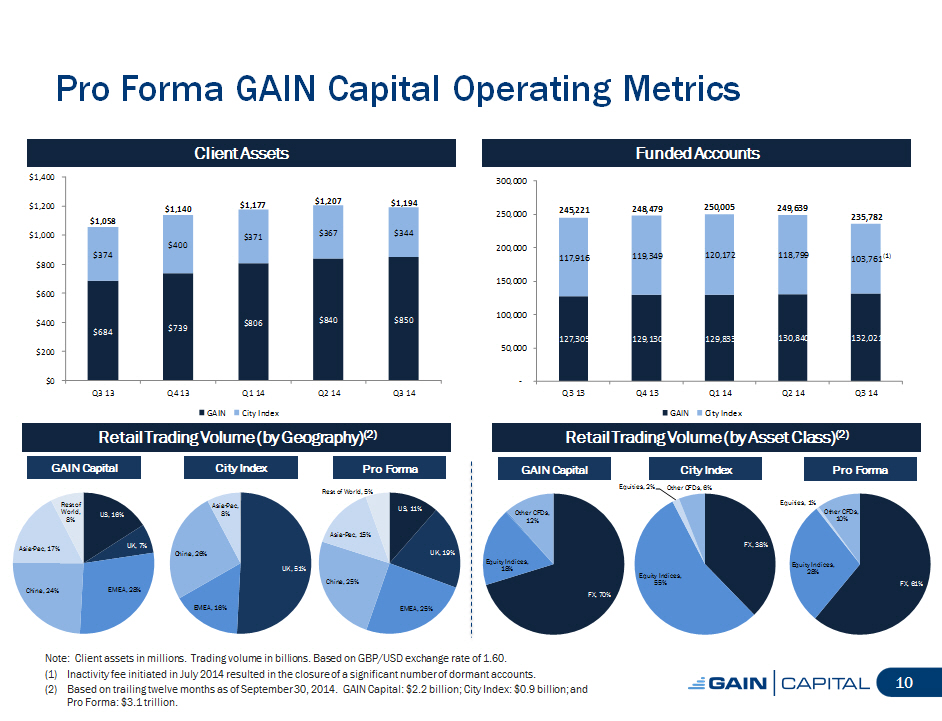
Pro Forma GAIN Capital Operating Metrics

Client Assets

$1,400

$1,177 $1,207 $1,194 $1,200
$1,140 $1,058 $1,000 $367 $344 $371 $400 $374 $800

$600

$400 $806 $840 $850 $739 $684

$200

$0
Q3 13 Q4 13 Q1 14 Q2 14 Q3 14

GAIN City Index

Funded Accounts

 300,000

245,221 248,479 250,005 249,639
 250,000 235,782

 200,000
117,916 119,349 120,172 118,799 (1) 103,761

 150,000

 100,000

127,305 129,130 129,833 130,840 132,021 50,000

 -
Q3 13 Q4 13 Q1 14 Q2 14 Q3 14

GAIN City Index

Retail Trading Volume (by Geography) (2)

GAIN Capital

Rest of
World, US, 16% 8%

Asia-Pac, 17% UK, 7%

China, 24% EMEA, 28%

City Index

Asia-Pac, 8%

China, 26%

UK, 51%

EMEA, 16%

Pro Forma

Rest of World, 5%

US, 11%

Asia-Pac, 15%

UK, 19% China, 25% EMEA, 25%

Retail Trading Volume (by Asset Class)(2)

GAIN Capital

Other CFDs, 12%

Equity Indices, 18%

FX, 70%

City Index

Equities, 2% Other CFDs, 6%

FX, 38%

Equity Indices, 55%

Pro Forma

Equities, 1%
Other CFDs, 10%

Equity Indices, 28%
FX, 61%

Note: Client assets in millions. Trading volume in billions. Based on GBP/USD
exchange rate of 1.60.
(1) Inactivity fee initiated in July 2014 resulted in the closure of a
significant number of dormant accounts.
(2) Based on trailing twelve months as of September 30, 2014. GAIN Capital:
$2.2   billion; City Index: $0.9   billion; and Pro Forma: $3.1   trillion.

                                                                              10
|
 |
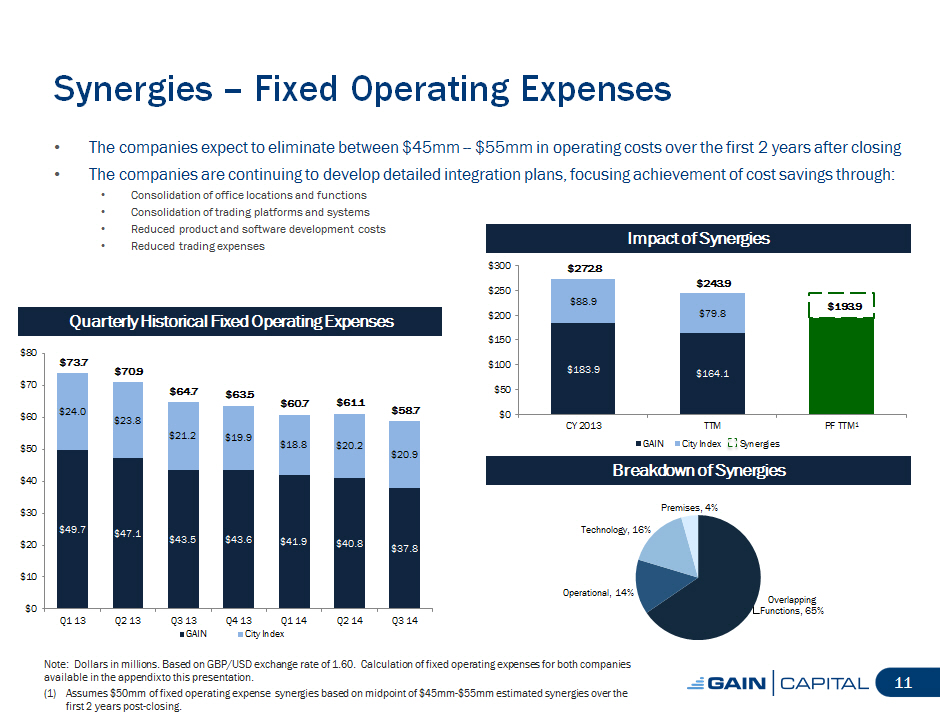
Synergies -- Fixed Operating Expenses

[] The companies expect to eliminate between $45mm --  $55mm in operating costs
over the first 2 years after closing

[] The companies are continuing to develop detailed integration plans, focusing
achievement of cost savings through:

[] Consolidation of office locations and functions
[] Consolidation of trading platforms and systems
[] Reduced product and software development costs
[] Reduced trading expenses

Quarterly Historical Fixed Operating Expenses

$80 $73.7 $70.9 $70 $64.7 $63.5 $60.7 $61.1 $24.0 $58.7 $60 $23.8 $21.2 $19.9
$50 $18.8 $20.2 $20.9

$40

$30 $49.7 $47.1 $43.5 $43.6 $41.9 $20 $40.8 $37.8

$10

$0
Q1 13 Q2 13 Q3 13 Q4 13 Q1 14 Q2 14 Q3 14 GAIN City Index

Impact of Synergies

$300 $272.8 $243.9 $250 $88.9 $193.9 $200 $79.8

$150

$100 $183.9 $164.1 $50

$0
CY 2013 TTM PF TTM[] GAIN City Index Synergies

Breakdown of Synergies

Premises, 4%

Technology, 16%

Operational, 14%
 Overlapping Functions, 65%

Note: Dollars in millions. Based on GBP/USD exchange rate of 1.60.  Calculation
of fixed operating expenses for both companies available in the appendix to
this presentation.
(1) Assumes $50mm  of fixed operating expense synergies based on midpoint of
$45mm-$55mm     estimated synergies over the first 2 years post-closing.

                                                                              11
|
 |
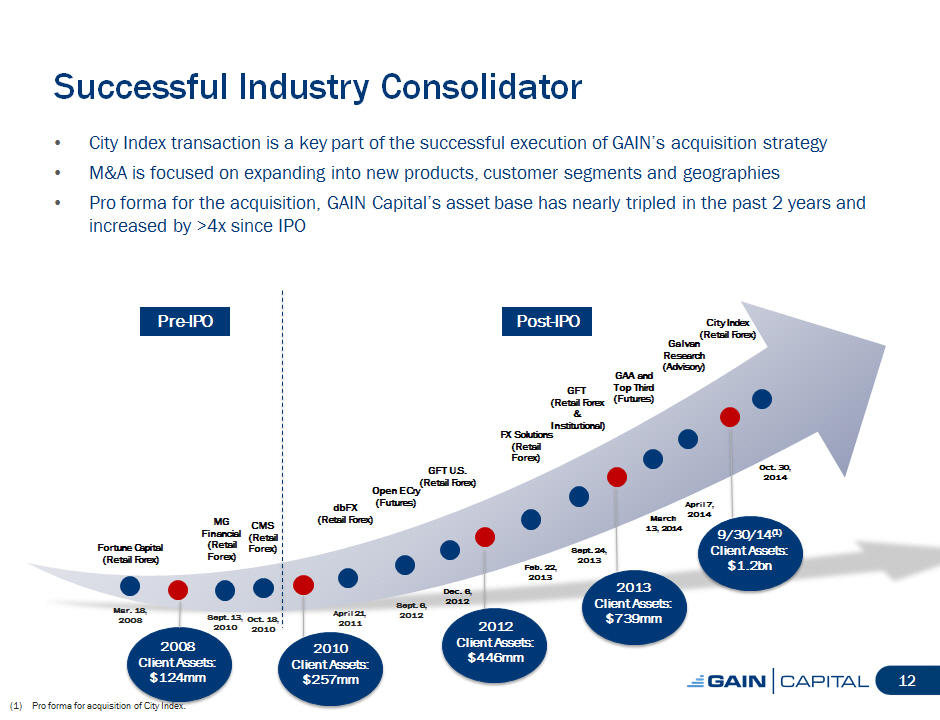
Successful Industry Consolidator

[] City Index transaction is a key part of the successful execution of GAIN's
acquisition strategy

[] MandA is focused on expanding into new products, customer segments and
geographies

[] Pro forma for the acquisition, GAIN Capital's asset base has nearly tripled
in the past 2 years and increased by >4x since IPO

Pre-IPO

dbFX
MG (Retail Forex) CMS
Financial
(Retail Fortune Capital (Retail Forex)
(Retail Forex) Forex)

Mar. 18, April 21, 2008 Sept. 13, Oct. 18, 2011 2010 2010
2008 2010
Client Assets: Client Assets: $124mm $257mm

    Post -IPO City Index (Retail Forex) Galvan Research (Advisory) GAA and GFT
Top Third (Retail Forex (Futures) and Institutional) FX Solutions (Retail Forex)
             GFT U.S. Oct. 30, 2014 (Retail Forex) Open E Cry (Futures) April
7, March 2014 13, 2014 9/30/14 (1)
Sept. 24, Client Assets: 2013 $1.2bn
Feb. 22, 2013
Dec. 6, 2013
Sept. 6, 2012 Client Assets: 2012 $739mm 2012 Client Assets: $446mm

(1) Pro forma for acquisition of City Index.

                                                                              12
|
 |
Pro Forma Industry Landscape

As a result of the transaction, GAIN Capital becomes the second largest
provider of leveraged OTC retail trading[]

$14 Average Daily Volume (1)
$ 12.6

$12 $11.3

$10.1
$10

$8 .2
$8 $7.6

$6
$5.1
$4 .6
$4 $3.7
$3 .3

$2

$0
FXCM PF GAIN Saxo Alpari IG Markets Oanda LMAX FXOpen Interactive
Brokers

[]while continuing to develop its commission -based businesses (institutional,
futures and advisory)

Note: Dollars in billions. Dotted line represents impact of City Index trading
volume.
(1) Based on Forex Magnates 3Q 2014 Quarterly Industry Report for the 3 months
ended August 31, 2014. GAIN and City Index volume based on actual data per GAIN
and City Index management. Excludes Japanese brokers.

                                                                              13
|
 |
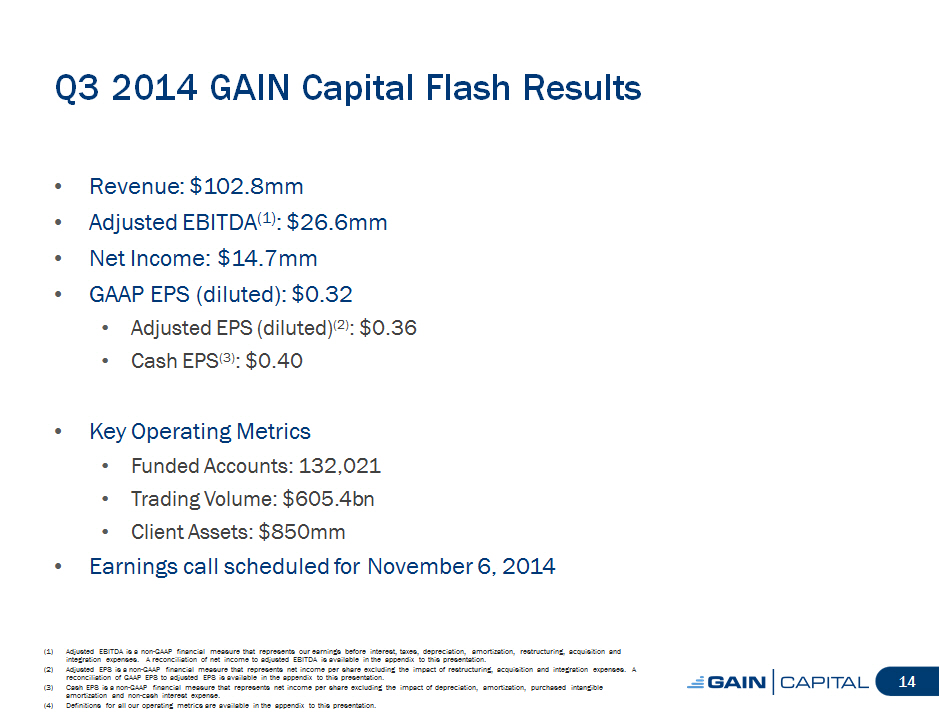
Q3 2014 GAIN Capital Flash Results

[] Revenue: $102.8mm

[] Adjusted EBITDA (1): $26.6mm

[] Net Income: $14.7mm

[] GAAP EPS (diluted): $0.32

[] Adjusted EPS (diluted) (2): $0.36

[] Cash EPS(3): $0.40

[] Key Operating Metrics

[] Funded Accounts: 132,021

[] Trading Volume: $605.4bn

[] Client Assets: $850mm

[] Earnings call scheduled for November 6, 2014

(1) Adjusted EBITDA is a non-GAAP financial measure that represents our
earnings before interest, taxes, depreciation, amortization, restructuring,
acquisition and integration expenses. A reconciliation of net income to
adjusted EBITDA is available in the appendix to this presentation.

(2) Adjusted EPS is a non-GAAP financial measure that represents net income per
share excluding the impact of restructuring, acquisition and integration
expenses. A reconciliation of GAAP EPS to adjusted EPS is available in the
appendix to this presentation.

(3) Cash EPS is a non-GAAP financial measure that represents net income per
share excluding the impact of depreciation, amortization, purchased intangible
amortization and non-cash interest expense.

(4) Definitions for all our operating metrics are available in the appendix to
this presentation.


                                                                              14
|
 |
Closing Remarks

[] Combination of GAIN Capital and City Index to create a global leader in
online trading

[] Transaction boosts CFD revenue and provides more balanced mix of retail
revenue sources

[] GAIN will leverage established integration experience to achieve an
estimated $45mm --  $55mm  of fixed operating expense synergies

[] City Index brands and technology provide platform for further growth in
global markets

[] Transaction to be accretive to adjusted earnings within four quarters of
closing

                                                                              15
|
 |
Appendix

                                                                              16
|
 |
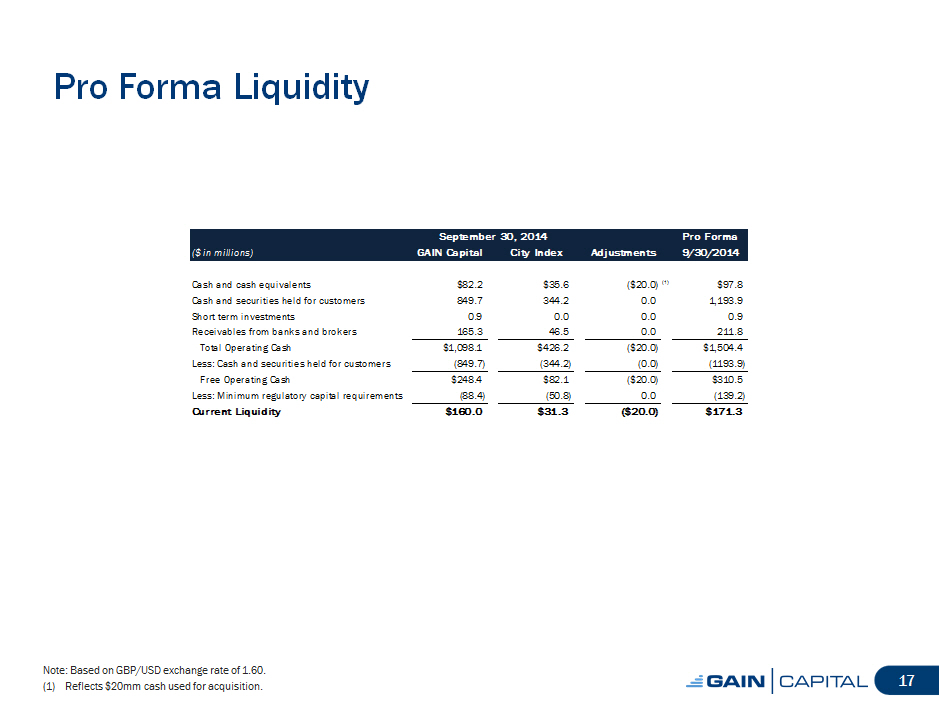
Pro Forma Liquidity


                                                   September 30, 2014
($ in millions)                                 GAIN Capital    City Index
Cash and cash equivalents                              $82.2          $35.6
Cash and securities held for customers                 849.7          344.2
Short term investments                                   0.9            0.0
Receivables from banks and brokers                     165.3           46.5
                                              ================ ==============
  Total Operating Cash                              $1,098.1         $426.2
Less: Cash and securities held for customers          (849.7)        (344.2)
                                              ================ ==============
  Free Operating Cash                                 $248.4          $82.1
Less: Minimum regulatory capital requirements          (88.4)         (50.8)
                                              ================ ==============
Cur rent Liquidity                                   $160. 0          $31.3


                      Pro F or ma
Adj ustments          9/30/2014
         ($20.0) (1)         $97.8
            0.0            1,193.9
            0.0                0.9
            0.0              211.8
===================== ==============
        ($20.0)           $1,504.4
           (0.0)           (1193.9)
===================== ==============
        ($20.0)             $310.5
           0.0              (139.2)
===================== ==============
       ( $20.0)           $171. 3


Note: Based on GBP/USD exchange rate of 1.60.
(1) Reflects $20mm cash used for acquisition.

                                                                              17
|
 |
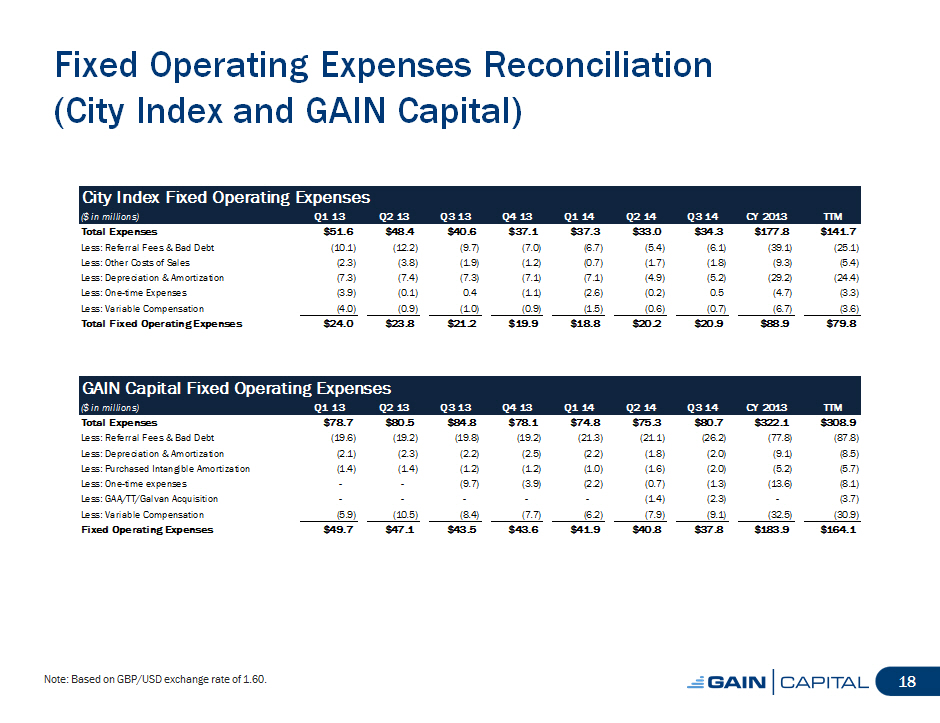
Fixed Operating Expenses Reconciliation (City Index and GAIN Capital)


City Index Fixed Operating Expenses
($ in millions)                        Q1 13      Q2 13
Total Expenses                         $51. 6     $48.4
Less: Referral Fees and Bad Debt        (10.1)    (12.2)
Less: Other Costs of Sales               (2.3)     (3.8)
Less: Depreciation and Amortization      (7.3)     (7.4)
Less: One-time Expenses                  (3.9)     (0.1)
Less: Variable Compensation              (4.0)     (0.9)
                                    ========== =========
Total Fixed Operating Expenses          $24.0     $23.8


   Q3 13     Q4 13     Q1 14     Q2 14
   $40.6     $37.1     $37.3     $33.0
    (9.7)     (7.0)     (6.7)     (5.4)
    (1.9)     (1.2)     (0.7)     (1.7)
    (7.3)     (7.1)     (7.1)     (4.9)
     0.4      (1.1)     (2.6)     (0.2)
    (1.0)     (0.9)     (1.5)     (0.6)
========= ========= ========= =========
   $21.2     $19.9     $18.8     $20.2


   Q3 14     CY 2013     TTM
   $34.3      $177.8    $141.7
    (6.1)      (39.1)    (25.1)
    (1.8)       (9.3)     (5.4)
    (5.2)      (29.2)    (24.4)
     0.5        (4.7)     (3.3)
    (0.7)       (6.7)     (3.6)
========= =========== =========
   $20.9       $88.9     $79.8


GAIN Capital Fixed Operating Expenses
($ in millions)                              Q1 13      Q2 13
Total Expenses                                $78.7     $80.5
Less: Referral Fees and Bad Debt              (19.6)    (19.2)
Less: Depreciation and Amortization            (2.1)     (2.3)
Less: Purchased Intangible Amortization        (1.4)     (1.4)
Less: One-time expenses                         -         -
Less: GAA/TT/Galvan Acquisition                 -         -
Less: Variable Compensation                    (5.9)    (10.5)
                                          ========== =========
Fixed Operating Expenses                      $49.7     $47.1


   Q3 13     Q4 13     Q1 14     Q2 14
   $84.8     $78.1     $74.8     $75.3
   (19.8)    (19.2)    (21.3)    (21.1)
    (2.2)     (2.5)     (2.2)     (1.8)
    (1.2)     (1.2)     (1.0)     (1.6)
    (9.7)     (3.9)     (2.2)     (0.7)
     -         -         -        (1.4)
    (8.4)     (7.7)     (6.2)     (7.9)
========= ========= ========= =========
   $43.5     $43.6     $41.9     $40.8


   Q3 14     CY 2013     TTM
   $80.7      $322.1    $308.9
   (26.2)      (77.8)    (87.8)
    (2.0)       (9.1)     (8.5)
    (2.0)       (5.2)     (5.7)
    (1.3)      (13.6)     (8.1)
    (2.3)        -        (3.7)
    (9.1)      (32.5)    (30.9)
========= =========== =========
   $37.8      $183.9    $164.1


Note: Based on GBP/USD exchange rate of 1.60.

                                                                              18
|
 |
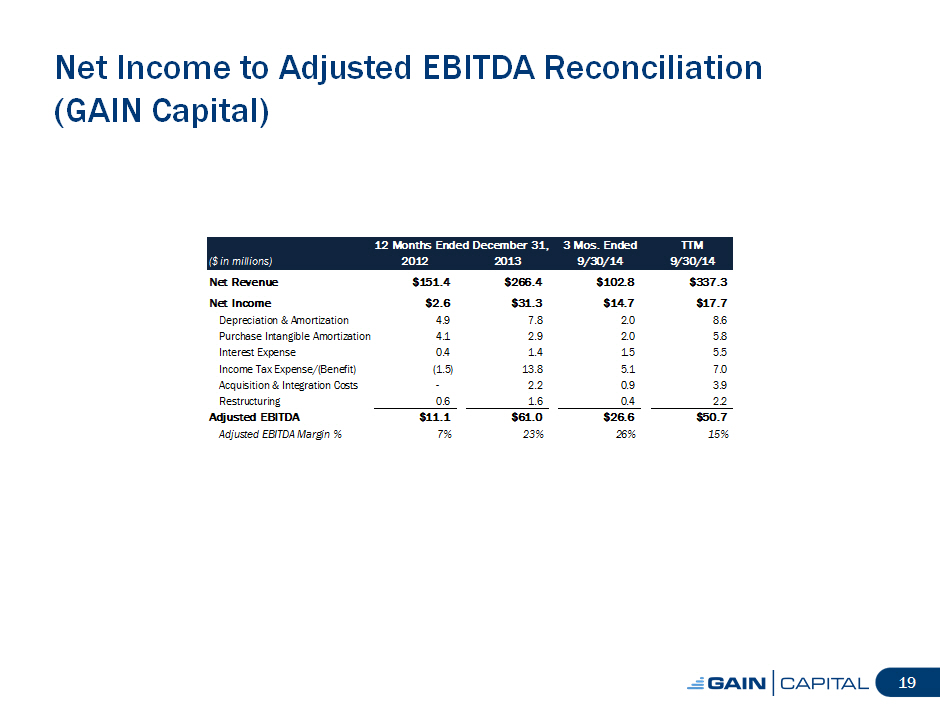
Net Income to Adjusted EBITDA Reconciliation

(GAIN Capital)


                                    12 Months Ended December 31,
($ in millions)                               2012         2013
Net Revenue                                 $151.4       $266.4
Net Income                                    $2.6        $31.3
  Depreciation and Amortization                4.9          7.8
  Purchase Intangible Amortization             4.1          2.9
  Interest Expense                             0.4          1.4
  Income Tax Expense/(Benefit)                (1.5)        13.8
  Acquisition and Integration Costs              -          2.2
  Restructuring                                0.6          1.6
                                   =================== ===========
Adjusted EBITDA                             $11.1         $61.0
  Adjusted EBITDA Margin %                      7%           23%


     3 Mos . Ended       TTM
         9/30/14       9/30/14
          $102.8        $337.3
           $14.7         $17.7
             2.0           8.6
             2.0           5.8
             1.5           5.5
             5.1           7.0
             0.9           3.9
             0.4           2.2
  ================ =============
           $26.6         $50.7
              26%           15%


                                                                              19
|
 |
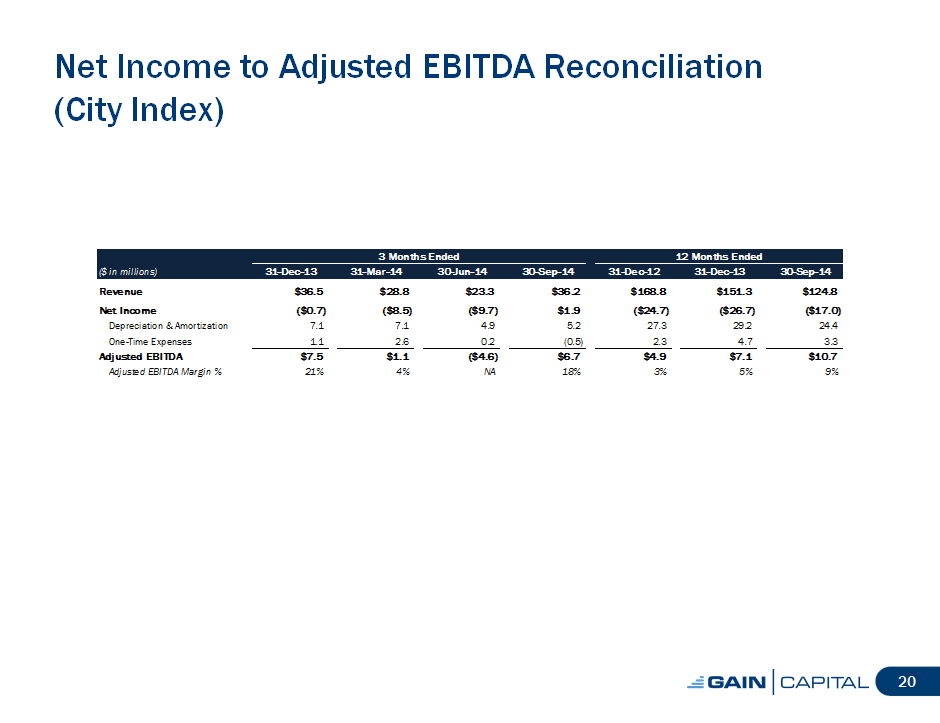
Net Income to Adjusted EBITDA Reconciliation

(City Index)


                                                  3 Months Ended
($ in millions)                   31-Dec-13     31-Mar -14    30-Jun-14
Revenue                              $36.5         $28.8         $23.3
Net Income                           ($0.7)        ($8.5)        ($9.7)
  Depreciation and Amortization        7.1           7.1           4.9
  One-Time Expenses                    1.1           2.6           0.2
                              ============= ============= =============
Adjusted EBITDA                      $7.5          $1.1         ($4.6)
  Adjusted EBITDA Margin %             21%            4%           NA


                              12 Months Ended
                ------------- ------------------ -------------
30-Sep-14       31-Dec-12         31-Dec-13      30-Sep-14
   $36.2          $168.8            $151.3         $124.8
    $1.9          ($24.7)           ($26.7)        ($17.0)
     5.2            27.3              29.2           24.4
    (0.5)            2.3               4.7            3.3
=============== ------------- ================== =============
    $6.7            $4.9              $7.1          $10.7
      18%              3%                5%             9%


                                                                              20
|
 |
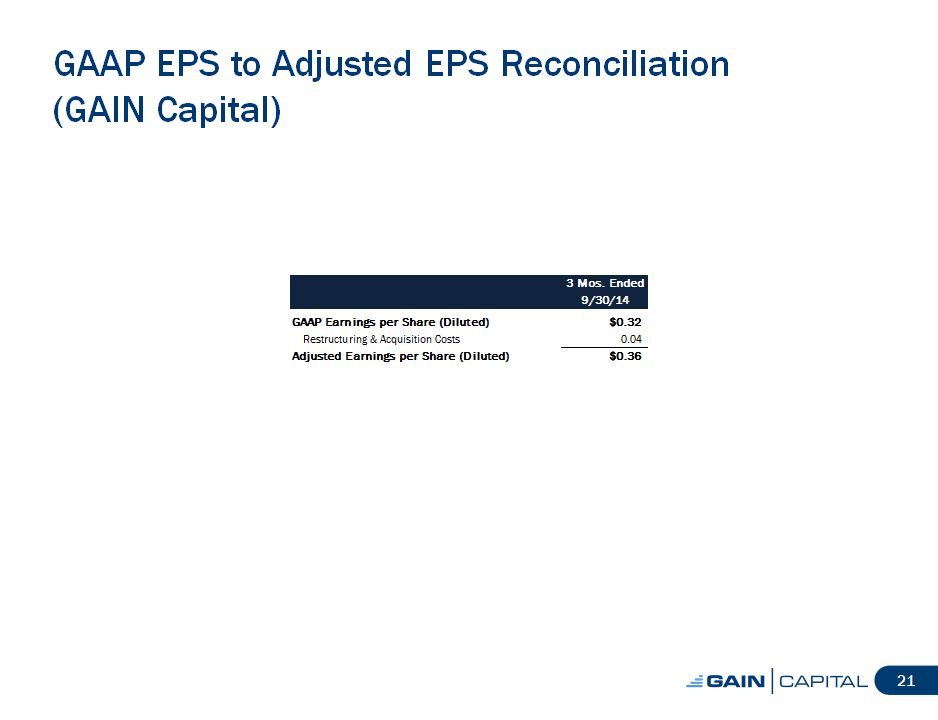
GAAP EPS to Adjusted EPS Reconciliation

(GAIN Capital)


                                          3 Mos . Ended
                                               9/30/14
GAAP Earnings per Share (Diluted)               $0.32
  Restructuring and Acquisition Costs            0.04
                                          =================
Adjusted Earnings per Share (Diluted)           $0.36


                                                                              21
|
 |
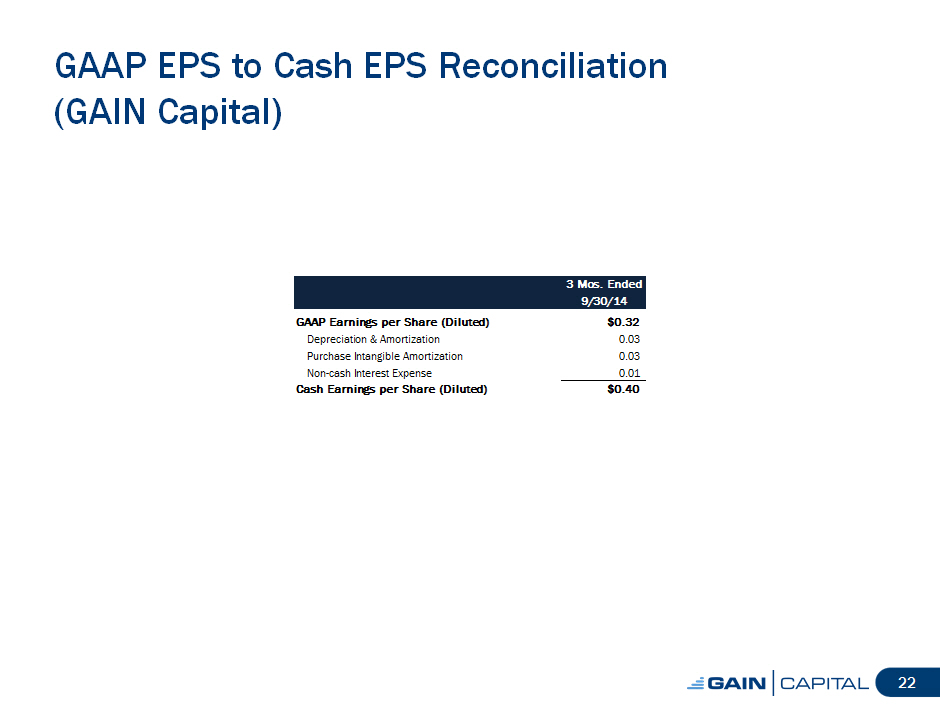
GAAP EPS to Cash EPS Reconciliation

(GAIN Capital)


                                         3 Mos. Ended
                                            9/30/14
GAAP Ear ni ngs per Share (Diluted)       $0. 32
  Depreciation and Amortization               0.03
  Purchase Intangible Amortization            0.03
  Non-cash Interest Expense                   0.01
                                      ================
Cash Earnings per Share (Diluted)            $0.40


                                                                              22
|
 |
Definition of Metrics

[] Funded Accounts

[] Retail accounts who maintain a cash balance

[] Trading Volume

[] Represents the U. S.  dollar equivalent of notional amounts traded

[] Customer Assets

[] Represents amounts due to clients, including customer deposits and
unrealized gains or losses arising from open positions

                                                                              23
|
 |
GAIN Capital to Acquire City Index

Creating a Global Leader in Online Trading

October 31, 2014

                                                                              24
|
 |
|
|