Attached files
| file | filename |
|---|---|
| 8-K - FORM 8-K - WESBANCO INC | d811498d8k.htm |
| EX-2.1 - EX-2.1 - WESBANCO INC | d811498dex21.htm |
| EX-99.2 - EX-99.2 - WESBANCO INC | d811498dex992.htm |
| EX-2.2 - EX-2.2 - WESBANCO INC | d811498dex22.htm |
 Exhibit 99.1 |
 Forward-Looking Statements
2
Matters set forth in this filing contain certain forward-looking statements, including certain
plans, expectations, goals, and projections, and including statements about the benefits of the
proposed Merger between WesBanco and ESB, which are subject to numerous assumptions, risks, and
uncertainties. Actual results could differ materially from those contained or implied by such
statements for a variety of factors including: the businesses of WesBanco and ESB may not be
integrated successfully or such integration may take longer to accomplish than expected; the
expected cost savings and any revenue synergies from the proposed Merger may not be fully
realized within the expected timeframes; disruption from the proposed Merger may make it more
difficult to maintain relationships with clients, associates, or suppliers; the required
governmental approvals of the proposed Merger may not be obtained on the expected terms and
schedule; WesBanco’s shareholders may not approve the issuance of shares of WesBanco
common stock in connection with the Merger; ESB’s shareholders may not approve the
proposed Merger; changes in economic conditions; movements in interest rates; competitive
pressures on product pricing and services; success and timing of other business strategies; the
nature, extent, and timing of governmental actions and reforms; and extended disruption of vital
infrastructure; and other factors described in WesBanco’s 2013 Annual Report on Form
10-K, ESB’s 2013 Annual Report on Form 10-K, and documents subsequently filed by
WesBanco and ESB with the Securities and Exchange Commission, including both companies’
Form 10-Qs as of March 31 and June 30, 2014 and both companies’ Form 8-K regarding
its net income for the quarter ended September 30, 2014. All forward-looking statements
included in this filing are based on information available at the time of the release. Neither
WesBanco nor ESB assumes any obligation to update any forward-looking statement.
|
 Transaction
Highlights
3
Compelling
Strategic
Rationale
Strong
Financial
Results
(1)
Significantly
expands
presence
in
large
attractive
Pittsburgh
market
-
top
10
player
in
Pittsburgh
MSA
(1)
Roughly 30% of pro forma WesBanco franchise in Pittsburgh/Western PA
Builds on prior acquisition of Fidelity in Pittsburgh through greater penetration
in market Highly experienced Pittsburgh market management team
Leverages WesBanco platform product suite through ESB’s distribution
Last standing sizable franchise left in market with desirable branch
locations Voted again as top 10 performing thrift for 2013 by SNL
Similar disciplined risk cultures and customer focus
Proven track record of acquisitions
Expected
to
be
3%
accretive
to
2015
EPS
excluding
one-time
charges
Run
rate
EPS
accretion
of
9-10%
in
2016
and
beyond
Internal rate of return in the high teens
Tangible book value dilution of 7.4% with restructuring charges
Remain
well
in
excess
of
“Well
Capitalized”
guidelines
on
pro
forma
basis
Earn-back of dilution of 2.4 years using incremental retained earnings method
and 5.4 years using crossover method reflecting all merger-related
expenses, purchase accounting adjustments and cost savings
Pittsburgh MSA deposit market share rankings exclude
Bank of New York Mellon.
Incremental retained earnings method defined as the number of years required to earn back the tangible
book value per share dilution at close using estimated incremental retained earnings (defined as
ESB earnings, synergies, and purchase accounting adjustments minus dividends paid on new shares
issued). Crossover method defined as the number of years for projected pro forma tangible book
value per share to exceed projected stand-alone tangible book value per share.
|
 Summary
of Key Terms (1)
Based on 18,378,111 of ESBF shares outstanding on a fully diluted basis and fifteen
day average closing price of WSBC common stock of $31.66 as of 10/27/2014.
Transaction Value:
Implied
consideration of $17.65 per ESBF common share or $324.4 million in aggregate
(1)
Form of Consideration:
90% stock / 10% cash, or 0.502 WSBC shares using a fixed exchange ratio plus
$1.76 in cash for each share of ESBF common stock
(1)
Walkaway
Provision:
“Double-trigger”
provision:
15% or greater decline in WSBC stock and
15% or greater decline in WSBC’s stock price relative to the NASDAQ Bank
Stock Index Expected Closing:
First or second quarter 2015
Required Approvals:
Customary regulatory
and shareholder approval of both companies
Due Diligence:
Completed
Financing:
Existing cash on hand
Board of Directors:
2 ESBF Board Seats granted to Charlotte Zuschlag and another director of ESB or
ESB Bank to be mutually agreed upon prior to the effective merger
date Pro Forma Ownership:
77% WSBC / 23% ESBF
4 |
 Franchise Comparison
(1) Reflects new branch opening in Southpointe, Washington County on
11/3/2014. Financial data as of 9/30/2014 or for the nine months ended
9/30/2014. Source: SNL Financial.
($ in Millions)
WesBanco, Inc.
ESB Financial Corporation
Assets
$6,278
$1,945
Deposits
$5,102
$1,337
Loans / Deposits
79.1%
53.4%
Tangible Common Equity
$472
$165
Net Income
$53.5
$13.6
Net Interest Margin
3.62%
2.80%
Efficiency Ratio
59.3%
56.7%
Cost of Total Deposits
0.34%
0.53%
ROAA
1.15%
0.93%
ROAE
9.2%
9.1%
Headquarters
Wheeling, WV
Ellwood City, PA
Branches
120
(1)
23
Top 5 Counties
Ohio & Wood (WV),
Franklin & Belmont (OH),
Allegheny (PA)
Beaver, Allegheny,
Lawrence, Butler
(All in PA)
Balance Sheet
Operational
Franchise
5
ROATCE
16.0%
11.8% |
 Acquisition
of
ESB
Would
Make
WSBC
Top 10 Player in Pittsburgh MSA
6
WesBanco Deposit Market Share Over Time
in the Pittsburgh MSA
2012
PF 2012
PF 2014
Pittsburgh expansion key to WesBanco continued
transformation
Pittsburgh is the 2
nd
largest MSA in Pennsylvania and
serves as an engine of loan growth for WesBanco
Current loans to deposits in Pittsburgh / Western
PA of 103%
(2)
With ESB, WesBanco can leverage greater footprint
to substantially grow franchise in Pittsburgh
Revenue opportunity from fee income businesses
including trust and wealth management overlay not
factored in current analysis
Deposit market share excludes Bank of New York Mellon.
Rank
Institution
Branches
Deposits
($MM)
Market
Share
1
PNC Financial Services Group
152
49,740
50.6%
2
Royal Bank of Scotland Group
129
7,505
7.6%
3
F.N.B. Corp.
86
4,030
4.1%
4
Dollar Bank FSB
37
3,656
3.7%
5
First Niagara Financial Group
59
2,752
2.8%
6
Huntington Bancshares Inc.
38
2,487
2.5%
7
First Commonwealth Financial
61
2,400
2.4%
8
TriState Capital Holdings Inc.
2
2,274
2.3%
9
S&T Bancorp Inc.
26
1,735
1.8%
10
WesBanco (post acquisition of Fidelity and ESB)
35
(1)
1,478
1.5%
…
13
WesBanco (post acquisition of Fidelity)
15
556
0.6%
…
39
WesBanco (without Fidelity or ESB)
2
81
0.1%
Source: SNL Financial.
(2)
Financial data as of 6/30/2014.
(1)
Does not include the anticipated closing of two branches.
|
 Complementary Pro Forma Branch Map in
Pittsburgh MSA / Western Pennsylvania
7
ESBF
Loans / Deposits
53%
WSBC Western PA
Loans / Deposits
(1)
103%
ESBF
financial
data
as
of
9/30/2014.
Includes
new
branch
opening
in
Southpointe.
(1)
WSBC deposit and loan total of $509MM and $526MM, respectively, as of 6/30/14.
Source: SNL Financial, company financials.
ESBF
WSBC |
 In
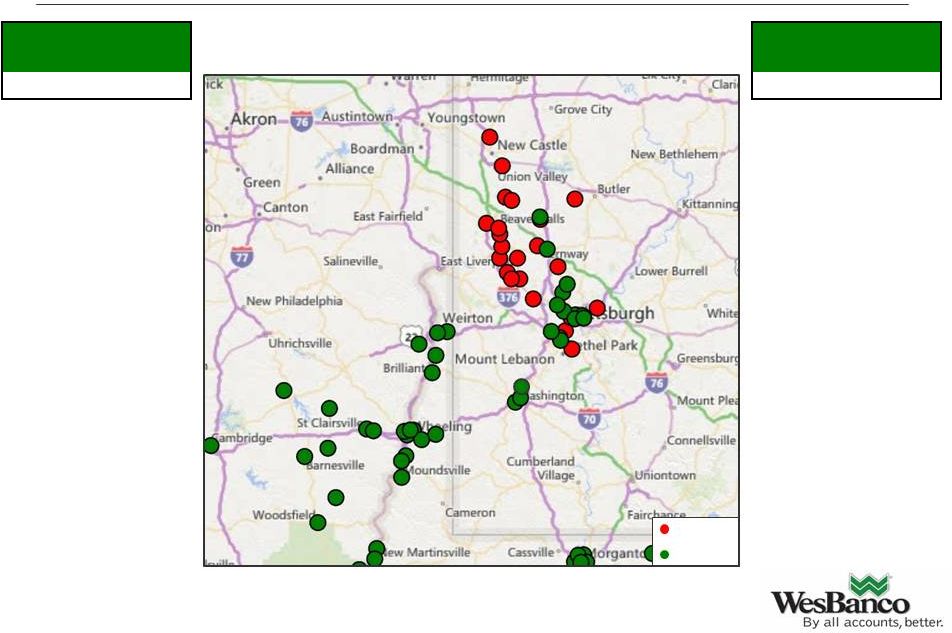
Addition, ESB Further Reinforces WesBanco Footprint in Marcellus/Utica Shale
Play 8
Marcellus/Utica Shale Regional Coverage
WSBC (120)
ESBF (23)
94% of pro forma bank franchise is located within the Marcellus/Utica Shale
region |
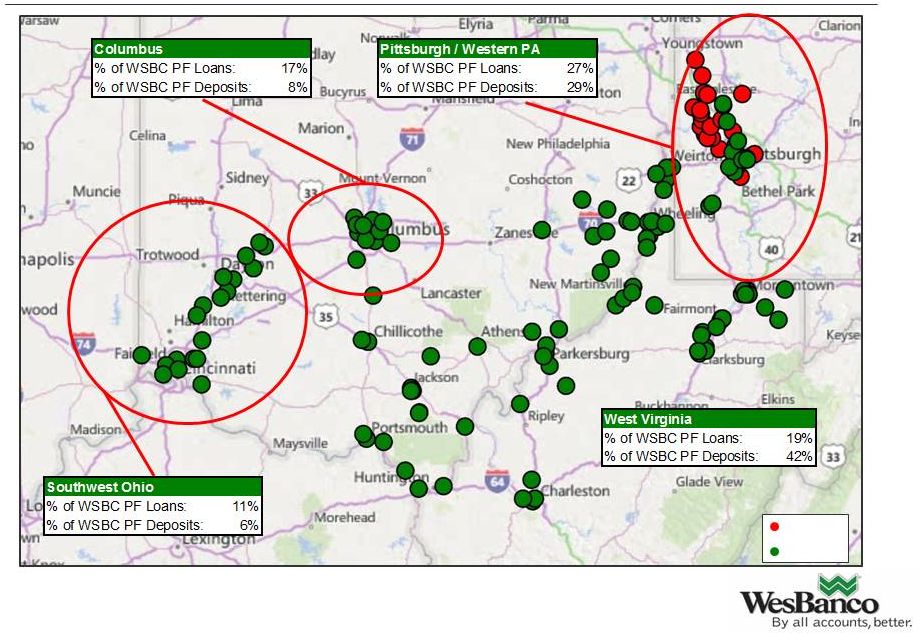 Post
Acquisition, Pittsburgh / Western PA Would Comprise Almost 30% of WesBanco’s
Franchise Note: Loan and deposit data as of 6/30/14. Pro forma does not
include purchase accounting adjustments. Source: SNL Financial, company
financials. ESBF (23)
WSBC (120)
9 |
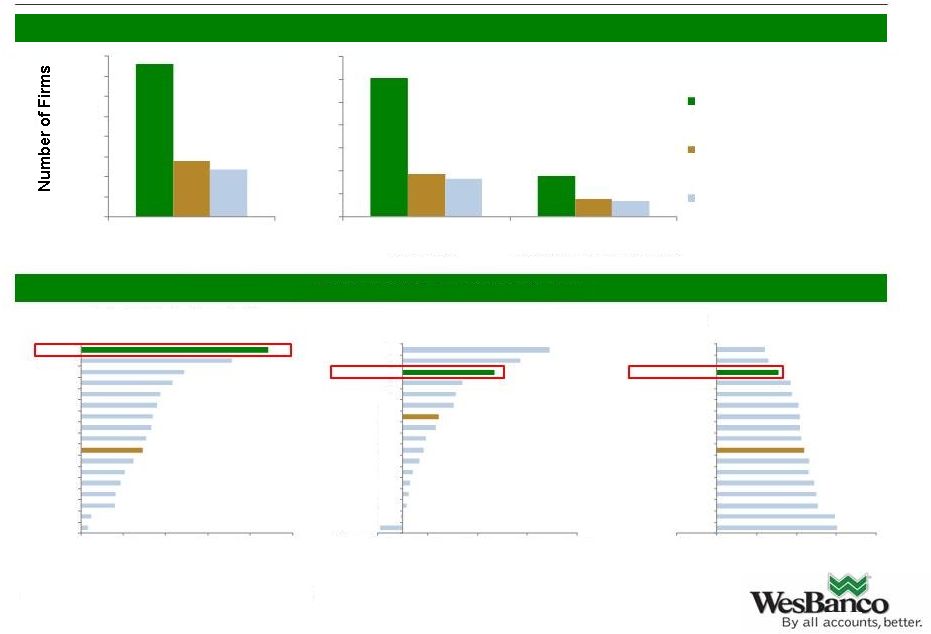 Pittsburgh Continues to be a Vibrant Market
10
Source: SNL, ESRI, Bureau of Labor Statistics, RealtyTrac and FHFA.
Pittsburgh
Commercial
Market
–
Continued
Opportunity
Pittsburgh MSA Economic Indicators
Projected Median Household
Income 5-Year CAGR (2014-2019)
Home Price Index Change
Since First Quarter 2009
Retail CRE Vacancy Rate
Second Quarter 2014
0
1,000
2,000
3,000
4,000
5,000
6,000
7,000
20-500 Employees
Businesses
500+ Employees
Middle Market and Corporate
Pittsburgh MSA
Pennsylvania MSA Average
National MSA Average
0
5,000
10,000
15,000
20,000
25,000
30,000
35,000
40,000
<20 Employees
Small Businesses
0.0%
0.5%
1.0%
1.5%
2.0%
2.5%
Detroit
Indianapolis
Cleveland
Milwaukee
Charlotte
Richmond
Minneapolis
Benchmark Avg
Denver
Cincinnati
St. Louis
US Average
Kansas City
Philadelphia
Boston
Baltimore
Pittsburgh
(5.0%)
0.0%
5.0%
10.0%
15.0%
20.0%
Indianapolis
Cleveland
Milwaukee
Cincinnati
St. Louis
Detroit
Kansas City
Benchmark Avg
Minneapolis
Charlotte
Denver
US Average
Richmond
Philadelphia
Pittsburgh
Boston
Baltimore
(5.0%)
5.0%
15.0%
25.0%
35.0%
Milwaukee
Richmond
Baltimore
Philadelphia
St. Louis
Charlotte
Cincinnati
Kansas City
Cleveland
US Average
Benchmark Avg
Boston
Minneapolis
Indianapolis
Detroit
Denver
Pittsburgh |
 Pro
Forma Financial Impact 11
Attractive financial returns:
2015 EPS accretion of 3% excluding one-time charges and 9-10% accretion in
2016 and beyond 7.4%
dilution
of
tangible
book
value
per
share
(1)
with
earn-back
of
2.4
years
using
incremental
retained
earnings
method and 5.4 years using crossover method
Internal rate of return in the high teens
Price
to
tangible
book
value
per
share
of
191%
and
price
to
last
twelve
months
earnings’
ended
September
30,
2014 of 18.1x
Key Assumptions:
Approximately 50% cost savings (56% phased in during 2015 and 100% thereafter)
inclusive of 2 branch closures Conservative
gross
loan
credit
mark
of
$16.2
million;
validated by
3
party
credit
review by big 4 accounting firm
Interest rate loan mark up of $6.2 million and deposit mark up of $5.6
million Write-down of fixed assets, OREO and other assets of $2.2
million Core
deposit
intangibles
of
1.3%
amortized
over
10
years
using
sum-of-years’
digits
One-time pre-tax restructuring charge of $26 million
Goodwill at closing anticipated to be $160
-
165 million
Assumes 9.0 million shares of WSBC and $40 million of cash (excluding restructuring
charges) issued to ESB shareholders
(1) Includes restructuring charges.
rd |
 Cost
Savings Largely Driven By Elimination of Executive Officers, Back-Office
Synergies and Branch Closures 12
Approximately $16 million in expected pre-tax cost savings
Approximately 50% cost savings (56% phased in during 2015 and 100%
thereafter) All twelve executive officers eliminated from combination
Assumes consolidation of 2 branches with nearby WesBanco offices
Cost Savings Detail
Estimated Cost Savings
Approximate Amount (MM)
Executive Officer Compensation & Benefits
$7.0
Employee Compensation & Benefits
4.7
Data Processing
1.7
Other
2.6
Total Estimated Cost Savings
$16.0 |
 Pro
Forma Capital Ratios Remain Strong 13
(1)
Assumes transaction closed 9/30/2014 for illustrative purposes. Also assumes the
redemption of $36 million of ESB trust preferred securities. (2)
Assumes WSBC actual ratios at 9/30/2014 plus FactSet Street Estimates, ESB
transaction closing, and continuation of current quarterly cash dividend through 3/31/2015.
Also assumes the redemption of $36 million of ESB trust preferred securities.
WSBC
9/30/2014
Pro Forma
9/30/2014
(1)
Projected at
Closing
(2)
Tangible Common Equity/Tangible Assets
7.9%
7.3%
7.6%
Tier 1 Common Ratio
11.0%
10.8%
11.2%
Tier 1 Risk-Based Capital
13.6%
12.8%
13.1%
Tier 1 Leverage Ratio
9.7%
8.6%
9.1%
Total 1 Risk-Based Capital
14.6%
13.7%
14.0% |
 Pricing
In Line With Relevant Deals 14
(1) ESB’s ROAA and ROAE were 0.94% and 9.0% for the three months ended
9/30/2014. (2) Parkvale Financial Corporation‘s LTM core earnings of $8.3
million used for LTM EPS, LTM ROAA and Deal Metrics
Announcement Date
10/29/2014
9/8/2014
6/15/2011
Deal Value
$324.4
$367.4
$163.0
Price/ Book
1.52x
1.90x
1.38x
Price/ Tangible Book
1.91x
2.16x
1.98x
Price/ LTM EPS
18.1x
17.4x
18.6x
(2)
Target Financials (MM)
Total Assets
$1,945
$1,858
$1,801
Total Deposits
$1,337
$1,573
$1,481
Branches
23
32
47
Deposits per Branch
$58
$49
$32
ROAA (LTM)
0.91%
1.14%
0.46%
(2)
ROAE (LTM)
9.0%
11.5%
6.7%
(2)
LTM ROAE vs. actual net income of $(15.2 million).
Source: SNL Financial, MRQ available.
(1)
(1) |
 Summary
15
Strategic
continued
expansion
into
Pittsburgh
-
Top
10
player in Pittsburgh MSA
(1)
ESB is a sizable franchise with desirable branch locations
with similar disciplined risk culture and customer focus –
Top 10 performing thrift
WesBanco is focused on targeted M&A opportunities
within its existing franchise and also upon opportunities in
urban markets contingent to its existing franchise
History of successful consolidations with a seasoned
management team, technology/back office support and
capital/liquidity strength
Compelling financial results
(1) Pittsburgh
MSA
deposit
market
share
rankings
exclude
Bank
of
New
York
Mellon. |
 Appendix |
 Pro
Forma Deposit Composition 17
WesBanco, Inc.
ESB Financial Corporation
Combined
Cost of Deposits: 0.34%
Cost of Deposits: 0.52%
Cost of Deposits: 0.38%
Source: SNL Financial. Represents regulatory deposit composition as of
6/30/2014. Jumbo deposits represent time deposits greater than $100,000.
Does not include any purchase accounting adjustments. 1. Core deposits equal
total deposits minus jumbo deposits and brokered deposits. Noninterest
-bearing
20%
NOW &
Other
17%
Savings &
MMDAs
35%
Retail
13%
Jumbo
15%
Noninterest
-bearing
2%
NOW &
Other
3%
Savings &
MMDAs
45%
Retail
28%
Jumbo
22%
Noninterest
-bearing
16%
NOW &
Other
14%
Savings &
MMDAs
37%
Retail
16%
Jumbo
17% |
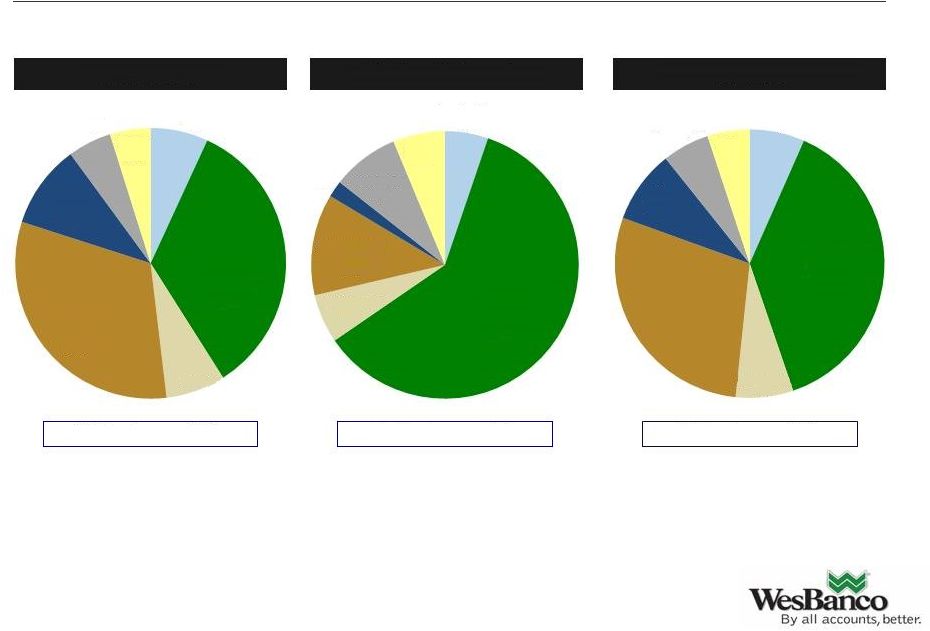 Pro
Forma Loan Composition 18
WesBanco, Inc.
ESB Financial Corporation
Combined
Yield on Loans: 4.38%
Yield on Loans: 4.57%
Yield on Loans: 4.41%
Construction
7%
Single
Family
34%
Multifamily
7%
Commercial
Real Estate
32%
C&I
10%
Consumer
5%
Other
5%
Construction
5%
Single
Family
60%
Multifamily
6%
Commercial
Real Estate
12%
C&I
2%
Consumer
8%
Other
7%
Construction
6%
Single
Family
38%
Multifamily
7%
Commercial
Real Estate
29%
C&I
9%
Consumer
6%
Other
5%
Source: SNL Financial. Represents regulatory loan composition as of 6/30/2014. Does not include any
purchase accounting adjustments. |
 WSBC
9/30/14
YTD
ESBF
9/30/14
YTD
Non-interest Expense
$120,810
$22,609
Less: Amortization of Intangibles and Goodwill
1,454
85
Non-interest Expense Excluding Amortization of Intangibles and
Goodwill
$119,356
$22,524
Net interest income (on a fully taxable equivalent basis)
$149,754
$35,197
Non-interest income
51,406
4,562
Total income
$201,160
$39,759
Non-interest expense / total income (efficiency ratio)
59.3%
56.7%
Non-GAAP Financial Measures
Efficiency Ratio
19
Source: SNL Financial.
($ in thousands) |
 WSBC
3Q’14
ESBF
3Q’14
Total common shareholder’s equity
$788,784
$206,400
Less: goodwill & other intangible assets, net of def. tax liabilities
(317,217)
(41,632)
Tangible common equity
$471,567
$164,678
Total assets
$6,278,494
$1,945,398
Less: goodwill & other intangible assets, net of def. tax liabilities
(317,217)
(41,632)
Tangible assets
$5,961,277
$1,903,766
Tangible common equity to tangible assets
7.9%
8.7%
Non-GAAP Financial Measures
Tangible Common Equity to Tangible Assets
20
Source: SNL Financial.
($ in thousands) |
 WSBC
9/30/14
YTD
ESBF
9/30/14
YTD
Net income*
$71,478
$18,167
Plus: amortization of intangibles* (tax effected at 35%)
1,264
74
Net income before amortization of intangibles*
$72,742
$18,240
Average
total
common
shareholders’
equity
$773,294
$196,701
Less: average goodwill & other intangibles, net of def. tax
liabilities
(317,217)
(41,671)
Average tangible common equity
$455,616
$155,030
Return on average tangible common equity
16.0%
11.8%
Non-GAAP Financial Measures
Return on Average Tangible Common Equity
21
Source: SNL Financial.
* Annualized
($ in thousands) |
 |