Attached files
| file | filename |
|---|---|
| 8-K - FORM 8-K - PUBLIC SERVICE ENTERPRISE GROUP INC | d701835d8k.htm |
 Forward-Looking Statement
2
Certain of the matters discussed in this communication about our and our
subsidiaries’ future performance, including, without limitation,
future revenues, earnings, strategies, prospects, consequences and all
other statements that are not purely historical constitute
“forward-looking statements” within the meaning of the Private Securities
Litigation Reform Act of 1995. Such forward-looking statements are subject
to risks and uncertainties, which could cause actual results to differ
materially from those anticipated. Such statements are based on
management's beliefs as well as assumptions made by and information
currently available to management. When used herein, the words
“anticipate,” “intend,” “estimate,” “believe,” “expect,” “plan,”
“should,” “hypothetical,” “potential,”
“forecast,” “project,” variations of such words and
similar expressions are intended to identify forward-looking statements.
Factors that may cause actual results to differ are often presented with
the forward-looking statements themselves. Other factors that could
cause actual results to differ materially from those contemplated in any
forward looking statements made by us herein are discussed in filings we
make with the United States Securities and Exchange Commission (SEC),
including our Annual Report on Form 10-K and subsequent reports
on Form 10-Q and Form 8-K and available on our website: http://www.pseg.com. These factors include,
but are not limited to: •
any deterioration in our credit quality or the credit quality of our
counterparties, including in our leveraged leases,
•
availability of capital and credit at commercially reasonable terms and
conditions and our ability to meet cash needs,
•
changes in the cost of, or interruption in the supply of, fuel and other
commodities necessary to the operation of our generating units,
•
delays in receipt of necessary permits and approvals for our construction and
development activities,
•
delays or unforeseen cost escalations in our construction and development
activities,
•
any inability to achieve, or continue to sustain, our expected levels of
operating performance,
•
any equipment failures, accidents, severe weather events or other
incidents that impact our ability to provide safe and reliable
service to our customers, and any inability to obtain sufficient
coverage or recover proceeds of insurance with respect to such events,
•
cybersecurity attacks or intrusions that could adversely impact our
businesses, •
increases in competition in energy supply markets as well as competition from
certain transmission projects,
•
any inability to realize anticipated tax benefits or retain tax credits,
•
challenges associated with recruitment and/or retention of a qualified
workforce, •
adverse performance of our decommissioning and defined benefit plan trust fund
investments and changes in funding requirements, and
•
changes in technology, such as distributed generation and micro grids, and
greater reliance on these technologies and changes in customer
behaviors, including energy efficiency, net metering and demand
response. All of the forward-looking statements made in this report
are qualified by these cautionary statements and we cannot assure you
that the results or developments anticipated by management will be
realized or even if realized, will have the expected consequences to,
or effects on, us or our business prospects, financial condition or
results of operations. Readers are cautioned not to place undue reliance on
these forward-looking statements in making any investment decision.
Forward-looking statements made in this report apply only as of the
date of this report. While we may elect to update forward-looking
statements from time to time, we specifically disclaim any obligation
to do so, even if internal estimates change, unless otherwise required
by applicable securities laws. The forward-looking statements contained in
this report are intended to qualify for the safe harbor provisions of
Section 27A of the Securities Act of 1933, as amended, and Section 21E
of the Securities Exchange Act of 1934, as amended. •
adverse changes in the demand for or the price of the capacity and energy that
we sell into wholesale electricity markets,
•
adverse changes in energy industry law, policies and regulation, including
market structures and a potential shift away from competitive markets
toward subsidized market mechanisms, transmission planning and cost
allocation rules, including rules regarding how transmission is
planned and who is permitted to build transmission in the future, and
reliability standards, •
any inability of our transmission and distribution businesses to obtain
adequate and timely rate relief and regulatory approvals from federal
and state regulators, •
changes in federal and state environmental regulations that could increase our
costs or limit our operations,
•
changes in nuclear regulation and/or general developments in the nuclear power
industry, including various impacts from any accidents or incidents
experienced at our facilities or by others in the industry, that could
limit operations of our nuclear generating units,
•
actions or activities at one of our nuclear units located on a multi-unit
site that might adversely affect our ability to continue to
operate that unit or other units located at the same site,
•
any inability to balance our energy obligations, available supply and risks,
EXHIBIT 99 |
 GAAP Disclaimer
PSEG presents Operating Earnings in addition to its Income from Continuing
Operations/Net Income reported in accordance with accounting principles
generally accepted in the United States (GAAP). Operating Earnings is a
non- GAAP financial measure that differs from Income from Continuing
Operations/Net Income because it excludes gains or losses associated
with Nuclear Decommissioning Trust (NDT), Mark-to-Market (MTM)
accounting, and other material one-time items. PSEG presents
Operating Earnings because management believes that it is appropriate
for investors to consider results excluding these items in addition to
the results reported in accordance with GAAP. PSEG believes that the
non-GAAP financial measure of Operating Earnings provides a
consistent and comparable measure of performance of its businesses to
help shareholders understand performance trends. This information is
not intended to be viewed as an alternative to GAAP information.
Slide
A
at
the
end
of
this
presentation
includes
a
list
of
items
excluded
from
Income from Continuing Operations/Net Income to reconcile to Operating
Earnings, with a reference to that slide included on each of the
slides where the
non-GAAP information appears.
3 |
 PSEG Power has generating assets
in three competitive markets
•
Assets near loads
•
Low cost portfolio
•
Fuel flexibility with gas
cost advantage
•
Poised to benefit from
volatility in real-time
markets
•
Fleet will maintain
diversity and efficiency
after HEDD retirements
•
Most sites suitable for
expansion
ISO
New
England
New York ISO
PJM
New Haven
Bridgeport
Bethlehem Energy Center
(Albany)
Conemaugh
Keystone
Peach Bottom
Bergen
Kearny
Essex
Sewaren
Edison
Linden
Mercer
Burlington
National Park
Hudson
Hope Creek
Salem
Yards Creek
7 |
 Market Review:
Prices have stabilized
•
Energy and gas prices appear to have
stabilized
•
Environmental restrictions may
tighten market
•
Insufficient gas infrastructure
continues to place upward pressure on
fuel prices during seasonal peaks
NYMEX Natural Gas Price
PJM West RTC
PJM West Spark Spreads
F=FORWARDS AS OF 3/24/14
2014F INCLUDES HISTORY AND FORWARDS AS OF 3/24/14
15
$20
$25
$30
$35
$40
$45
$50
$55
$60
2011
2012
2013
2014F
2015F
2016F
2017F
2018F
$-
$1
$2
$3
$4
$5
$6
1/1/2011
1/1/2012
1/1/2013
1/1/2014
1/1/2015
1/1/2016
1/1/2017
1/1/2018
Historical
Forward
$10
$14
$18
$22
$26
$30
$34
$38
2011
2012
2013
2014 F
2015 F
2016 F
2017 F
2018 F |
 Competitive Advantage:
~25% of Power’s gas
for generation comes from Marcellus
•
Our combined cycle and peaking assets have been able to take advantage of
locational gas price volatility driven by production and logistical
constraints •
Lower cost shale supply provides additional savings during periods of lower
residential gas demand Market
Prices for
Natural Gas
Access
to Lower
Cost Shale
Gas in
Marcellus
and Utica
Spot
Natural
Gas
Prices:
Jun
2013
-
Mar
2014
19
$-
$1
$2
$3
$4
$5
$6
$7
$8
Henry Hub
Leidy-Transco (Marcellus) |
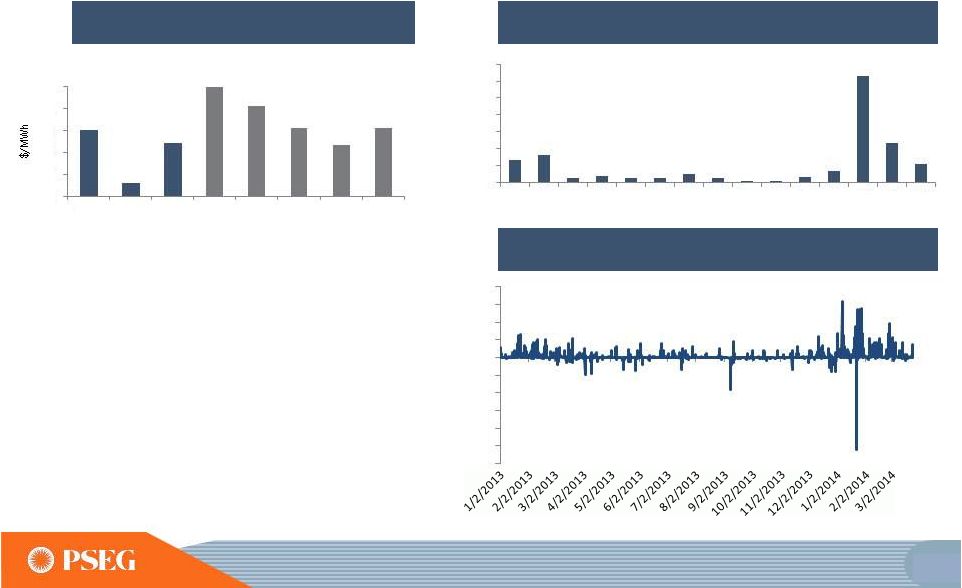 Competitive Advantage:
Locational advantage
from short term basis volatility
$56
-
$58
-ANNUAL FORWARD BASIS TO PJM-WEST AS OF 3/24/2014.
-2014F INCLUDES HISTORY AND FORWARDS AS OF 3/24/14
•
Annual basis benefits baseload
units
•
Intermediate units flexible to
seasonal opportunities
•
Combined Cycle and Peaking
units positioned to optimize daily
and hourly volatility
PS Zone Annual Basis to PJM-W
PS Zone Day Ahead On Peak Monthly Basis to PJM-W
PS Zone Real Time On Peak Hourly Basis to PJM-W
20
$-
$2
$4
$6
$8
$10
2011
2012
2013
2014 F
2015 F
2016 F
2017 F
2018 F
$-
$10
$20
$30
$40
$50
$60
$70
Jan
13
Feb
13
Mar
13
Apr
13
May
13
Jun
13
Jul
13
Aug
13
Sep
13
Oct
13
Nov
13
Dec
13
Jan
14
Feb
14
Mar
14
$(600)
$(500)
$(400)
$(300)
$(200)
$(100)
$-
$100
$200
$300
$400 |
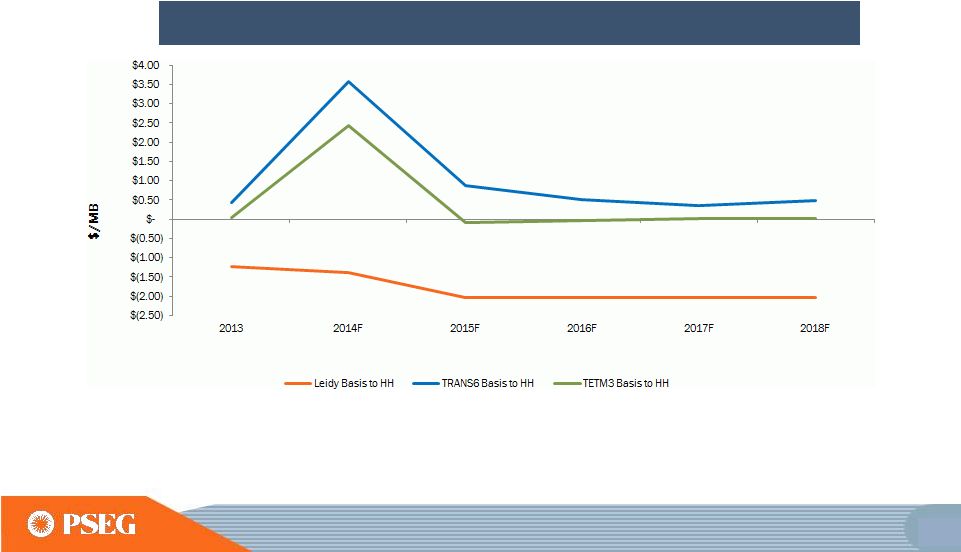 Forward curve shows that Marcellus shale supply averages over $1.50/MMbtu
discount year-round through 2018 Sustainable Advantage: Fuel advantage continues throughout the curve
Basis to Henry Hub
2013 AVERAGE 6/1/13-12/31/13; F= FORWARDS AS OF 3/24/14. LEIDY
BASIS FROM ICE/BROKER QUOTES. 2014F INCLUDES HISTORY AND FORWARDS
AS OF 3/24/14 25 |
 A
Items Excluded from Income from Continuing
Operations/Net Income to Reconcile to Operating Earnings
PLEASE SEE PAGE 3 FOR AN EXPLANATION OF PSEG’S USE OF OPERATING EARNINGS
AS A NON-GAAP FINANCIAL MEASURE AND HOW IT DIFFERS FROM NET
INCOME. (a)
Includes the financial impact from positions with forward delivery
months. 2013
2012
2011
2010
2009
2008
Operating Earnings
1,309
$
1,236
$
1,389
$
1,584
$
1,567
$
1,478
$
Gain (Loss) on Nuclear Decommissioning Trust (NDT)
Fund Related Activity (PSEG Power)
40
52
50
46
9
(71)
Gain (Loss) on Mark-to-Market (MTM)
(a)
(PSEG Power)
(74)
(10)
107
(1)
(11)
14
Lease Transaction Activity (Energy Holdings)
-
36
(173)
-
29
(490)
Storm O&M (PSEG Power)
(32)
(39)
-
-
-
-
Market Transition Charge Refund (PSE&G)
-
-
-
(72)
-
-
Gain (Loss) on Asset Sales and Impairments (Energy Holdings)
-
-
34
-
-
(13)
Income from Continuing Operations
1,243
$
1,275
$
1,407
$
1,557
$
1,594
$
918
$
Discontinued Operations
-
-
96
7
(2)
270
Net Income
1,243
$
1,275
$
1,503
$
1,564
$
1,592
$
1,188
$
Fully Diluted Average Shares Outstanding (in Millions)
508
507
507
507
507
508
Operating Earnings
2.58
$
2.44
$
2.74
$
3.12
$
3.09
$
2.91
$
Gain (Loss) on NDT Fund Related Activity (PSEG Power)
0.08
0.10
0.10
0.09
0.02
(0.14)
Gain (Loss) on MTM
(a)
(PSEG Power)
(0.14)
(0.02)
0.21
-
(0.02)
0.03
Lease Transaction Activity (Energy Holdings)
-
0.07
(0.34)
-
0.05
(0.96)
Storm O&M (PSEG Power)
(0.07)
(0.08)
-
-
-
-
Market Transition Charge Refund (PSE&G)
-
-
-
(0.14)
-
-
Gain (Loss) on Asset Sales and Impairments (Energy Holdings)
-
-
0.06
-
-
(0.03)
Income from Continuing Operations
2.45
$
2.51
$
2.77
$
3.07
$
3.14
$
1.81
$
Discontinued Operations
-
-
0.19
0.01
-
0.53
Net Income
2.45
$
2.51
$
2.96
$
3.08
$
3.14
$
2.34
$
For the Year Ended
December 31,
(Unaudited)
Reconciling Items, net of tax
Earnings
Impact
($
Millions)
Per
Share
Impact
(Diluted)
PUBLIC SERVICE ENTERPRISE GROUP INCORPORATED |