Attached files
| file | filename |
|---|---|
| 8-K - TWIN CITIES POWER HOLDINGS, LLC - ASPIRITY HOLDINGS LLC | tcph_8k-032814.htm |
Exhibit 99.1
| |
16233 Kenyon Ave, Suite 210 Lakeville MN 55044 952-241-3103 main · 952-898-3571 fax |
| March 28, 2014 | PRESS RELEASE |
TCPH Reports Financial Results for 2013
LAKEVILLE, MN – Twin Cities Power Holdings, LLC (“TCPH” or the “Company”) today announced its financial results for the year ended December 31, 2013:
| · | Total revenues for 2013 were $32,785,000 compared to $19,074,000 for 2012, an increase of 71.9%. 2013 revenues were in line with our guidance for the year of $30 to $35 million. |
| · | Operating income1 for 2013 totaled $3,609,000, up 18.8% from $3,038,000 earned in 2012 below our guidance for the year of $4.5 to $5.5 million. |
| · | Net income for 2013 totaled $2,131,000, up 10.4% from $1,930,000 in 2012. |
| · | Comprehensive income for 2013 was $1,825,000, up 44.8% form 2012’s comparable figure of $1,261,000. |
| · | Our ratio of earnings to fixed charges as defined by the SEC2 for 2013 was 2.26 times compared to 2.61 times for 2012. |
| · | With respect to our balance sheet: |
| o | At December 31, 2013, our liquidity ratio (unrestricted cash, cash in trading accounts, and trade receivables divided by total assets) declined to 83.8% compared to 92.2% at December 31, 2012; |
| o | Our debt-to-total capital ratio (total debt divided by total debt plus equity) increased to 68.2% at December 31, 2013 from 49.5% at year-end 2012; and |
| o | Our debt-to-equity ratio (total debt divided by total equity) increased to 2.14 times at December 31, 2013 from 0.98 times at December 31, 2012. |
In the short term, wholesale electricity price levels and changes are driven by supply and demand. Demand is affected by the weather while supply is driven by generation or transmission outages and fuel prices, particularly for natural gas. Generally, the Company’s greatest opportunities to generate trading revenues and profits occur during periods of market turbulence, when the near-term forecast for supply or demand is more likely to be inaccurate.
Normal weather (1983-2012 average) for the U.S. is 4,327 heating degree-days and 1,308 cooling degree-days3. Overall, 2013 was much colder than 2012 with 4,519 versus 3,789 HDD (730 or 19% more) and 1,273 versus 1,456 CDD (183 or 13% fewer). In terms of electricity consumption, cooling degree-days and heating degree-days are not necessarily equal. For example, many people will not turn on their air conditioners until the outside temperature reaches 75° or more and CDDs are measured from a base of 65°. Furthermore, while air conditioning always uses electricity, heating is often provided by other fuels such as natural gas or fuel oil.
| 1 | Previously we gave guidance on net income, but believe that operating income is the more relevant measure for our debt holders. |
| 2 | As defined by the SEC, the ratio of earnings to fixed charges is "earnings" (the sum of income before taxes and fixed charges) divided by "fixed charges" equal to interest expense, one-third of operating lease rental expense to approximate interest, and amortization of deferred financing costs. |
| 3 | A “degree-day” compares outdoor temperatures to a standard of 65°F. Hot days require energy for cooling and are measured in cooling degree-days (“CDD”) while cold days require energy for heating and are measured in heating degree-days (“HDD”). For example, a day with a mean temperature of 80°F would result in 15 CDD and a day with a mean temperature of 40°F would result in 25 HDD. |
| 1 |
| |
16233 Kenyon Ave, Suite 210 Lakeville MN 55044 952-241-3103 main · 952-898-3571 fax |
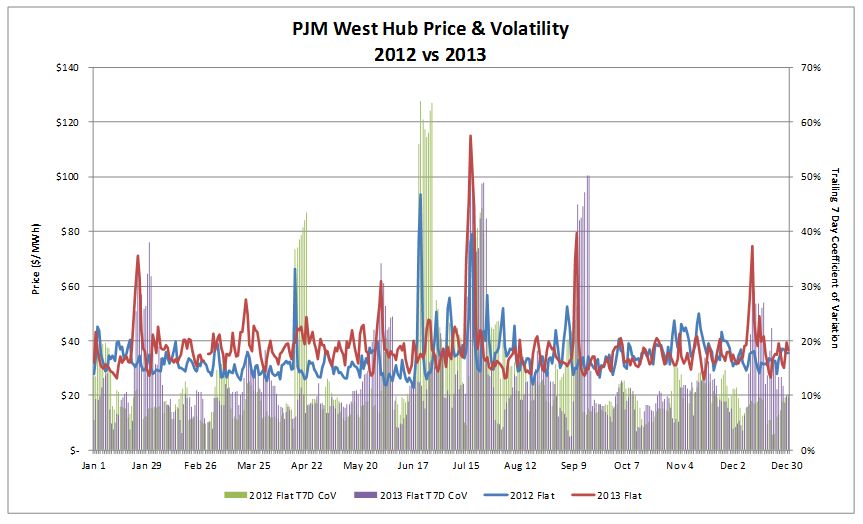
With respect to electricity markets, the average for the benchmark PJM West Peak price during 2013 was $43.26/MWh with a standard deviation of $14.69 and a trading range of $29.70 to $153.85. In 2012, the average price was $39.85/MWh with a high of $127.26, a low of $28.81, and a standard deviation of $11.94. For 2013, the benchmark Henry Hub natural gas spot price averaged $3.73/MMBtu compared to $2.75 for 2012. Furthermore, weekly storage levels averaged 2,784 BCF for 2013 or only about 3% above the 5-year average of 2,712 BCF and 12% below 2012’s figure of 3,159 BCF.
“2013 showed the continuation of a recovery in our wholesale trading business from the unusually depressed market conditions that characterized 2012, and in fact, September 2013 was one of the top 10 best revenue months in our history, although the fourth quarter was not our best. For the year, volatility in the PJM West Hub peak price increased, the weather was colder than normal and the increase in natural gas prices drove prices up from the low levels we saw last year. With respect to our retail business, on January 2 of this year, we closed on the DEG acquisition. Consequently, we are now licensed in 8 out of the 14 jurisdictions that permit all retail electric customers to choose their energy supplier”, said Tim Krieger, TCPH’s Chief Executive Officer.
“As we moved into 2014, the so-called “polar vortex”, record high natural gas prices in New England, and certain unplanned generation outages wreaked havoc on prices in the wholesale markets in the Midwest, Northeast, and Mid-Atlantic. Although many were adversely affected by these events, the exceptional volatility represented an incredible trading opportunity for us. 2014’s first quarter will set revenue and profitability records for us. Accordingly, we are delaying the release of our guidance for 2014 until the first quarter’s filing”, concluded Mr. Krieger.
About Twin Cities Power Holdings, LLC
Through our three business segments – wholesale trading, retail energy services, and real estate development - Twin Cities Power Holdings, LLC trades electricity and energy derivatives for its own account in North American wholesale markets, provides electricity supply services to retail customers in states, and engages in residential real estate development. Our energy businesses are regulated by the Federal Energy Regulatory Commission and the Commodity Futures Trading Commission on the federal level and by the public utilities commissions of the states where we are licensed, including Connecticut, Maryland, Massachusetts, New Hampshire, New Jersey, Ohio, Pennsylvania, and Rhode Island. More information about the Company is available at www.twincitiespower.com. Our retail websites are www.townsquareenergy.com and www.discountenergygroup.com.
TCPH is headquartered at 16233 Kenyon Ave, Suite 210, Lakeville, MN 55044, telephone 952-241-3103. While the equity of the Company is privately held, our Renewable Unsecured Subordinated Notes are registered with the SEC and may be purchased by residents of California, Colorado, Connecticut, Delaware, Florida, Georgia, Illinois, Indiana, Kansas, Michigan, Minnesota, Mississippi, Missouri, New Jersey, New York, Pennsylvania, South Dakota, Texas, Utah, Vermont, and Wisconsin. To obtain an investment kit, visit www.tcpnotes.com.
| 2 |
| |
16233 Kenyon Ave, Suite 210 Lakeville MN 55044 952-241-3103 main · 952-898-3571 fax |
Forward Looking Statements
This press release contains forward-looking statements. Forward-looking statements can be identified by words such as: "may", "will", "expect", "anticipate", "believe", "estimate" "continue", "predict", or other similar words making reference to future periods, including expectations of 2013 revenues and operating income. Forward-looking statements appear in a number of places in this press release and include statements regarding our intent, belief, or current expectation about trends affecting the markets in which we participate, our businesses, financial condition, and growth strategies, among other things. Forward-looking statements are not guarantees of future performance and involve risks and uncertainties. Actual results may differ materially from those predicted in forward-looking statements as a result of various factors, including, but not limited to, those set forth in the "Risk Factors" sections of our filings with the Securities and Exchange Commission.
If any of the events described in these "Risk Factors" occur, they could have a material adverse effect on our business, financial condition, and results of operations. When considering forward-looking statements, you should keep these risk factors, as well as the other cautionary statements in our SEC filings in mind. You should not place undue reliance on any forward-looking statement. We undertake no obligation to update or revise publicly any forward-looking statements, whether as a result of new information, future events, or otherwise after the date of this press release.
Non-GAAP Financial Measures
TCPH’s press releases and other communications may include certain “non-GAAP financial measures”, defined as a numerical measure of a company's financial performance, financial position, or cash flows that excludes, or includes, amounts that are included in, or excluded from, the most directly comparable measure calculated and presented in accordance with GAAP in the company's financial statements.
Non-GAAP financial measures utilized by the Company include presentations of liquidity measures and debt-to-equity ratios. The Company’s management believes that these non-GAAP financial measures provide useful information and enables investors and analysts to more accurately compare the Company's ongoing financial performance over the periods presented.
Investor Relations Contact
Wiley H. Sharp III
VP - Finance & CFO, 952-241-3105
--
| 3 |
| |
16233 Kenyon Ave, Suite 210 Lakeville MN 55044 952-241-3103 main · 952-898-3571 fax |
Twin Cities Power Holdings, LLC & Subsidiaries
| U.S. dollars in thousands | For & at years ended Dec 31, | |||||||
| 2013 | 2012 | |||||||
| Statement of Operations Data | ||||||||
| Wholesale trading revenue, net | $ | 25,305 | $ | 18,256 | ||||
| Retail electricity revenue | 7,480 | 818 | ||||||
| Net revenue | 32,785 | 19,074 | ||||||
| Total costs of revenues & operations | 29,176 | 16,036 | ||||||
| Operating income | 3,609 | 3,038 | ||||||
| Interest expense | (1,502 | ) | (1,065 | ) | ||||
| Interest income | 31 | 31 | ||||||
| Other income (expense), net | 2 | (17 | ) | |||||
| Income before taxes | 2,140 | 1,987 | ||||||
| Tax provision (benefit) | 9 | 56 | ||||||
| Net income | 2,131 | 1,931 | ||||||
| Preferred distributions | (549 | ) | (503 | ) | ||||
| Net income attributable to common | 1,582 | 1,428 | ||||||
| Foreign currency translation adjustment | (201 | ) | (84 | ) | ||||
| Change in fair value of cash flow hedges | 439 | (82 | ) | |||||
| Unrealized gain on investment securities | 6 | – | ||||||
| Comprehensive income | $ | 1,826 | $ | 1,262 | ||||
| Ratio of earnings to fixed charges | 2.26 | x | 2.61 | x | ||||
| Balance Sheet Data | ||||||||
| Cash - unrestricted | $ | 3,190 | $ | 772 | ||||
| Cash in trading accounts | 10,484 | 12,025 | ||||||
| Trade receivables | 1,315 | 2,191 | ||||||
| Other current assets | 639 | 190 | ||||||
| Total current assets | 15,630 | 15,178 | ||||||
| Equipment & furnishings, net | 504 | 571 | ||||||
| Other assets, net | 1,428 | 514 | ||||||
| Total assets | $ | 17,562 | $ | 16,263 | ||||
| Trade payables | $ | 1,036 | $ | 1,469 | ||||
| Accrued expenses | 1,343 | 2,115 | ||||||
| Notes payable, demand & current | 5,123 | 5,006 | ||||||
| Other current liabilities | 250 | – | ||||||
| Total current liabilities | 7,751 | 8,590 | ||||||
| Long term debt | 5,062 | 1,274 | ||||||
| Total liabilities | 12,813 | 9,864 | ||||||
| Redeemable preferred equity | – | 2,745 | ||||||
| Series A preferred equity | 2,745 | – | ||||||
| Common equity | 1,303 | 3,197 | ||||||
| Accumulated comprehensive income | 700 | 457 | ||||||
| Total equity | 4,748 | 6,399 | ||||||
| Total liabilities & equity | $ | 17,562 | $ | 16,263 | ||||
| Liquidity, percent of total assets | 85.4 | % | 92.2 | % | ||||
| Debt to total capital ratio | 68.2 | % | 49.5 | % | ||||
| Debt to equity ratio | 2.14 | x | 0.98 | x | ||||
| 4 |
| |
16233 Kenyon Ave, Suite 210 Lakeville MN 55044 952-241-3103 main · 952-898-3571 fax |
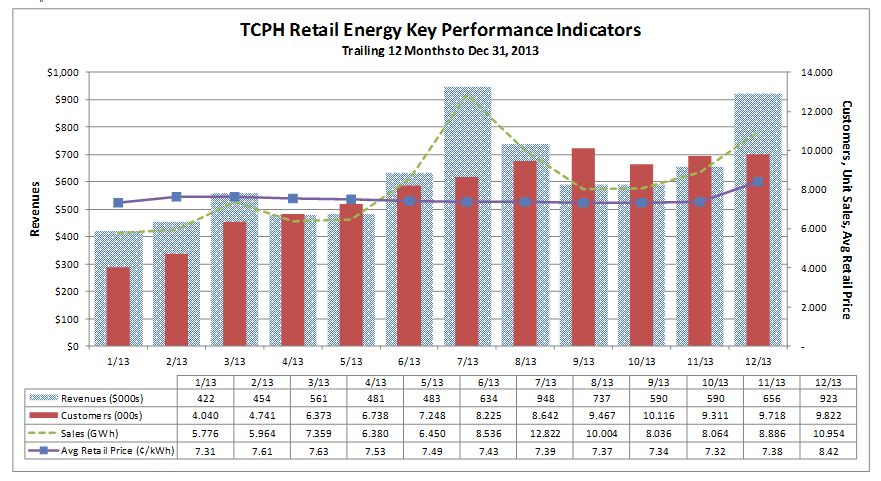
This chart shows the growth of the Company’s retail business since January 1, 2013. During the year, revenue (the dotted blue bars, left scale) averaged about $623,000/month and unit sales averaged 8,269 MWh/month (green dotted line, right scale). Our customer counts (the red bars, right scale) increased from about 4,000 to over 9,800. Our primary marketing strategy has been to price our contracts such that our offers provide savings compared to the standard rates offered by the incumbent utilities (Connecticut Light & Power and United Illuminating). Consequently, our offers typically appear in the first two or three listings below theirs on ctenergyinfo.com, a comparison shopping engine sponsored by the Connecticut Department of Energy & Environmental Protection (formerly the Department of Public Utility Control). For example, on March 29, 2013, CLP’s standard offer to residential consumers was 7.62 ¢/kWh fixed through June 30, 2013, UI’s was 7.70 ¢/kWh fixed through December 31, 2013, and we were offering a three month fixed price contract at 6.97 ¢/kWh with no cancellation fee.
| 5 |
| |
16233 Kenyon Ave, Suite 210 Lakeville MN 55044 952-241-3103 main · 952-898-3571 fax |
This chart shows the volatility in PJM West Hub Peak power prices from January 2012 to December 2013. Our revenues generally correspond to weather-driven volatility or lack thereof. The return of relatively normal volatility in much of 2013 improved our revenues and profits compared to 2012, but other factors come into play as well, which might cause revenues to correlate less directly to volatility. Among others, these factors include the size and nature of the trades we may or may not have in place when and if the market moves, as well as the duration of profitable trading opportunities.
| 6 |