Attached files
| file | filename |
|---|---|
| 8-K - FORM 8-K - PUBLIC SERVICE ENTERPRISE GROUP INC | d619130d8k.htm |
| EX-99 - EX-99 - PUBLIC SERVICE ENTERPRISE GROUP INC | d619130dex99.htm |
 Public Service Enterprise Group
PSEG Earnings Conference Call
3rd Quarter 2013
October 30, 2013
EXHIBIT 99.1 |
 1
Forward-Looking Statement
Certain of the matters discussed in this communication about us and our
subsidiaries future performance, including, without
limitation, future revenues, earnings, strategies, prospects,
consequences and all other statements that are not purely historical
constitute “forward-looking statements” within the meaning of the Private
Securities Litigation Reform Act of 1995. Such forward-looking statements
are subject to risks and uncertainties, which could cause actual results
to differ materially from those anticipated. Such statements are based
on management's beliefs as well as assumptions made by and information
currently available to management. When used herein, the words
“anticipate,” “intend,” “estimate,” “believe,” “expect,” “plan,”
“should,” “hypothetical,” “potential,”
“forecast,” “project,” variations of such words and
similar expressions are intended to identify forward-looking statements. Factors
that may cause actual results to differ are often presented with the
forward-looking statements themselves. Other factors that could
cause actual results to differ materially from those contemplated in any
forward looking statements made by us herein are discussed in filings we
make with the United States Securities and Exchange Commission (SEC),
including our Annual Report on Form 10-K and subsequent reports on
Form 10-Q and Form 8-K and available on our website: • adverse changes in the demand for or the price of the capacity and
energy that we sell into wholesale electricity markets,
• adverse changes in energy industry law, policies and regulation,
including market structures and a potential shift away from competitive
markets toward subsidized market mechanisms, transmission planning
and cost allocation rules, including rules regarding how
transmission is planned and who is permitted to build transmission in
the future, and reliability standards, • any inability of our transmission and distribution businesses to
obtain adequate and timely rate relief and regulatory approvals from
federal and state regulators, • changes in federal and state environmental regulations that could
increase our costs or limit our operations,
• changes in nuclear regulation and/or general developments in the nuclear
power industry, including various impacts from any accidents or
incidents experienced at our facilities or by others in the industry,
that could limit operations of our nuclear generating units,
• actions or activities at one of our nuclear units located on a
multi-unit site that might adversely affect our ability to
continue to operate that unit or other units located at the same
site, • any inability to balance our energy obligations, available supply and
risks, • any deterioration in our credit quality or the credit quality of our
counterparties, including in our leveraged leases,
• availability of capital and credit at commercially reasonable terms and
conditions and our ability to meet cash needs,
• changes in the cost of, or interruption in the supply of, fuel and
other commodities necessary to the operation of our generating units,
• delays in receipt of necessary permits and approvals for our
construction and development activities,
• delays or unforeseen cost escalations in our construction and
development activities,
• any inability to achieve, or continue to sustain, our expected levels
of operating performance,
• any equipment failures, accidents, severe weather events or other
incidents that impact our ability to provide safe and reliable
service to our customers, and any inability to obtain sufficient
coverage or recover proceeds of insurance on such matters,
• increases in competition in energy supply markets as well as
competition from certain rate-based transmission projects,
• any inability to realize anticipated tax benefits or retain tax
credits, • challenges associated with recruitment and/or retention of a qualified
workforce, • adverse performance of our decommissioning and defined benefit plan
trust fund investments and changes in funding requirements, and
• changes in technology, such as distributed generation and microgrids,
and resultant changes in customer usage patterns, including energy
efficiency and demand response.
All of the forward-looking statements made in this report are qualified by
these cautionary statements and we cannot assure you that the results
or developments anticipated by management will be realized or even if
realized, will have the expected consequences to, or effects on, us or
our business prospects, financial condition or results of operations.
Readers are cautioned not to place undue reliance on these
forward-looking statements in making any investment decision. Forward-
looking statements made in this report apply only as of the date of this
report. While we may elect to update forward-looking statements
from time to time, we specifically disclaim any obligation to do so,
even if internal estimates change, unless otherwise required by
applicable securities laws. The forward-looking statements contained in
this report are intended to qualify for the safe harbor provisions of Section
27A of the Securities Act of 1933, as amended, and Section 21E of the
Securities Exchange Act of 1934, as amended. http://www.pseg.com.
These factors include, but are not limited to: |
| 2
GAAP Disclaimer
PSEG presents Operating Earnings in addition to its Income from
Continuing Operations/Net Income reported in accordance with accounting
principles generally accepted in the United States (GAAP). Operating
Earnings is a non-GAAP financial measure that differs from Net Income
because it excludes gains or losses associated with Nuclear
Decommissioning Trust (NDT), Mark-to-Market (MTM) accounting, and
other material one-time items. PSEG presents Operating Earnings because
management believes that it is appropriate for investors to consider results
excluding these items in addition to the results reported in accordance with
GAAP. PSEG believes that the non-GAAP financial measure of Operating
Earnings provides a consistent and comparable measure of performance of
its businesses to help shareholders understand performance trends. This
information is not
intended to be viewed as an alternative to GAAP
information. Slide A at the end of this presentation includes a list of items
excluded from Income from Continuing Operations/Net Income to reconcile
to Operating Earnings, with a reference to that slide included on each of
the slides where the non-GAAP information appears.
|
 PSEG
2013 Q3 Review
Ralph Izzo
Chairman, President and Chief Executive Officer |
 4
Q3 Earnings Summary
$ millions (except EPS)
2013
2012
Operating Earnings
$ 385
$ 382
Reconciling Items, Net of Tax
5
(35)
Income from Continuing Operations/
Net Income
$ 390
$ 347
EPS from Operating Earnings*
$ 0.76
$ 0.75
Quarter ended September 30
* See Slide A for Items excluded from Income from Continuing Operations/Net
Income to reconcile to Operating Earnings. |
 5
Year to Date Earnings Summary
$ millions (except EPS)
2013
2012
Operating Earnings
$ 1,061
$ 1,029
Reconciling Items, Net of Tax
(18)
22
Income from Continuing Operations/
Net Income
$ 1,043
$ 1,051
EPS from Operating Earnings*
$ 2.09
$ 2.03
Nine months ended September 30
* See Slide A for Items excluded from income from Continuing Operations/Net
Income to reconcile to Operating Earnings. |
 6
PSEG –
Q3 2013 Highlights
Operating Earnings of $0.76 vs. $0.75 per share in Q3 2012
Delivered solid results in the quarter driven by Power’s locational
value, and PSE&G’s continuing investment in transmission
Raised 2013 full–year, operating earnings guidance to $2.40-$2.55 per
share, from $2.25-$2.50 per share prior
Executing on operational goals
Power met summer demand using diverse fleet
Continued control of O&M supports full-year expectations
Executing on capital program
Transmission program of $3.4 billion, including construction of 5 major
transmission projects, continues on schedule and on budget
Review of Energy Strong proposal underway by BPU
Over 80 NJ municipalities, including 7 county governments, have passed resolutions
in support of the Energy Strong infrastructure proposal
Market developments
US
District
Courts
in
NJ
and
MD
rendered
decisions
supportive
of
competitive
markets
and FERC’s rate-setting authority
New LIPA agreement broadens and extends original contract
|
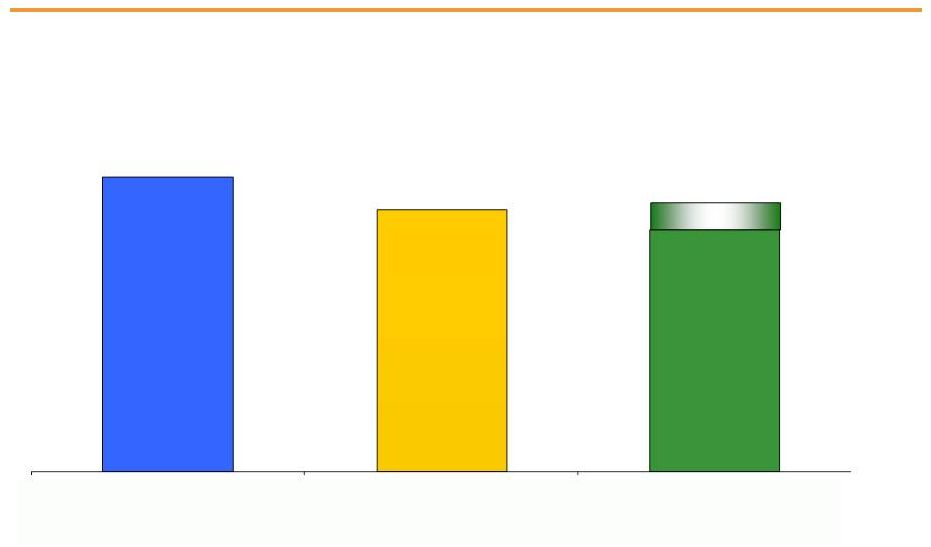 7
$2.40 -
$2.55E
PSEG –
Raising 2013 Operating Earnings Guidance
$2.74
* See Slide A for Items excluded from Income from Continuing Operations/Net Income
to reconcile to Operating Earnings. E = Estimate.
$2.44
We
have
raised
full-year
2013
Operating
Earnings
guidance
to
$2.40
-
$2.55
per
share
from
$2.25
-
$2.50
per
share
2011 Operating Earnings*
2012 Operating Earnings*
2013 Operating Earnings Guidance |
 PSEG
2013 Q3 Operating Company Review
Caroline Dorsa
EVP and Chief Financial Officer |
 9
Q3 Operating Earnings by Subsidiary
Operating Earnings
Earnings per Share
$ millions (except EPS)
2013
2012
2013
2012
PSEG Power
$ 216
$ 217
$ 0.43
$ 0.43
PSE&G
168
155
0.33
0.30
PSEG Energy Holdings/
Enterprise
1
10
-
0.02
Operating Earnings*
$ 385
$ 382
$ 0.76
$ 0.75
Quarter ended September 30
* See Slide A for Items excluded from Income from Continuing Operations/Net Income
to reconcile to Operating Earnings. |
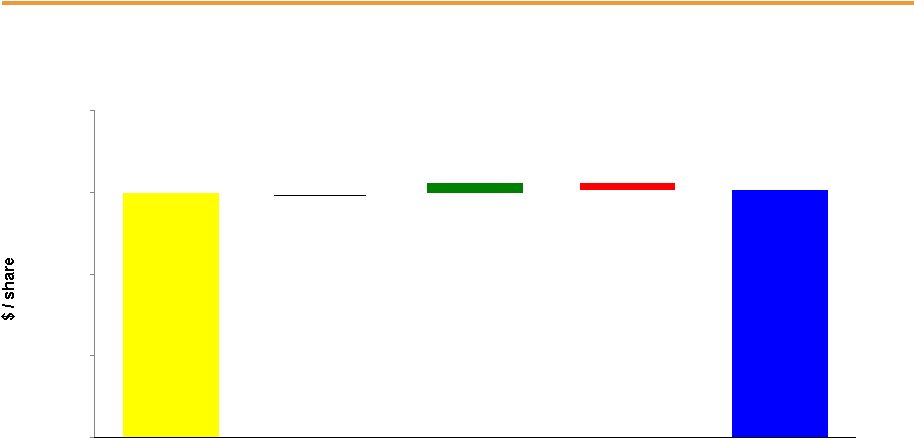 10
$0.75
0.03
$0.76
(0.02)
0.00
0.25
0.50
0.75
1.00
PSEG EPS Reconciliation –
Q3 2013 versus Q3 2012
Higher Capacity 0.11
Market Pricing and
Lower Supply
Costs 0.04
Taxes & Other 0.01
Lower Hedge
Pricing (0.10)
O&M (0.04)
Lower Volume (0.02)
Transmission 0.04
Capital
Infrastructure
Program &
Other 0.01
Weather and
Demand (0.02)
Q3 2013
Operating
Earnings*
Q3 2012
Operating
Earnings*
PSEG Power
PSE&G
Energy
Holdings/
Enterprise
* See Slide A for Items excluded from Income from Continuing Operations/Net Income
to reconcile to Operating Earnings. 0.00
2012 Asset
Sale and
Impairment
(0.01)
Other (0.01) |
 11
Year to Date Operating Earnings by Subsidiary
Operating Earnings
Earnings per Share
$ millions (except EPS)
2013
2012
2013
2012
PSEG Power
$ 580
$ 523
$ 1.14
$ 1.03
PSE&G
468
453
0.92
0.89
PSEG Energy Holdings/
Enterprise
13
53
0.03
0.11
Operating Earnings*
$ 1,061
$ 1,029
$ 2.09
$ 2.03
Nine months ended September 30
•See Slide A for Items excluded from Income from Continuing Operations/Net
Income to reconcile to Operating Earnings. |
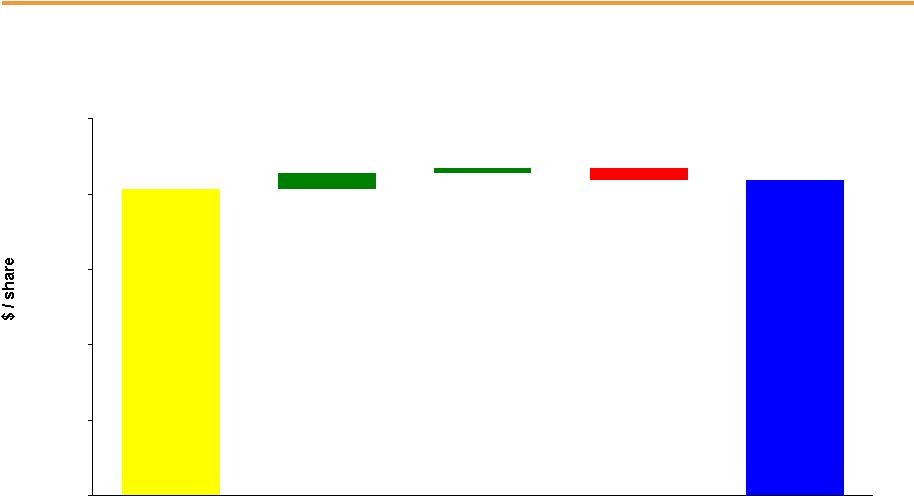 12
$2.03
0.11
0.03
$2.09
(0.08)
0.00
0.50
1.00
1.50
2.00
2.50
PSEG EPS Reconciliation –
YTD 2013 versus YTD 2012
YTD 2013
Operating
Earnings*
YTD 2012
Operating
Earnings*
Higher Capacity 0.23
Market Pricing
and Lower Supply
Costs 0.04
Gas Send-out and Fixed
Cost Recovery 0.04
Volume 0.01
Lower Hedge Pricing (0.15)
O&M (0.05)
D&A (0.01)
PSEG Power
Transmission 0.10
Capital
Infrastructure
Program
& Other 0.01
Taxes and
Other 0.02
O&M (0.02)
Weather and
Demand (0.01)
D&A (0.01)
Absence of Tax
Settlement (0.06)
PSE&G
**
PSEG Energy
Holdings/
Enterprise
Absence of Tax
Settlement
(0.07)
Asset Sales
and Other
(0.01)
*
See Slide A for Items excluded from Income from Continuing Operations/Net Income
to reconcile to Operating Earnings. **
Prior quarter results for reconciling items may not add to year-to-date
(YTD) totals due to rounding. |
 PSEG
Power 2013 Q3 Review |
 14
PSEG Power –
Q3 Earnings Summary
$ millions (except EPS)
Q3 2013
Q3 2012
Variance
Operating Revenues
$ 1,169
$ 1,038
$ 131
Operating Earnings
216
217
(1)
NDT Funds Related
Activity,
Net of Tax
12
40
(28)
Mark-to-Market, Net of Tax**
3
(76)
79
Storm O&M, Net of Insurance
Recoveries
(10)
-
(10)
Income from Continuing
Operations/Net Income
221
181
40
EPS from Operating Earnings*
$ 0.43
$ 0.43
$ (0.00)
* See Slide A for Items excluded from Income from Continuing Operations/Net Income
to reconcile to Operating Earnings. **Includes the financial impact from
positions with forward delivery months. |
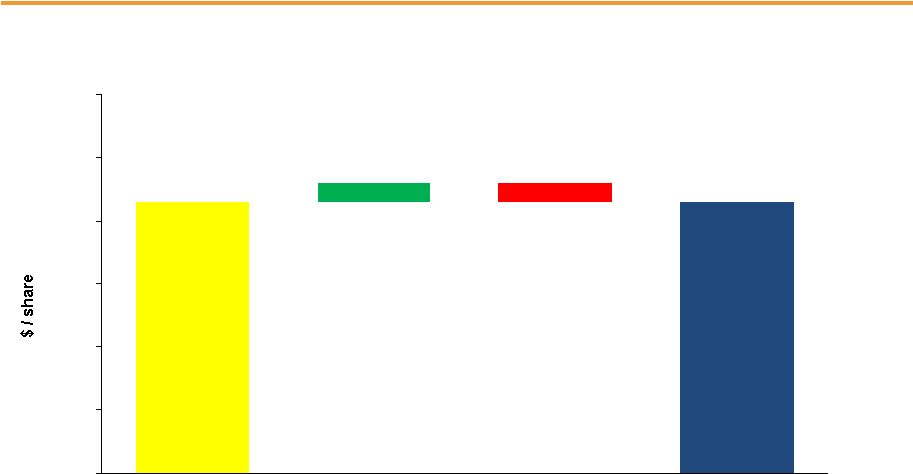 15
$0.43
0.03
$0.43
(0.03)
0.00
0.10
0.20
0.30
0.40
0.50
0.60
Higher Capacity 0.11
Market Pricing
and Lower Supply
Costs 0.04
Lower Hedge Pricing
(0.10)
Lower Volume (0.02)
PSEG Power EPS Reconciliation –
Q3 2013 versus Q3 2012
Q3 2013
Operating
Earnings*
Q3 2012
Operating
Earnings*
O&M (0.04)
Taxes and
Other 0.01
* See Slide A for Items excluded from Income from Continuing Operations/Net Income
to reconcile to Operating Earnings. |
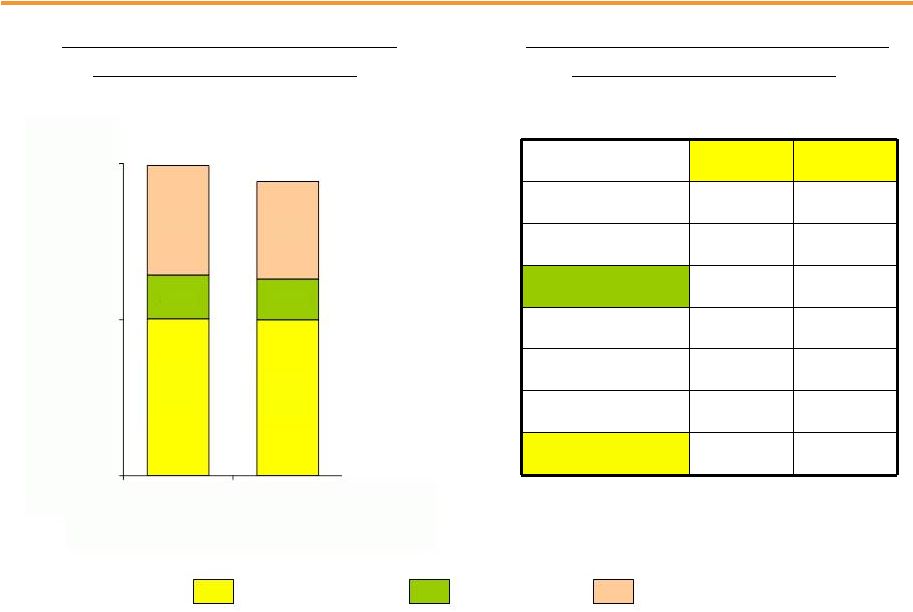 16
PSEG Power –
Generation Measures
Quarter
ended
September
30
Total Nuclear
Total Coal*
Oil & Natural Gas
* Includes figures for Pumped Storage. Includes Hudson and Mercer when run on gas.
PSEG Power –
Generation (GWh)
Quarter
ended
September
30
PSEG Power –
Capacity Factors (%)
2012
2013
Combined Cycle
PJM and NY
67.1%
60.4%
Coal
NJ (Coal/Gas)
26.6%
16.3%
PA
79.0%
83.1%
CT
3.8%
11.6%
Nuclear
92.0%
91.0%
7,559
7,498
2,071
1,936
5,289
4,677
7,500
15,000
2012
2013
0
14,919
14,111 |
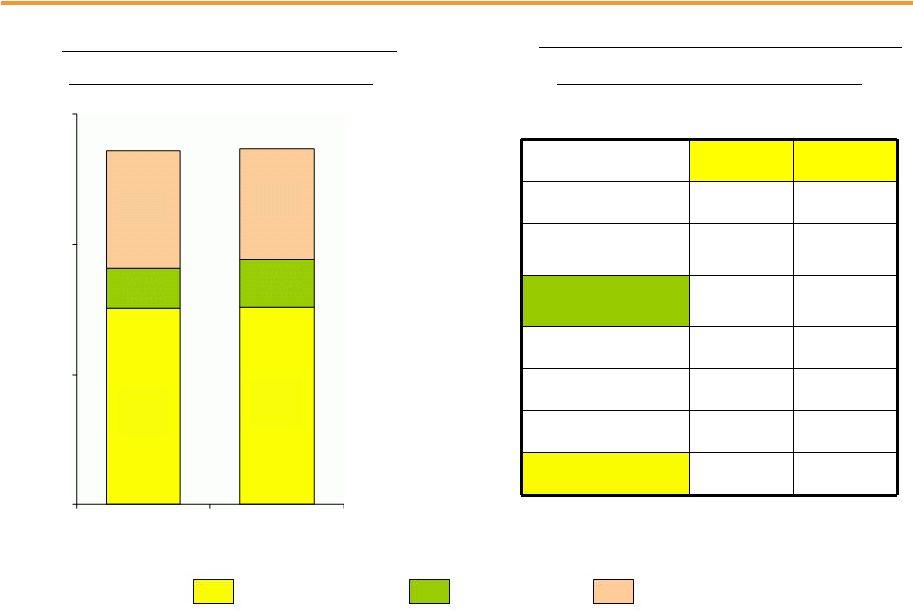 17
PSEG Power –
Generation Measures
Nine
Months
ended
September
30
Total Nuclear
Total Coal*
Oil & Natural Gas
* Includes figures for Pumped Storage. Includes Hudson and Mercer when run on
gas. PSEG Power –
Generation (GWh)
40,769
40,986
Nine
Months
ended
September
30
PSEG Power –
Capacity Factors (%)
2012
2013
Combined Cycle
PJM and NY
60.3%
57.0%
Coal*
NJ (Coal/Gas)
14.2%
14.2%
PA
68.7%
79.4%
CT
2.9%
16.6%
Nuclear
92.5%
93.2%
22,604
22,783
4,656
5,526
13,509
12,677
0
15,000
30,000
45,000
2012
2013 |
 18
PSEG Power –
Fuel Costs
Quarter ended September 30
($ millions)
2012
2013
Coal
64.9
45.1
Oil & Gas
166.7
146.1
Total Fossil
231.6
191.2
Nuclear
52.7
56.5
Total Fuel Cost
284.3
247.7
Total Generation
(GWh)
14,919
14,111
$ / MWh
19.05
17.55
PSEG Power –
Fuel Costs
Nine months ended
September 30
($ millions)
2012
2013
Coal
142.4
141.3
Oil & Gas
407.8
483.8
Total Fossil
550.2
625.1
Nuclear
150.7
166.6
Total Fuel Cost
700.9
791.7
Total Generation
(GWh)
40,769
40,986
$ / MWh
17.19
19.32 |
 19
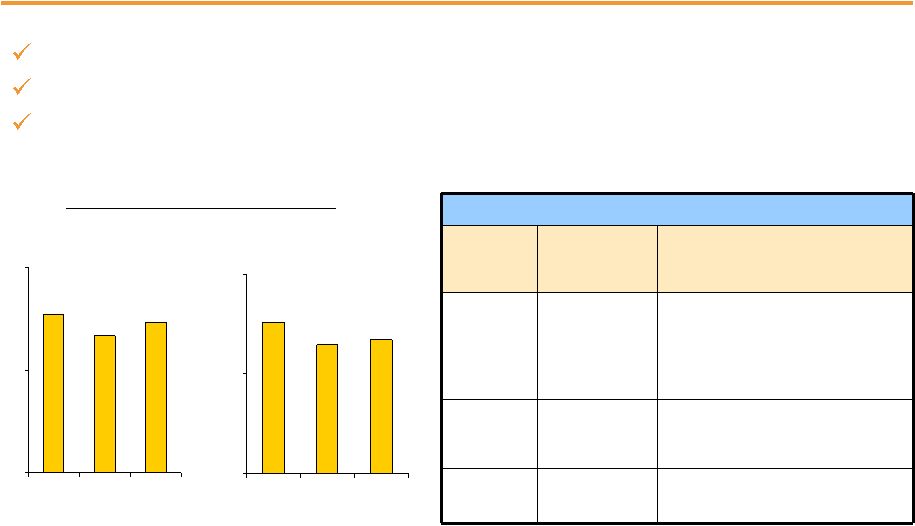
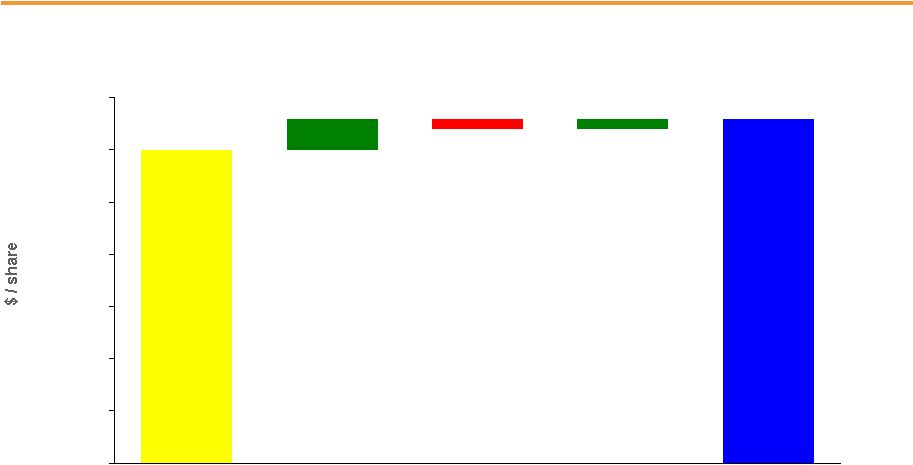
PSEG Power –
Gross Margin Performance
Margins aided by higher capacity pricing through mid-2014
Higher year-over-year spot market prices continued in Q3
Lower cost Marcellus gas contributing to fuel cost savings
Regional Performance
Region
Q3 2013
Gross
Margin ($M)
2013 Performance
PJM
$691
Decline in hedged energy prices
offset by full quarter of higher
capacity prices and lower fuel costs
New
England
$19
Milder weather
New York
$12
Major maintenance outage limited
production during Q3
$0
$35
$70
2011
2012
2013
PSEG Power Gross Margin ($/MWh)
$54
$47
$51
Quarter ended
September 30
$0
$35
$70
2011
2012
2013
Nine months ended
September 30
$53
$45
$47 |
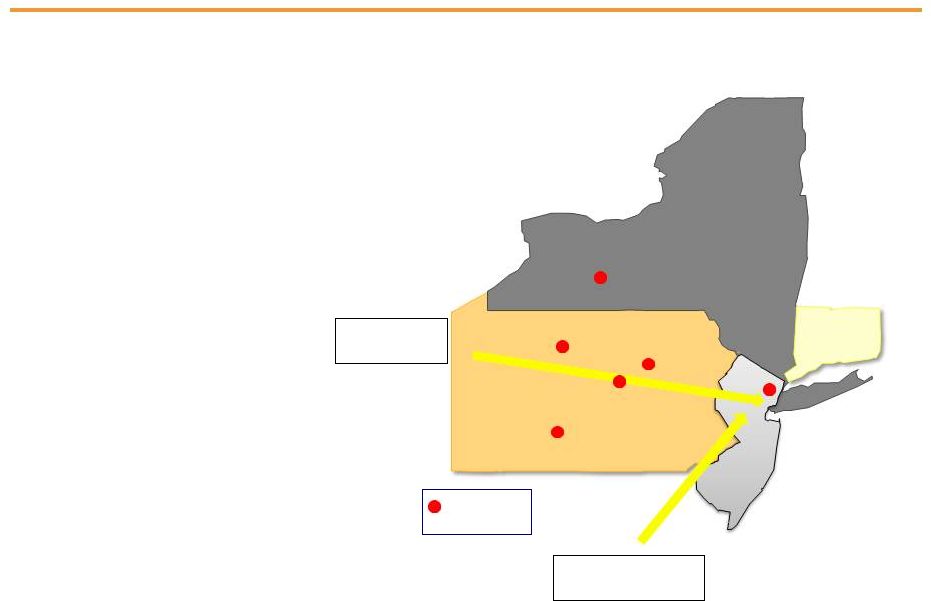 •
Lower cost supplies of
shale gas have been
beneficial to both PSE&G
customers and PSEG
Power
•
Over 50% of our available
pipeline capacity can
access market area
supplies of shale gas
•
Power’s generating units
sit in close proximity to
the Marcellus fairway
•
Power buys approximately
350BCF/year of gas
•
Availability of a robust gas
portfolio of storage and
pipeline capacity primarily
benefits PSE&G’s gas
customers and then Power,
as conditions permit
Gulf Coast Supply
0.7 BCF/D
Shale Supply
0.6 BCF/D
Storage
0.9 BCF/D
Albany
PSEG’s locational advantage and gas basis
New York
20 |
 21
Hedging Update…
Contracted Energy*
* Hedge percentages and prices as of September 30, 2013.
Revenues of full requirement load deals based on contract price, including
renewable energy credits, ancillary, and transmission components but
excluding capacity. Hedges include positions with MTM accounting treatment
and options. Volume TWh
8
35
35
Base Load
% Hedged
100%
100%
55-60%
(Nuclear and Base Load Coal)
Price $/MWh
$50
$48
$48
Volume TWh
5
18
17
Intermediate Coal, Combined
% Hedged
30-35%
5-10%
0%
Cycle, Peaking
Price $/MWh
$50
$48
$48
Volume TWh
13-14
53-55
52-54
Total
% Hedged
70-75%
65-70%
35-40%
Price $/MWh
$50
$48
$48
Oct -Dec
2013
2014
2015 |
 22
PSEG Power –
Q3 2013 Operating Highlights
Power met all demand requirements during the hottest days of July
Q3 output declined by 5.4% from the Q3 2012 reflecting maintenance at NY CCGT
Strong nuclear performance has resulted in a YTD nuclear capacity factor of
93.2% Hope Creek refueling outage underway
Operations
Regulatory and Market
Environment
Financial
Recent NJ and MD Federal Court decisions supportive of competitive markets
Average energy only hedge price for 2013 is $50/MWh
Lower cost Marcellus gas continuing to provide fuel cost savings
Power’s total debt as a percentage of capital at September 30 was 28%
|
 PSE&G
2013 Q3 Review |
 24
PSE&G –
Q3 Earnings Summary
$ millions (except EPS)
Q3 2013
Q3 2012
Variance
Operating Revenues
$ 1,666
$ 1,683
$ (17)
Operating Expenses
Energy Costs
661
756
(95)
408
366
42
236
216
20
15
24
(9)
Total Operating Expenses
1,320
1,362
(42)
Operating Earnings / Net Income
$ 168
$ 155
$ 13
EPS from Operating Earnings*
$ 0.33
$ 0.30
$ 0.03
* See Slide A for Items excluded from Income from Continuing Operations/Net Income
to reconcile to Operating Earnings. Operation & Maintenance
Taxes Other than Income Taxes
Depreciation & Amortization |
 25
$0.30
0.03
0.01
$0.33
(0.01)
0.00
0.05
0.10
0.15
0.20
0.25
0.30
0.35
PSE&G EPS Reconciliation –
Q3 2013
versus Q3 2012
Q3 2013
Operating
Earnings
Q3 2012
Operating
Earnings
Transmission 0.04
Capital
Infrastructure
Program
and Other 0.01
Weather
and Demand (0.02)
O&M and D&A
Interest
and
Other |
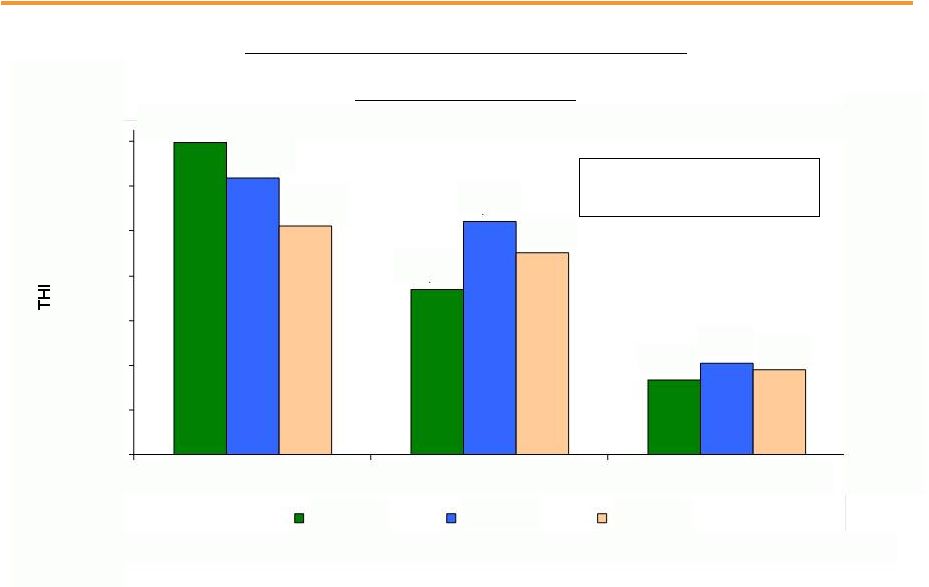 26
PSE&G –
Monthly Summer Weather Data
2013
vs.
2012
vs.
Normal
-8.0% Q3 2013 vs. Q3 2012
+7.4% Q3 2013 vs. Normal
6,977
3,691
1,687
6,183
5,196
2,054
5,111
4,502
1,895
0
1,000
2,000
3,000
4,000
5,000
6,000
7,000
July
August
September
2013
2012
Normal
PSE&G Monthly Temperature Humidity Index (THI) |
 27
PSE&G –
Q3 Operating Highlights
All five major Transmission projects on schedule and on budget
BPU review of Energy Strong infrastructure proposal underway;
Public hearings concluded in October
2014 FERC Formula Rate filing submitted
PSE&G announced a 33% gas bill credit for November and December 2013
to reflect lower commodity costs for residential gas customers
PSE&G earned its authorized return
Issued $600 million of secured MTNs and retired $300 million of maturities in
Q3 Operations
Regulatory and Market
Environment
Financial
Weather in Q3 2013 warmer than normal but cooler than Q3 2012
Transmission revenues added $0.04 per share over Q3 2012
O&M remains under control |
 PSEG
Energy Holdings/Enterprise 2013 Q3 Review |
 29
PSEG Energy Holdings/Enterprise –
Q3 Earnings Summary
$ millions (except EPS)
Q3 2013
Q3 2012
Variance
Operating Earnings
$ 1
$ 10
$ (9)
Lease Related Activity
-
1
(1)
Net Income
$ 1
$ 11
$ (10)
EPS from Operating Earnings*
$ 0.00
$ 0.02
$ (0.02)
* See Slide A for Items excluded from Income from Continuing Operations/Net Income
to reconcile to Operating Earnings. |
 30
PSEG Energy Holdings/Enterprise –
Q3 Operating Highlights
Financial
LIPA –
Amended Operating Services Agreement will begin January 1, 2014
subject to LIPA receiving IRS ruling on tax status of debt
NRG Energy’s announced acquisition of Edison Mission Energy
would cure all monetary defaults at closing and preserve Holdings’
entire equity value in the Powerton and Joliet leases
Payments on Holdings’
remaining lease portfolio are current
Q4 2013 commercial operation of $50 million investment in 19 MW,
Badger 1 solar farm in Arizona
•
Increases PSEG-Long Island’s management responsibility to operate
and maintain the LIPA T&D system
•
Extends original 10-year contract by two years
•
PSEG Power will procure LIPA’s fuel requirements beginning 2015
•
PSEG-LI compensation will increase in 2016 for expanded management role
|
 PSEG |
 32
PSEG Financial Highlights
2013
operating
earnings
guidance
raised
to
$2.40
-
$2.55
per
share
Focused on maintaining operating efficiency and customer reliability
PSE&G’s operating earnings on track to grow at double-digit rate in
2013 Executing PSE&G’s existing $3.4 billion Transmission capital
spending program on
schedule
and
on
budget
–
fueling
double-digit
growth
in
PSE&G
operating
earnings through 2015, based on approved programs
Financial position remains strong
Positive cash from Power and increasing cash flow from PSE&G supports dividend
growth and funds capital spending program without the need to issue
equity Debt as a percentage of capital was 41% at September 30, 2013
Long history of returning cash to the shareholder through the common dividend,
with opportunity for future growth |
 33
PSEG 2013 Operating Earnings Guidance -
By Subsidiary
$ millions (except EPS)
2013E
2012A
PSEG Power
$630 –
$685
$644
PSE&G
$585 –
$600
$528
PSEG Energy
Holdings/Enterprise
$0 –
$10
$64
Operating Earnings*
$1,215 –
$1,295
$1,236
Earnings per Share
$2.40 –
$2.55
$2.44
* See Slide A for Items excluded from Income from Continuing Operations/Net Income
to reconcile to Operating Earnings. E = Estimate A =
Actual |
 PSEG
Liquidity as of September 30, 2013 Expiration
Total
Available
Company
Facility
Date
Facility
Usage
Liquidity
($Millions)
PSE&G
5-year Credit Facility
Mar-18
$600
1
$13
$587
5-Year Credit Facility (Power)
Mar-17
$1,600
58
$1,542
5-Year Credit Facility (Power)
Mar-18
$1,000
2
0
$1,000
5-Year Bilateral (Power)
Sep-15
$100
100
$0
5-year Credit Facility (PSEG)
Mar-17
$500
5
$495
5-year Credit Facility (PSEG)
Mar-18
$500
3
0
$500
Total
$4,300
$176
$4,124
1 PSE&G Facility to be reduced by $29M on April 15, 2016
$154
2 Power Facility to be reduced by $48M on April 15, 2016
PSE&G ST Investment
$0
3 PSEG Facility to be reduced by $23M on April 15, 2016
Total Liquidity Available
$4,278
Total Parent / Power Liquidity
$3,691
PSEG /
Power
PSEG Money Pool ST Investment
34 |
 Items
Excluded from Income from Continuing Operations to Reconcile to Operating
Earnings Please see Slide 2 for an explanation of PSEG’s use of Operating
Earnings as a non-GAAP financial measure and how it differs from Income
from Continuing Operations/Net Income. A
2013
2012
2013
2012
2012
2011
Earnings Impact ($ Millions)
Operating Earnings
385
$
382
$
1,061
$
1,029
$
1,236
$
1,389
$
Gain (Loss) on Nuclear Decommissioning Trust (NDT)
Fund Related Activity (PSEG Power)
12
40
29
49
52
50
Gain
(Loss)
on
Mark-to-Market
(MTM)
(a)
(PSEG
Power)
3
(76)
(22)
(34)
(10)
107
Lease Related Activity (PSEG Energy Holdings)
-
1
-
7
36
(173)
Storm O&M, net of insurance recoveries (PSEG Power)
(10)
-
(25)
-
(39)
-
Gain on Sale of Asset (PSEG Energy Holdings)
-
-
-
-
-
34
Income from Continuing Operations
390
$
347
$
1,043
$
1,051
$
1,275
$
1,407
$
Discontinued Operations
-
-
-
-
-
96
Net Income
390
$
347
$
1,043
$
1,051
$
1,275
$
1,503
$
Fully Diluted Average Shares Outstanding (in Millions)
508
507
507
507
507
507
Per Share Impact (Diluted)
Operating Earnings
0.76
$
0.75
$
2.09
$
2.03
$
2.44
$
2.74
$
Gain (Loss) on NDT Fund Related Activity (PSEG Power)
0.02
0.08
0.06
0.10
0.10
0.10
Gain (Loss) on MTM
(a)
(PSEG Power)
0.01
(0.15)
(0.04)
(0.07)
(0.02)
0.21
Lease Related Activity (PSEG Energy Holdings)
-
-
-
0.01
0.07
(0.34)
Storm O&M, net of insurance recoveries (PSEG Power)
(0.02)
-
(0.05)
-
(0.08)
-
Gain on Sale of Asset (PSEG Energy Holdings)
-
-
-
-
-
0.06
Income from Continuing Operations
0.77
$
0.68
$
2.06
$
2.07
$
2.51
$
2.77
$
Discontinued Operations
-
-
-
-
-
0.19
Net Income
0.77
$
0.68
$
2.06
$
2.07
$
2.51
$
2.96
$
(a) Includes the financial impact from positions with forward delivery
months. Three Months Ended
Nine Months Ended
PUBLIC SERVICE ENTERPRISE GROUP INCORPORATED
Reconciling Items Excluded from Income from Continuing Operations/Net Income to
Compute Operating Earnings (Unaudited)
September 30,
September 30,
Pro-forma Adjustments, net of tax
Year Ended
December 31, |