Attached files
| file | filename |
|---|---|
| 8-K - 8-K - O-I Glass, Inc. /DE/ | a13-23193_18k.htm |
| EX-99.1 - EX-99.1 - O-I Glass, Inc. /DE/ | a13-23193_1ex99d1.htm |
Exhibit 99.2
|
|
O-I Third Quarter 2013 Earnings Presentation October 31, 2013 |

|
|
Safe Harbor Comments Regulation G The information presented above regarding adjusted net earnings relates to net earnings attributable to the Company exclusive of items management considers not representative of ongoing operations and does not conform to U.S. generally accepted accounting principles (GAAP). It should not be construed as an alternative to the reported results determined in accordance with GAAP. Management has included this non-GAAP information to assist in understanding the comparability of results of ongoing operations. Management uses this non-GAAP information principally for internal reporting, forecasting, budgeting and calculating compensation payments. Further, the information presented above regarding free cash flow does not conform to GAAP. Management defines free cash flow as cash provided by continuing operating activities less capital spending (both as determined in accordance with GAAP) and has included this non-GAAP information to assist in understanding the comparability of cash flows. Management uses this non-GAAP information principally for internal reporting, forecasting and budgeting. Management believes that the non-GAAP presentation allows the board of directors, management, investors and analysts to better understand the Company’s financial performance in relationship to core operating results and the business outlook. Forward Looking Statements This document contains "forward looking" statements within the meaning of Section 21E of the Securities Exchange Act of 1934 and Section 27A of the Securities Act of 1933. Forward looking statements reflect the Company's current expectations and projections about future events at the time, and thus involve uncertainty and risk. The words “believe,” “expect,” “anticipate,” “will,” “could,” “would,” “should,” “may,” “plan,” “estimate,” “intend,” “predict,” “potential,” “continue,” and the negatives of these words and other similar expressions generally identify forward looking statements. It is possible the Company's future financial performance may differ from expectations due to a variety of factors including, but not limited to the following: (1) foreign currency fluctuations relative to the U.S. dollar, specifically the Euro, Brazilian real and Australian dollar, (2) changes in capital availability or cost, including interest rate fluctuations and the ability of the Company to refinance debt at favorable terms, (3) the general political, economic and competitive conditions in markets and countries where the Company has operations, including uncertainties related to the economic conditions in Australia, Europe and South America disruptions in capital markets, disruptions in the supply chain, competitive pricing pressures, inflation or deflation, and changes in tax rates and laws, (4) consumer preferences for alternative forms of packaging, (5) cost and availability of raw materials, labor, energy and transportation, (6) the Company’s ability to manage its cost structure, including its success in implementing restructuring plans and achieving cost savings, (7) consolidation among competitors and customers, (8) the ability of the Company to acquire businesses and expand plants, integrate operations of acquired businesses and achieve expected synergies, (9) unanticipated expenditures with respect to environmental, safety and health laws, (10) the Company’s ability to further develop its sales, marketing and product development capabilities, and (11) the timing and occurrence of events which are beyond the control of the Company, including any expropriation of the Company’s operations, floods and other natural disasters, events related to asbestos-related claims, and the other risk factors discussed in the Company’s Annual Report on Form 10-K for the year ended December 31, 2012 and any subsequently filed Quarterly Report on Form 10-Q. It is not possible to foresee or identify all such factors. Any forward looking statements in this document are based on certain assumptions and analyses made by the Company in light of its experience and perception of historical trends, current conditions, expected future developments, and other factors it believes are appropriate in the circumstances. Forward looking statements are not a guarantee of future performance and actual results or developments may differ materially from expectations. While the Company continually reviews trends and uncertainties affecting the Company's results of operations and financial condition, the Company does not assume any obligation to update or supplement any particular forward looking statements contained in this document. Presentation Note Unless otherwise noted, the information presented in this presentation reflects continuing operations only. 1 |
|
|
Third Quarter 2013 Summary 2 Adjusted EPS of $0.79 14% increase over prior year Price/Mix increase of ~2% Shipments up > 2% Global wine volume gains led by Europe Strong beer sales in mature markets, flat globally Rising profitability in EU and NA driven by volume growth and cost savings SA profits contract on weaker demand and Fx Cash flow on track Net debt to EBITDA ratio of 2.9x Debt pay down of $168M in the quarter |
|
|
Regional Performance: EU and NA 3 Volume in tonnes up ~7% Led by wine gains Catch-up in beer and food Fx boosts top line by ~5% Production volume higher Asset optimization and cost saving programs improve margins North America ($ Millions, except margin) 3Q 2013 3Q 2012 Net Sales $733 $652 Segment Operating Profit $97 $74 Segment Margin 13.2% 11.3% ($ Millions, except margin) 3Q 2013 3Q 2012 Net Sales $529 $513 Segment Operating Profit $87 $75 Segment Margin 16.4% 14.6% Europe Shipments up ~1% Gains in NAB, spirits and wine Modest uptick in beer Production volume flat Cost savings drive margin expansion |

|
|
Regional Performance: SA and AP 4 Shipments down ~9% Macroeconomic slowdown General strikes in Colombia temporarily idle plant Fx negatively impacts earnings Asia Pacific ($ Millions, except margin) 3Q 2013 3Q 2012 Net Sales - Fx neutral1 $282 $310 $323 Segment Operating Profit $42 $69 Segment Margin 14.9% 21.4% ($ Millions, except margin) 3Q 2013 3Q 2012 Net Sales - Fx neutral1 $236 $258 $254 Segment Operating Profit $33 $27 Segment Margin 14.0% 10.6% South America Volume in tonnes up ~1% AU/NZ down ~1% Double digit growth in SE Asia Australian dollar headwind 1 Using 2012 currency exchange rates |
|
|
Financial Review 5 P&L Recap Volume gains in all regions except SA Increased fixed cost absorption on higher production in EU Cost savings, particularly in EU and NA Fx headwinds Balance Sheet Recap Debt repayment of $168M Share repurchases of $10M 1 Reportable segment sales exclude the Company’s global equipment business. Reportable Segments Operating Adjusted Sales (1) Profit Net Income ($ Millions) ($ Millions) (Non-GAAP EPS) 3Q12 $1,742 $245 $0.69 Price/Mix 28 28 0.13 Cost Inflation (33) (0.15) Spread (5) (0.02) Sales volume 27 9 0.04 Manufacturing and delivery 10 0.04 Operating and other costs 5 0.02 Currency translation (17) (5) (0.02) Operational 38 14 0.06 Retained corporate costs - Net interest expense 0.02 Noncontrolling interests - Effective tax rate 0.02 Non-operational 0.04 Total EPS reconciling items 0.10 3Q13 $1,780 $259 $0.79 |
|
|
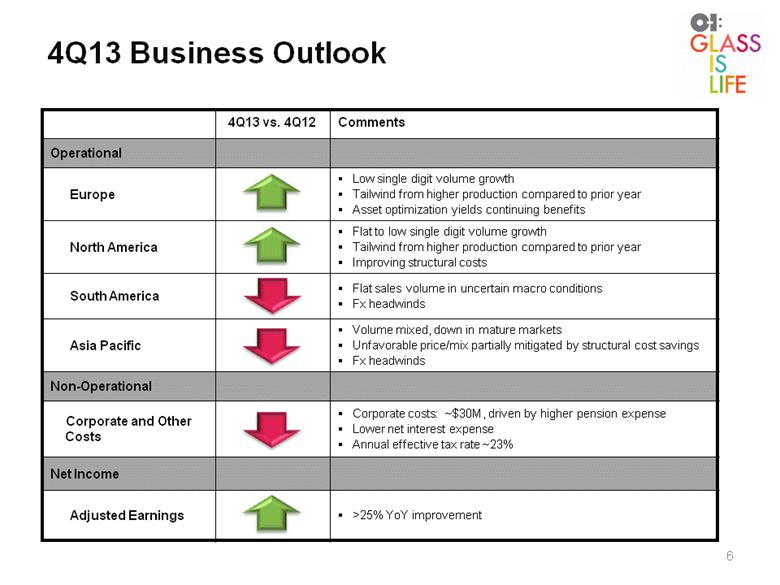
4Q13 Business Outlook 6 4Q13 vs. 4Q12 Comments Operational Europe Low single digit volume growth Tailwind from higher production compared to prior year Asset optimization yields continuing benefits North America Flat to low single digit volume growth Tailwind from higher production compared to prior year Improving structural costs South America Flat sales volume in uncertain macro conditions Fx headwinds Asia Pacific Volume mixed, down in mature markets Unfavorable price/mix partially mitigated by structural cost savings Fx headwinds Non-Operational Corporate and Other Costs Corporate costs: ~$30M, driven by higher pension expense Lower net interest expense Annual effective tax rate ~23% Net Income Adjusted Earnings >25% YoY improvement |
|
|
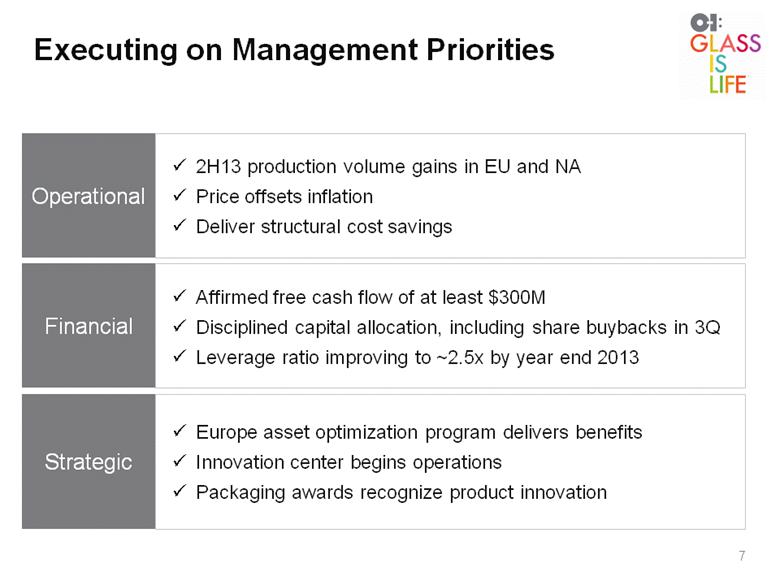
Executing on Management Priorities Europe asset optimization program delivers benefits Innovation center begins operations Packaging awards recognize product innovation Strategic Affirmed free cash flow of at least $300M Disciplined capital allocation, including share buybacks in 3Q Leverage ratio improving to ~2.5x by year end 2013 Financial 2H13 production volume gains in EU and NA Price offsets inflation Deliver structural cost savings Operational 7 |
|
|
Q&A 8 |

|
|
Appendix 9 |
|
|
Reconciliation of GAAP to Non-GAAP Items 10 Three months ended September 30 Nine months ended September 30 $ Millions, except per-share amts 2013 2012 2013 2012 Earnings EPS Earnings EPS Earnings EPS Earnings EPS Earnings from continuing operations $ 132 $ 0.79 $ 92 $ 0.55 $ 346 $ 2.08 $ 348 $ 2.10 attributable to the Company Items that management considers not representative of ongoing operations consistent with Segment Operating Profit Restructuring, asset impairment and related charges - - 23 0.14 9 0.05 23 0.14 Charges for note repurchase premiums and write-off of finance fees - - - - 11 0.07 - - Adjusted net earnings $ 132 $ 0.79 $ 115 $ 0.69 $ 366 $ 2.20 $ 371 $ 2.24 Diluted shares outstanding (millions) 166.0 165.8 165.7 166.0 |
|
|
Segment Operating Margin 11 (1) Segment operating profit margin is segment operating profit divided by segment net sales $ Millions (except profit margin) Net Sales: 2013 2012 2013 2012 Europe 733 $ 652 $ 2,129 $ 2,088 $ North America 529 513 1,525 1,511 South America 282 323 820 882 Asia Pacific 236 254 714 741 Segment Operating Profit: Europe 97 $ 74 $ 267 289 North America 87 75 254 249 South America 42 69 132 154 Asia Pacific 33 27 99 79 Segment Operating Profit Margin (1) Europe 13.2% 11.3% 12.5% 13.8% North America 16.4% 14.6% 16.7% 16.5% South America 14.9% 21.4% 16.1% 17.5% Asia Pacific 14.0% 10.6% 13.9% 10.7% Three months ended September 30, Nine months ended September 30, |
|
|
Free Cash Flow 12 (1) Free Cash Flow equals cash provided by continuing operating activities less additions to property, plant and equipment. $ Millions 2013 2012 2013 2012 Net earnings 136 $ 97 $ 347 $ 359 $ Plus: Loss from discontinued ops 2 2 15 4 Earnings from continuing operations 138 99 362 363 Non-cash charges: Depreciation and amortization 106 113 321 336 Restructuring, asset impairment and related charges - 33 10 33 Pension expense 25 25 77 69 All other non-cash charges 42 (8) 76 23 Payments and other reconciling items: Asbestos-related payments (59) (28) (108) (86) Cash paid for restructuring activities (7) (7) (54) (47) Pension contributions (6) (37) (23) (76) Change in components of working capital 42 55 (309) (325) Change in non-current assets and liabilities (54) (20) (103) (59) Cash utilized in continuing operating activities 227 225 249 231 Additions to PP&E for continuing operations (75) (54) (239) (178) Free Cash Flow (1) 152 $ 171 $ 10 $ 53 $ Three months ended September 30 Nine months ended September 30 |
|
|
Reconciliation of Credit Agreement EBITDA 13 $ Millions 9/30/2013 6/30/2013 3/31/2013 12/31/2012 9/30/2012 Earnings (loss) from continuing operations 219 $ 180 $ 178 $ 220 $ (406) $ Interest expense 245 250 255 248 255 Provision for income taxes 105 93 97 108 113 Depreciation 355 367 371 378 384 Amortization of intangibles 42 37 35 34 29 EBITDA 966 927 936 988 375 Adjustments in accordance with the Company's bank credit agreement: Asia Pacific goodwill adjustment - - - - 641 Charges for asbestos-related costs 155 155 155 155 150 Restructuring and asset impairment 145 178 178 167 104 Gain on China land compensation (61) (61) (61) (61) 0 Credit Agreement EBITDA 1,205 $ 1,199 $ 1,208 $ 1,249 $ 1,270 $ Total debt 3,664 3773 3897 3773 3893 Less cash 219 249 359 431 336 Net debt 3,445 3,524 3,538 3,342 3,557 Net debt divided by Credit Agreement EBITDA 2.9 2.9 2.9 2.7 2.8 Last 12 months ended |