Attached files
| file | filename |
|---|---|
| 8-K - FORM 8-K - NEUSTAR INC | form8-k.htm |
| EX-99.1 - EXHIBIT 99.1 - NEUSTAR INC | exhibit991.htm |
| EX-99.2 - EXHIBIT 99.2 - NEUSTAR INC | exhibit992.htm |
Earnings Report October 30, 2013 Neustar, Inc. Supplemental Information
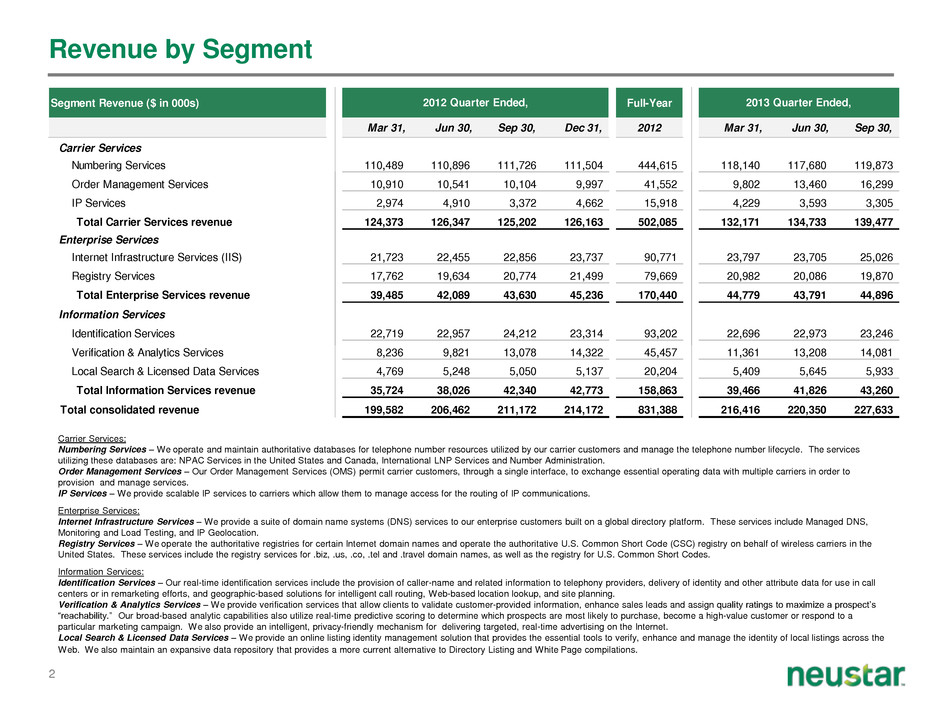
2 Revenue by Segment Carrier Services: Numbering Services – We operate and maintain authoritative databases for telephone number resources utilized by our carrier customers and manage the telephone number lifecycle. The services utilizing these databases are: NPAC Services in the United States and Canada, International LNP Services and Number Administration. Order Management Services – Our Order Management Services (OMS) permit carrier customers, through a single interface, to exchange essential operating data with multiple carriers in order to provision and manage services. IP Services – We provide scalable IP services to carriers which allow them to manage access for the routing of IP communications. Enterprise Services: Internet Infrastructure Services – We provide a suite of domain name systems (DNS) services to our enterprise customers built on a global directory platform. These services include Managed DNS, Monitoring and Load Testing, and IP Geolocation. Registry Services – We operate the authoritative registries for certain Internet domain names and operate the authoritative U.S. Common Short Code (CSC) registry on behalf of wireless carriers in the United States. These services include the registry services for .biz, .us, .co, .tel and .travel domain names, as well as the registry for U.S. Common Short Codes. Information Services: Identification Services – Our real-time identification services include the provision of caller-name and related information to telephony providers, delivery of identity and other attribute data for use in call centers or in remarketing efforts, and geographic-based solutions for intelligent call routing, Web-based location lookup, and site planning. Verification & Analytics Services – We provide verification services that allow clients to validate customer-provided information, enhance sales leads and assign quality ratings to maximize a prospect’s “reachability.” Our broad-based analytic capabilities also utilize real-time predictive scoring to determine which prospects are most likely to purchase, become a high-value customer or respond to a particular marketing campaign. We also provide an intelligent, privacy-friendly mechanism for delivering targeted, real-time advertising on the Internet. Local Search & Licensed Data Services – We provide an online listing identity management solution that provides the essential tools to verify, enhance and manage the identity of local listings across the Web. We also maintain an expansive data repository that provides a more current alternative to Directory Listing and White Page compilations. Segment Revenue ($ in 000s) Full-Year Mar 31, Jun 30, Sep 30, Dec 31, 2012 Mar 31, Jun 30, Sep 30, Carrier Services Numbering Services 110,489 110,896 111,726 111,504 444,615 118,140 117,680 119,873 Order Management Services 10,910 10,541 10,104 9,997 41,552 9,802 13,460 16,299 IP Services 2,974 4,910 3,372 4,662 15,918 4,229 3,593 3,305 Total Carrier Services revenue 124,373 126,347 125,202 126,163 502,085 132,171 134,733 139,477 Enterprise Services Internet Infrastructure Services (IIS) 21,723 22,455 22,856 23,737 90,771 23,797 23,705 25,026 Registry Services 17,762 19,634 20,774 21,499 79,669 20,982 20,086 19,870 Total Enterprise Services revenue 39,485 42,089 43,630 45,236 170,440 44,779 43,791 44,896 Information Services Identification Services 22,719 22,957 24,212 23,314 93,202 22,696 22,973 23,246 Verification & Analytics Services 8,236 9,821 13,078 14,322 45,457 11,361 13,208 14,081 Local Search & Licensed Data Services 4,769 5,248 5,050 5,137 20,204 5,409 5,645 5,933 Total Information Services revenue 35,724 38,026 42,340 42,773 158,863 39,466 41,826 43,260 Total consolidated revenue 199,582 206,462 211,172 214,172 831,388 216,416 220,350 227,633 2013 Quarter Ended,2012 Quarter Ended,
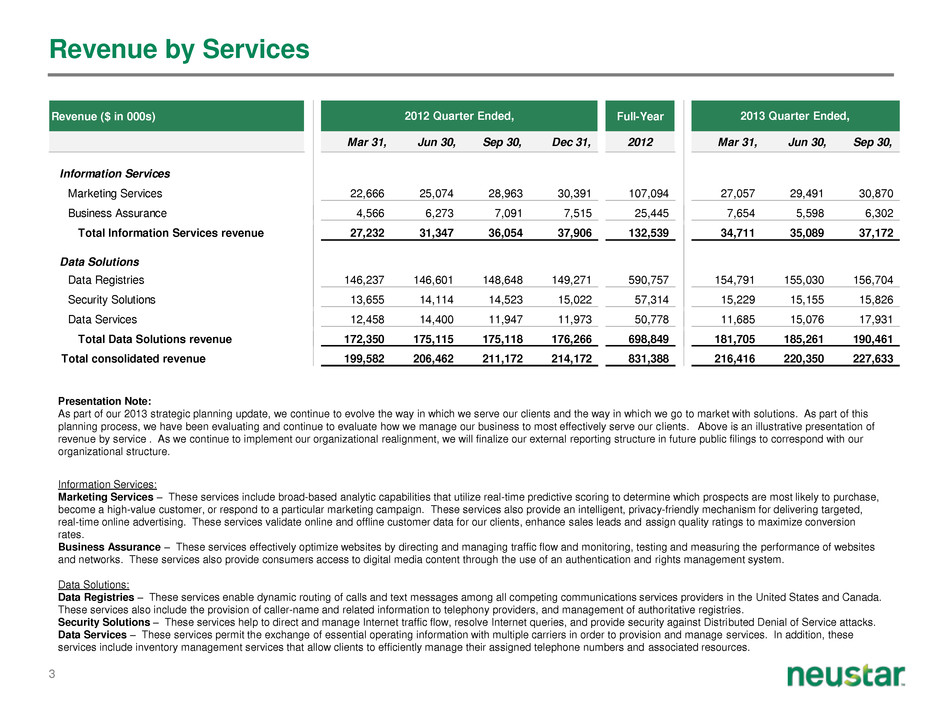
3 Revenue by Services Presentation Note: As part of our 2013 strategic planning update, we continue to evolve the way in which we serve our clients and the way in which we go to market with solutions. As part of this planning process, we have been evaluating and continue to evaluate how we manage our business to most effectively serve our clients. Above is an illustrative presentation of revenue by service . As we continue to implement our organizational realignment, we will finalize our external reporting structure in future public filings to correspond with our organizational structure. Information Services: Marketing Services – These services include broad-based analytic capabilities that utilize real-time predictive scoring to determine which prospects are most likely to purchase, become a high-value customer, or respond to a particular marketing campaign. These services also provide an intelligent, privacy-friendly mechanism for delivering targeted, real-time online advertising. These services validate online and offline customer data for our clients, enhance sales leads and assign quality ratings to maximize conversion rates. Business Assurance – These services effectively optimize websites by directing and managing traffic flow and monitoring, testing and measuring the performance of websites and networks. These services also provide consumers access to digital media content through the use of an authentication and rights management system. Data Solutions: Data Registries – These services enable dynamic routing of calls and text messages among all competing communications services providers in the United States and Canada. These services also include the provision of caller-name and related information to telephony providers, and management of authoritative registries. Security Solutions – These services help to direct and manage Internet traffic flow, resolve Internet queries, and provide security against Distributed Denial of Service attacks. Data Services – These services permit the exchange of essential operating information with multiple carriers in order to provision and manage services. In addition, these services include inventory management services that allow clients to efficiently manage their assigned telephone numbers and associated resources. Revenue ($ in 000s) Full-Year Mar 31, Jun 30, Sep 30, Dec 31, 2012 Mar 31, Jun 30, Sep 30, Information Services Marketing Services 22,666 25,074 28,963 30,391 107,094 27,057 29,491 30,870 Business Assurance 4,566 6,273 7,091 7,515 25,445 7,654 5,598 6,302 Total Information Services revenue 27,232 31,347 36,054 37,906 132,539 34,711 35,089 37,172 Data Solutions Data Registries 146,237 146,601 148,648 149,271 590,757 154,791 155,030 156,704 Security Solutions 13,655 14,114 14,523 15,022 57,314 15,229 15,155 15,826 Data Services 12,458 14,400 11,947 11,973 50,778 11,685 15,076 17,931 Total Data Solutions revenue 172,350 175,115 175,118 176,266 698,849 181,705 185,261 190,461 Total consolidated revenue 199,582 206,462 211,172 214,172 831,388 216,416 220,350 227,633 2013 Quarter Ended,2012 Quarter Ended,
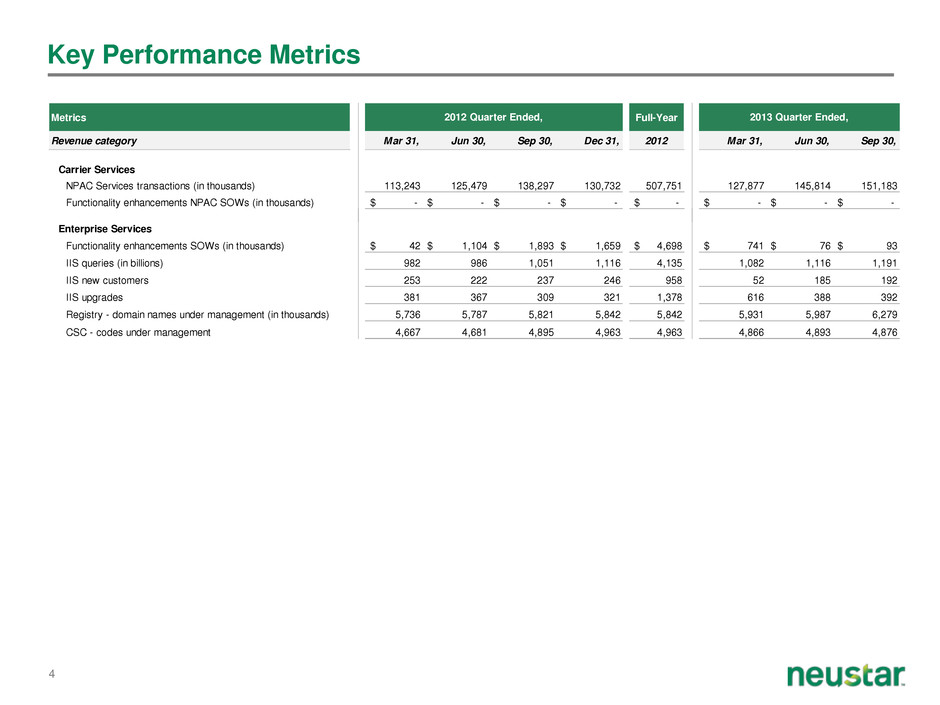
4 Key Performance Metrics Metrics Full-Year Revenue category Mar 31, Jun 30, Sep 30, Dec 31, 2012 Mar 31, Jun 30, Sep 30, Carrier Services NPAC Services transactions (in thousands) 113,243 125,479 138,297 130,732 507,751 127,877 145,814 151,183 Functionality enhancements NPAC SOWs (in thousands) - $ - $ - $ - $ - $ - $ - $ - $ Enterprise Services Functionality enhancements SOWs (in thousands) 42 $ 1,104 $ 1,893 $ 1,659 $ 4,698 $ 741 $ 76 $ 93 $ IIS queries (in billions) 982 986 1,051 1,116 4,135 1,082 1,116 1,191 IIS new customers 253 222 237 246 958 52 185 192 IIS upgrades 381 367 309 321 1,378 616 388 392 Registry - domain names under management (in thousands) 5,736 5,787 5,821 5,842 5,842 5,931 5,987 6,279 CSC - codes under management 4,667 4,681 4,895 4,963 4,963 4,866 4,893 4,876 2012 Quarter Ended, 2013 Quarter Ended,
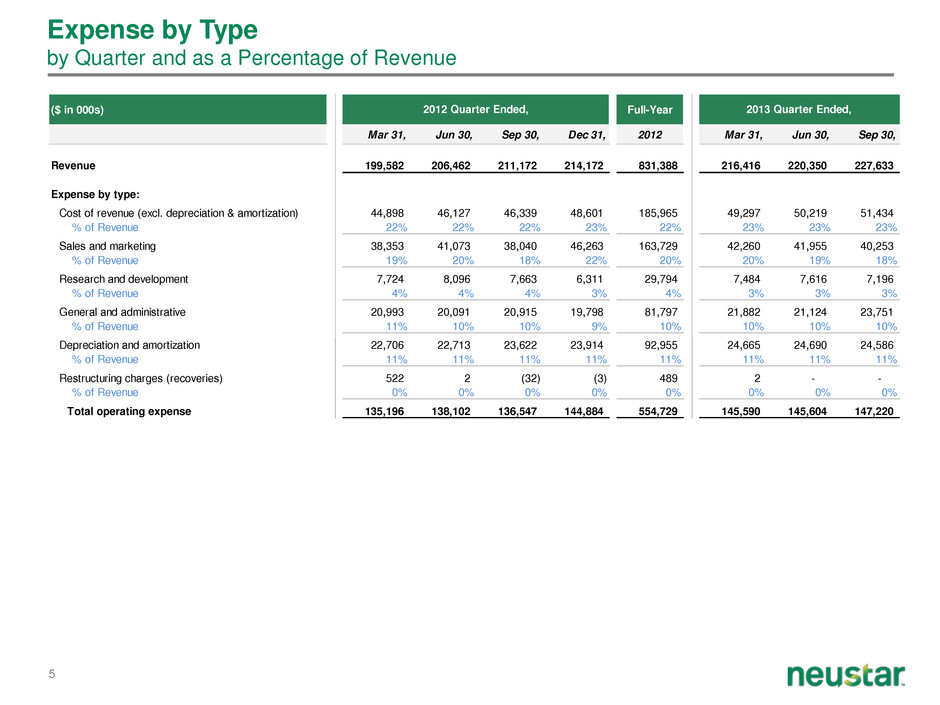
5 Expense by Type by Quarter and as a Percentage of Revenue ($ in 000s) Full-Year Mar 31, Jun 30, Sep 30, Dec 31, 2012 Mar 31, Jun 30, Sep 30, Revenue 199,582 206,462 211,172 214,172 831,388 216,416 220,350 227,633 Expense by type: Cost of revenue (excl. depreciation & amortization) 44,898 46,127 46,339 48,601 185,965 49,297 50,219 51,434 % of Revenue 22% 22% 22% 23% 22% 23% 23% 23% Sales and marketing 38,353 41,073 38,040 46,263 163,729 42,260 41,955 40,253 % of Revenue 19% 20% 18% 22% 20% 20% 19% 18% Research and development 7,724 8,096 7,663 6,311 29,794 7,484 7,616 7,196 % of Revenue 4% 4% 4% 3% 4% 3% 3% 3% General and administrative 20,993 20,091 20,915 19,798 81,797 21,882 21,124 23,751 % of Revenue 11% 10% 10% 9% 10% 10% 10% 10% Depreciation and amortization 22,706 22,713 23,622 23,914 92,955 24,665 24,690 24,586 % of Revenue 11% 11% 11% 11% 11% 11% 11% 11% Restructuring charges (recoveries) 522 2 (32) (3) 489 2 - - % of Revenue 0% 0% 0% 0% 0% 0% 0% 0% Total operating expense 135,196 138,102 136,547 144,884 554,729 145,590 145,604 147,220 2012 Quarter Ended, 2013 Quarter Ended,
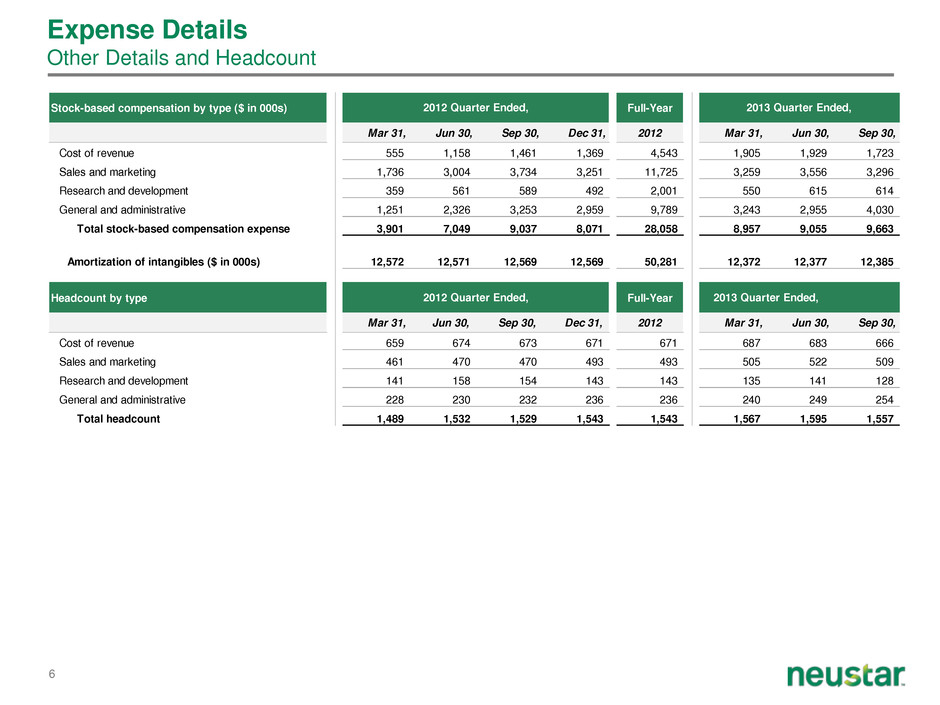
6 Expense Details Other Details and Headcount Stock-based compensation by type ($ in 000s) Full-Year Mar 31, Jun 30, Sep 30, Dec 31, 2012 Mar 31, Jun 30, Sep 30, Cost of revenue 555 1,158 1,461 1,369 4,543 1,905 1,929 1,723 Sales and marketing 1,736 3,004 3,734 3,251 11,725 3,259 3,556 3,296 Research and development 359 561 589 492 2,001 550 615 614 General and administrative 1,251 2,326 3,253 2,959 9,789 3,243 2,955 4,030 Total stock-based compensation expense 3,901 7,049 9,037 8,071 28,058 8,957 9,055 9,663 Amortization of intangibles ($ in 000s) 12,572 12,571 12,569 12,569 50,281 12,372 12,377 12,385 Headcount by type Full-Year Mar 31, Jun 30, Sep 30, Dec 31, 2012 Mar 31, Jun 30, Sep 30, Cost of revenue 659 674 673 671 671 687 683 666 Sales and marketing 461 470 470 493 493 505 522 509 Research and development 141 158 154 143 143 135 141 128 General and administrative 228 230 232 236 236 240 249 254 Total headcount 1,489 1,532 1,529 1,543 1,543 1,567 1,595 1,557 2013 Quarter Ended, 2013 Quarter Ended,2012 Quarter Ended, 2012 Quarter Ended,
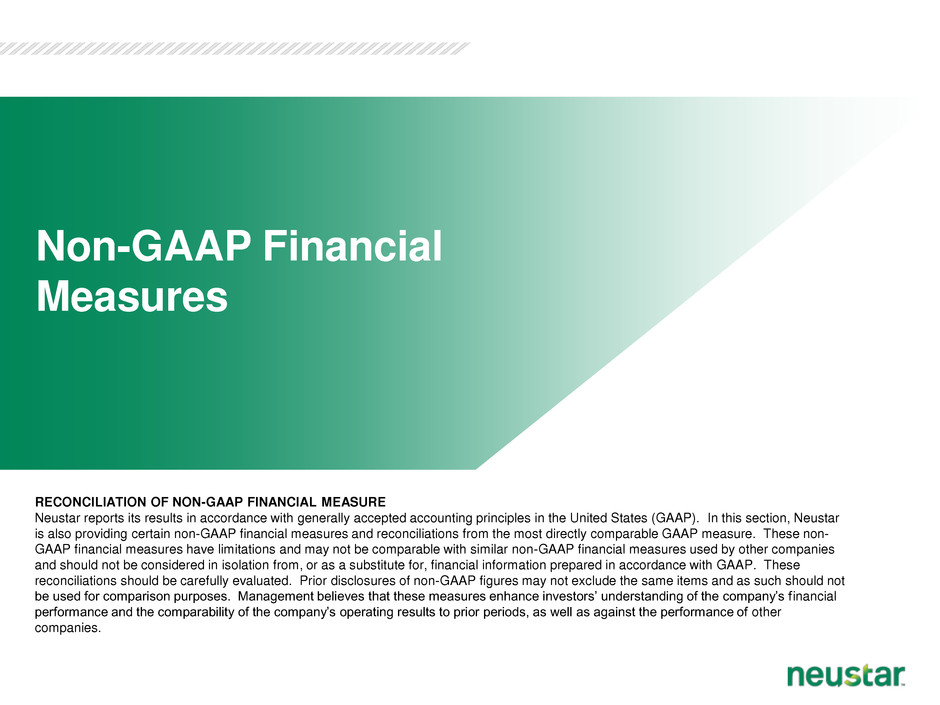
Non-GAAP Financial Measures RECONCILIATION OF NON-GAAP FINANCIAL MEASURE Neustar reports its results in accordance with generally accepted accounting principles in the United States (GAAP). In this section, Neustar is also providing certain non-GAAP financial measures and reconciliations from the most directly comparable GAAP measure. These non- GAAP financial measures have limitations and may not be comparable with similar non-GAAP financial measures used by other companies and should not be considered in isolation from, or as a substitute for, financial information prepared in accordance with GAAP. These reconciliations should be carefully evaluated. Prior disclosures of non-GAAP figures may not exclude the same items and as such should not be used for comparison purposes. Management believes that these measures enhance investors’ understanding of the company’s financial performance and the comparability of the company’s operating results to prior periods, as well as against the performance of other companies.
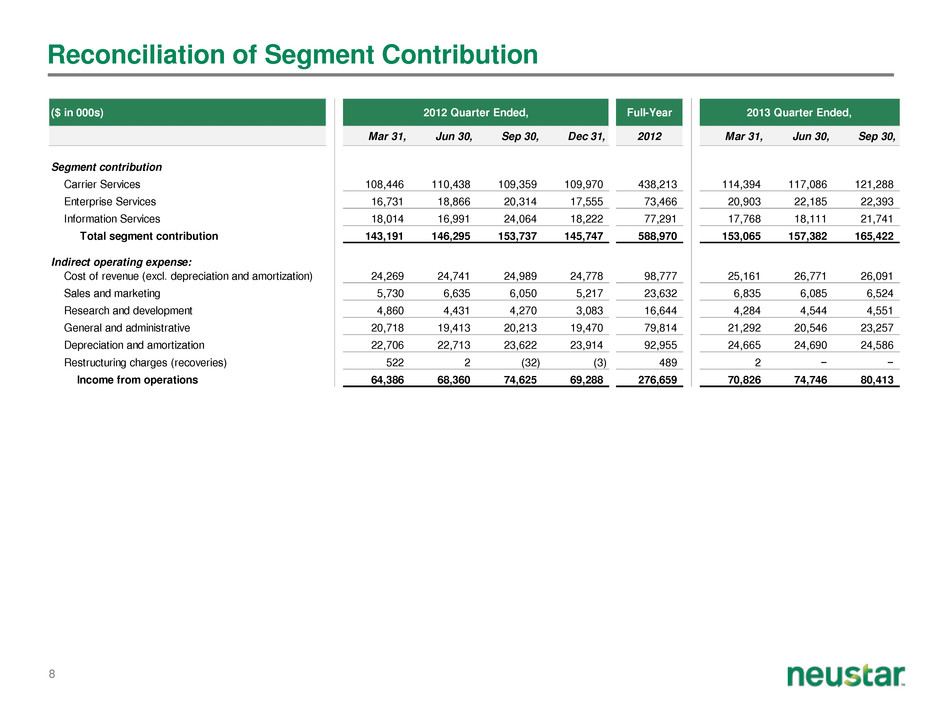
8 Reconciliation of Segment Contribution ($ in 000s) Full-Year Mar 31, Jun 30, Sep 30, Dec 31, 2012 Mar 31, Jun 30, Sep 30, Segment contribution – – Carrier Services 108,446 110,438 109,359 109,970 438,213 114,394 117,086 121,288 Enterprise Services 16,731 18,866 20,314 17,555 73,466 20,903 22,185 22,393 Information Services 18,014 16,991 24,064 18,222 77,291 17,768 18,111 21,741 Total segment contribution 143,191 146,295 153,737 145,747 588,970 153,065 157,382 165,422 Indirect operating expense: Cost of revenue (excl. depreciation and amortization) 24,269 24,741 24,989 24,778 98,777 25,161 26,771 26,091 Sales and marketing 5,730 6,635 6,050 5,217 23,632 6,835 6,085 6,524 Research and development 4,860 4,431 4,270 3,083 16,644 4,284 4,544 4,551 General and administrative 20,718 19,413 20,213 19,470 79,814 21,292 20,546 23,257 Depreciation and amortization 22,706 22,713 23,622 23,914 92,955 24,665 24,690 24,586 Restructuring charges (recoveries) 522 2 (32) (3) 489 2 − − Income from operations 64,386 68,360 74,625 69,288 276,659 70,826 74,746 80,413 2012 Quarter Ended, 2013 Quarter Ended,
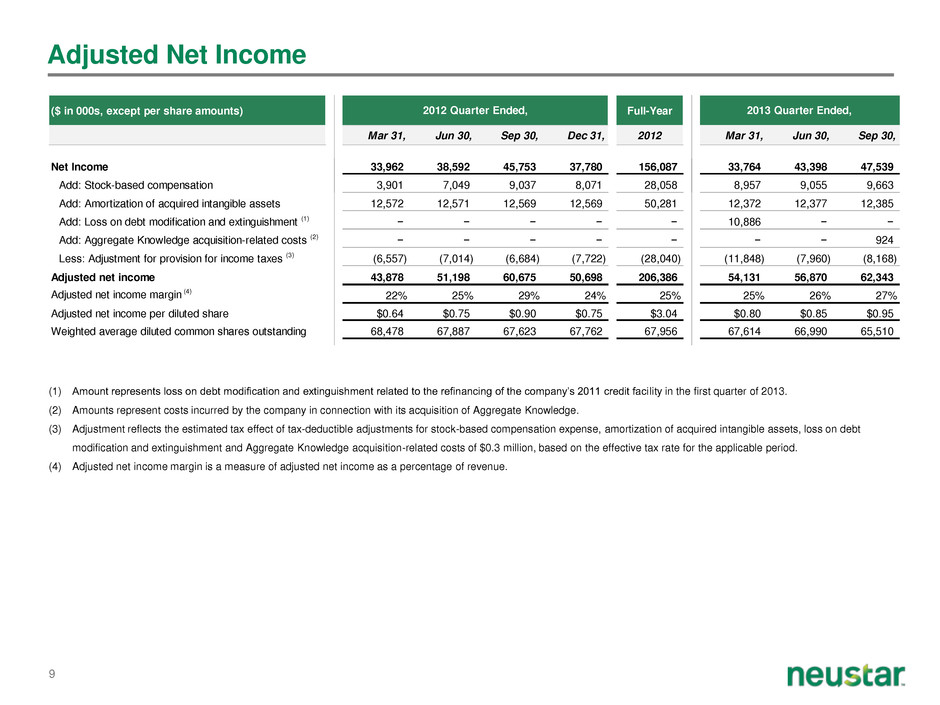
9 Adjusted Net Income (1) Amount represents loss on debt modification and extinguishment related to the refinancing of the company’s 2011 credit facility in the first quarter of 2013. (2) Amounts represent costs incurred by the company in connection with its acquisition of Aggregate Knowledge. (3) Adjustment reflects the estimated tax effect of tax-deductible adjustments for stock-based compensation expense, amortization of acquired intangible assets, loss on debt modification and extinguishment and Aggregate Knowledge acquisition-related costs of $0.3 million, based on the effective tax rate for the applicable period. (4) Adjusted net income margin is a measure of adjusted net income as a percentage of revenue. ($ in 000s, except per share amounts) Full-Year Mar 31, Jun 30, Sep 30, Dec 31, 2012 Mar 31, Jun 30, Sep 30, Net Income 33,962 38,592 45,753 37,780 156,087 33,764 43,398 47,539 Add: Stock-based compensation 3,901 7,049 9,037 8,071 28,058 8,957 9,055 9,663 Add: Amortization of acquired intangible assets 12,572 12,571 12,569 12,569 50,281 12,372 12,377 12,385 Add: Loss on debt modification and extinguishment (1) − − − − − 10,886 − − Add: Aggregate Knowledge acquisition-related costs (2) − − − − − − − 924 Less: Adjustment for provision for income taxes (3) (6,557) (7,014) (6,684) (7,722) (28,040) (11,848) (7,960) (8,168) Adjusted net income 43,878 51,198 60,675 50,698 206,386 54,131 56,870 62,343 Adjusted net income margin (4) 22% 25% 29% 24% 25% 25% 26% 27% Adjusted net income per diluted share $0.64 $0.75 $0.90 $0.75 $3.04 $0.80 $0.85 $0.95 Weighted average diluted common shares outstanding 68,478 67,887 67,623 67,762 67,956 67,614 66,990 65,510 2012 Quarter Ended, 2013 Quarter Ended,
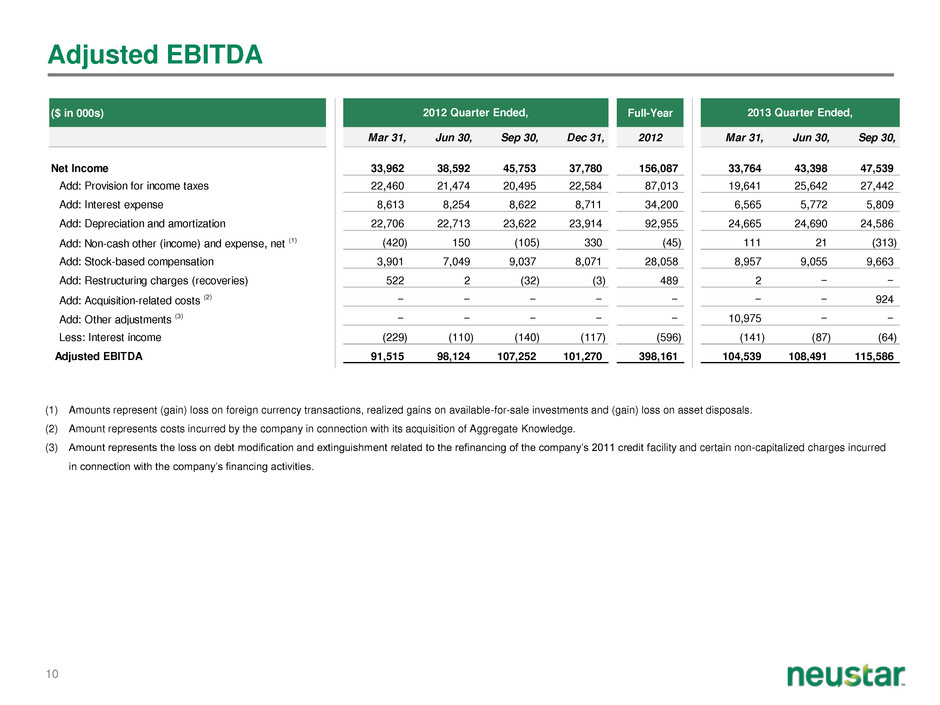
10 Adjusted EBITDA (1) Amounts represent (gain) loss on foreign currency transactions, realized gains on available-for-sale investments and (gain) loss on asset disposals. (2) Amount represents costs incurred by the company in connection with its acquisition of Aggregate Knowledge. (3) Amount represents the loss on debt modification and extinguishment related to the refinancing of the company’s 2011 credit facility and certain non-capitalized charges incurred in connection with the company’s financing activities. ($ in 000s) Full-Year Mar 31, Jun 30, Sep 30, Dec 31, 2012 Mar 31, Jun 30, Sep 30, Net Income 33,962 38,592 45,753 37,780 156,087 33,764 43,398 47,539 Add: Provision for income taxes 22,460 21,474 20,495 22,584 87,013 19,641 25,642 27,442 Add: Interest expense 8,613 8,254 8,622 8,711 34,200 6,565 5,772 5,809 Add: Depreciation and amortization 22,706 22,713 23,622 23,914 92,955 24,665 24,690 24,586 Add: Non-cash other (income) and expense, net (1) (420) 150 (105) 330 (45) 111 21 (313) Add: Stock-based compensation 3,901 7,049 9,037 8,071 28,058 8,957 9,055 9,663 Add: Restructuring charges (recoveries) 522 2 (32) (3) 489 2 − − Add: Acquisition-related costs (2) − − − − − − − 924 Add: Other adjustments (3) − − − − − 10,975 − − Less: Interest income (229) (110) (140) (117) (596) (141) (87) (64) Adjusted EBITDA 91,515 98,124 107,252 101,270 398,161 104,539 108,491 115,586 2012 Quarter Ended, 2013 Quarter Ended,
