Attached files
| file | filename |
|---|---|
| 8-K - 8-K - TEXAS CAPITAL BANCSHARES INC/TX | d616649d8k.htm |
| EX-99.1 - EX-99.1 - TEXAS CAPITAL BANCSHARES INC/TX | d616649dex991.htm |
 October 23, 2013
TCBI Q3 2013
Earnings
Exhibit 99.2 |
 Certain
matters
discussed
on
this
call
may
contain
forward-looking
statements,
which
are
subject
to
risks
and
uncertainties
and
are
based on Texas Capital’s current estimates or expectations of future events or
future results. Texas Capital is under no obligation, and expressly
disclaims such obligation, to update, alter or revise its forward-looking statements, whether as a result of new
information, future events or otherwise. A number of factors, many of which are
beyond Texas Capital’s control, could cause actual
results
to
differ
materially
from
future
results
expressed
or
implied
by
such
forward-looking
statements.
These
risks
and
uncertainties include the risk of adverse impacts from general economic conditions,
competition, interest rate sensitivity and exposure
to
regulatory
and
legislative
changes.
These
and
other
factors
that
could
cause
results
to
differ
materially
from
those
described in the forward-looking statements can be found in the prospectus
supplements, the Annual Report on Form 10-K and other filings made by
Texas Capital with the Securities and Exchange Commission (SEC).
2 |
 Opening Remarks
•
Strong
continued
core
earnings
growth,
with
provision
reflecting
another
quarter of significant growth in LHI
•
Continued improvement in NPAs
•
Continued strong growth in deposits, specifically DDAs
•
LHS levels down slightly as expected, with 2013 average to be
relatively flat as compared to 2012 average
3 |
 Financial Review
Net Income and EPS
–
Increase in net income of 47% compared to Q2-2013, 23% compared to
Q2-2013 before non-recurring FDIC charge and
Q2-2013 charge of $7.7 million –
Increase in EPS compared to Q2-2013
–
Decrease in EPS compared to Q3-2012 due to preferred dividend in
Q3-2013 Operating Leverage, Core Earnings Power & NIM
–
Net Revenue
•
6% increase from Q2-2013
•
11% growth from Q3-2012
–
Exceptional growth in LHI average balances
•
Growth of 8% from Q2-2013
•
Growth of 22% from Q3-2012
–
Margin improved 2 bps from Q2-2013 to 4.21%
•
Strong LHI levels with favorable spreads; yields up slightly in LHI
and LHS •
Improved funding profile from growth in DDA and total deposits
–
Provision for loan losses directly related to strong quarterly growth
in LHI of $540.7 million –
$3.0 million of FDIC assessment ($0.05 per share) included in
non-interest expense in Q3-13 •
Relates
to
year-end
2011
and
2012
call
reports
which
were
amended
for
the
change
in
risk
weight
applicable to our mortgage finance loans
•
Disputing the charge as we believe it is unwarranted given the
circumstances; any recovery would be credited to a future
quarter 4 |
 Financial Review
Loan Growth
–
Broad-based growth in LHI
•
Growth of $579.6 million, or 8%, from Q2-2013
•
Period end balance $319.4 million over average balance for the
quarter •
Averages increased 8% from Q2-2013 and 22% from Q3-2012
–
Average LHS balances down 2% from Q2-2013 and 3% from
Q3-2012 Funding
–
Funding profile optimal with exceptional DDA and total deposit
growth •
Average DDA increased 7% from Q2-2013 and 55% from
Q3-2012 •
Total average deposits increased 9% from Q2-2013 and 31% from
Q3-2012 –
Total deposit cost stable at 17 bps
Credit Costs
–
Total credit costs of $5.0 million for Q3-2013
–
Favorable trend in NPA ratio with $3.0 million (6%) decrease from
Q2-13, including 2% OREO reduction 5
•
Results remained well above industry trends in mortgage origination
and warehouse •
Provision of $5.0 million compared to $7.0 million in
Q2-2013 •
No OREO valuation cost in Q3-2013 compared to $382,000 in
Q2-2013 and $64,000 in Q3-2012 •
NCOs of $46,000 (0 bps) compared to $2.4 million (13 bps) in
Q2-2013 and 8 bps for Q3-2012 |
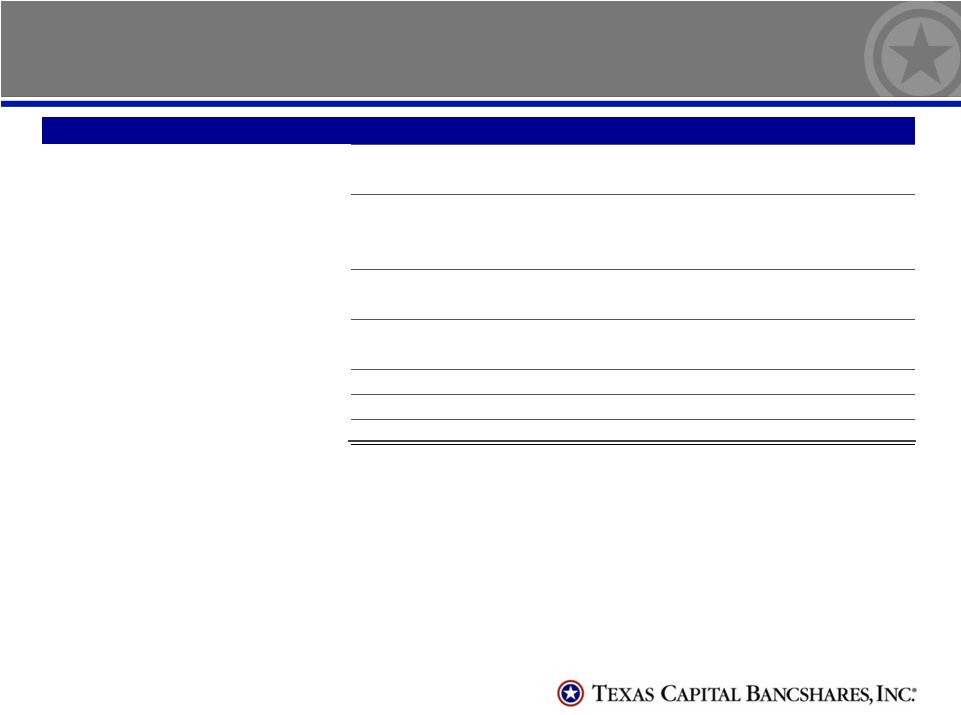 Income
Statement
-
Quarterly
6
Q3-13
Q2-13
Q1-13
Q4-12
Q3-12
Net interest income
$ 108,776
$ 101,220
$ 98,042
$ 101,155
$ 96,855
Non-interest income
10,431
11,128
11,281
12,836
10,552
Net revenue
119,207
112,348
109,323
113,991
107,407
Provision for credit losses
5,000
7,000
2,000
4,500
3,000
OREO valuation and write-down expense
-
382
71
955
64
Total provision and OREO valuation
5,000
7,382
2,071
5,455
3,064
Non-interest expense
62,009
68,352
55,629
59,119
53,457
Income before income taxes
52,198
36,614
51,623
49,417
50,886
Income tax expense
18,724
12,542
18,479
17,982
18,316
Net income
33,474
24,072
33,144
31,435
32,570
Preferred stock dividends
2,437
2,438
81
–
–
Net income available to common shareholders
$ 31,037
$ 21,634
$ 33,063
$ 31,435
$ 32,570
Diluted EPS
$ .74
$ .52
$ .80
$ .76
$ .80
Diluted EPS excluding charges
$ .79
$ .64
$ .80
$ .76
$ .80
Net interest margin
4.21%
4.19%
4.27%
4.27%
4.36%
ROA
1.25%
0.95%
1.38%
1.27%
1.40%
ROA excluding FDIC charge
1.32%
0.95%
1.38%
1.27%
1.40%
ROE
13.74%
9.94%
15.82%
15.35%
17.27%
ROE excluding FDIC charge
14.59%
9.94%
15.82%
15.35%
17.27%
Efficiency
(1)
52.0%
60.8%
50.9%
51.9%
49.8%
Efficiency excluding FDIC charge
(1)
49.2%
60.8%
50.9%
51.9%
49.8%
(1) Excludes OREO valuation charge
|
 QTD Average Balances, Yields and Rates
7
(in thousands)
Q3 2013
Q2 2013
Q3 2012
Avg. Bal.
Yield Rate
Avg. Bal.
Yield Rate
Avg. Bal.
Yield Rate
Assets
Securities
$ 71,717
4.25%
$ 78,906
4.42%
$110,300
4.43%
Fed funds sold & liquidity investments
167,613
.19%
145,625
.20%
74,219
.30%
Loans held for sale
2,362,118
3.79%
2,406,246
3.74%
2,432,027
4.00%
Loans held for investment
7,731,901
4.72%
7,152,323
4.71%
6,313,263
4.81%
Total loans, net of reserve
10,014,468
4.53%
9,483,563
4.50%
8,672,917
4.63%
Total earning assets
10,253,798
4.46%
9,708,094
4.44%
8,857,436
4.59%
Total assets
$10,637,766
$10,110,992
$9,256,864
Liabilities
and
Stockholders’
Equity
Total interest bearing deposits
$ 5,612,874
.26%
$ 5,130,200
.25%
$4,649,823
.29%
Other borrowings
539,767
.20%
727,158
.20%
1,639,953
.21%
Subordinated notes
111,000
6.54%
111,000
6.61%
12,065
6.86%
Long-term debt
113,406
2.23%
113,406
2.24%
113,406
2.43%
Total interest bearing liabilities
6,377,047
.40%
6,081,764
.40%
6,415,247
.32%
Demand deposits
3,124,602
2,914,341
2,010,694
Stockholders’
equity
1,046,477
1,023,279
750,113
Total
liabilities
and
stockholders’
equity
$10,637,766
.24%
$10,110,992
.24%
$9,256,864
.22%
Net interest margin
4.21%
4.19%
4.36% |
 Financial Summary
8
(in thousands)
QTD Averages
Q3 2013
Q2 2013
Q3 2012
Q3/Q2 %
Change
YOY %
Change
Total assets
$10,637,766
$10,110,992
$9,256,864
5%
15%
Loans held for investment
7,731,901
7,152,323
6,313,263
8%
22%
Loans held for sale
2,362,118
2,406,246
2,432,027
(2)%
(3)%
Total loans
10,094,019
9,558,569
8,745,290
6%
15%
Securities
71,717
78,906
110,300
(9)%
(35)%
Demand deposits
3,124,602
2,914,341
2,010,694
7%
55%
Total deposits
8,737,476
8,044,541
6,660,517
9%
31%
Stockholders’
equity
1,046,477
1,023,279
750,113
2%
40% |
 Financial Summary
9
(in thousands)
Period End
Q3 2013
Q2 2013
Q3 2012
Q3/Q2 %
Change
YOY %
Change
Total assets
$10,797,448
$10,977,990
$9,881,362
(2)%
9%
Loans held for investment
8,051,328
7,510,662
6,549,089
7%
23%
Loans held for sale
2,262,085
2,838,234
2,818,622
(20)%
(20)%
Total loans
10,313,413
10,348,896
9,367,711
(0)%
10%
Securities
67,815
75,861
107,288
(11)%
(37)%
Demand deposits
3,242,060
2,928,735
2,114,279
11%
53%
Total deposits
8,957,081
7,980,598
6,717,579
12%
33%
Stockholders’
equity
1,066,629
1,034,955
802,406
3%
33% |
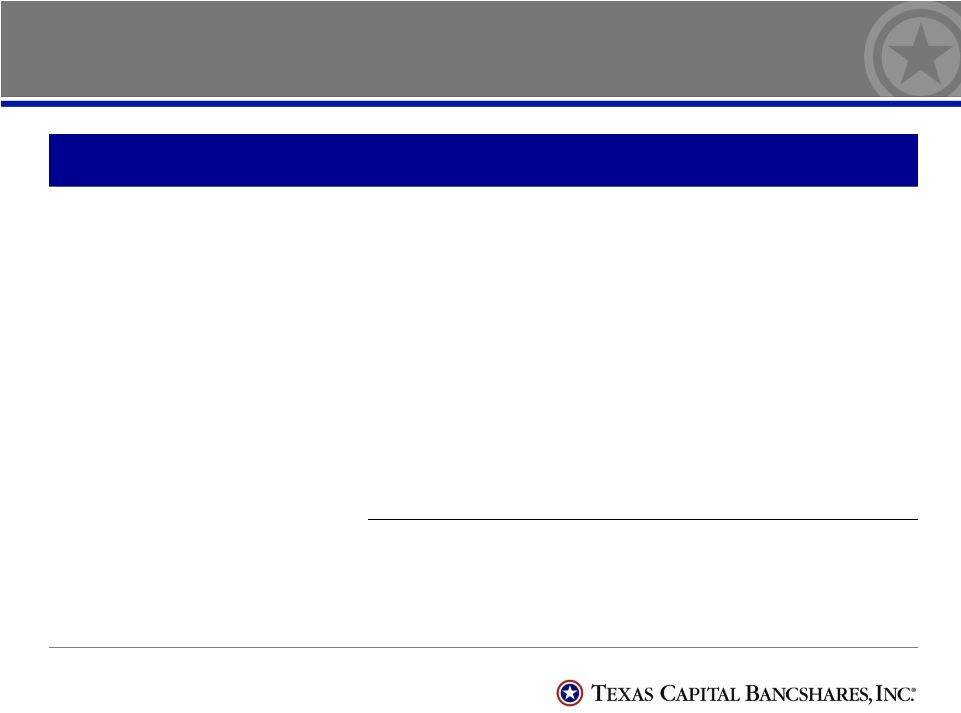
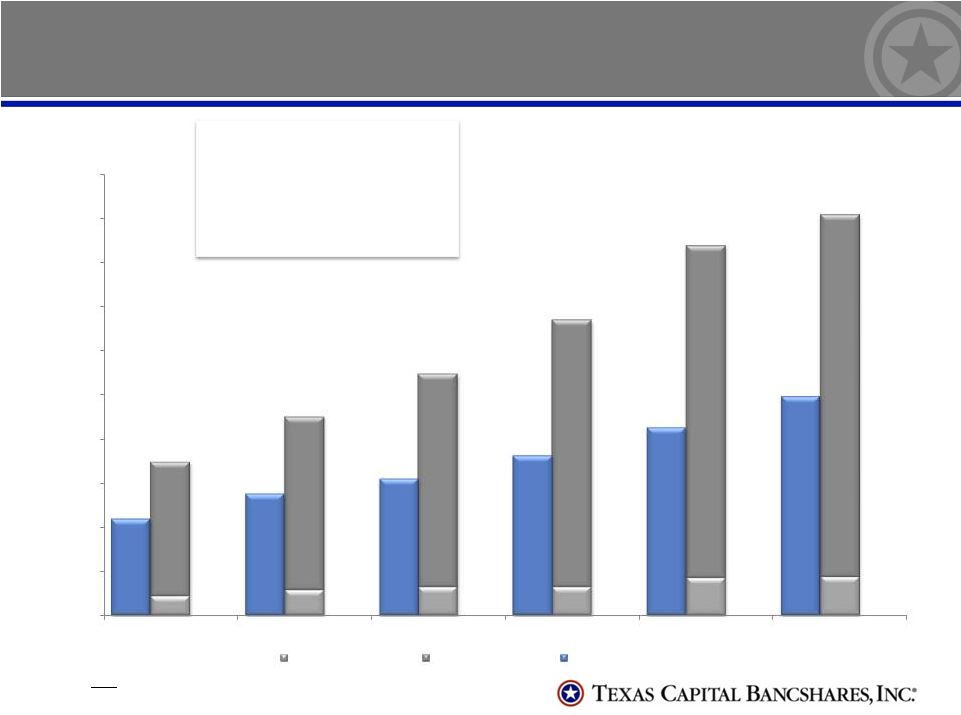 10
Revenue and Income Growth
($ in thousands)
$174,207
$225,951
$273,937
$335,169
$419,919
$454,504
109,651
137,733
154,985
181,403
212,961
247,948
0
50,000
100,000
150,000
200,000
250,000
300,000
350,000
400,000
450,000
500,000
2008
2009
2010
2011
2012
YTD Q3 2013
Non-interest Income
Net Interest Income
Non-interest Expense
Operating Revenue CAGR: 22%
Net Interest
Income CAGR:
23%
Non-interest Income CAGR: 15%
Non-interest Expense CAGR: 19%
Net Income CAGR: 40%
Excludes OREO valuation charge for YTD 2013, 2012, 2011 and 2010. YTD
Q3 2013 data is annualized. Note: |
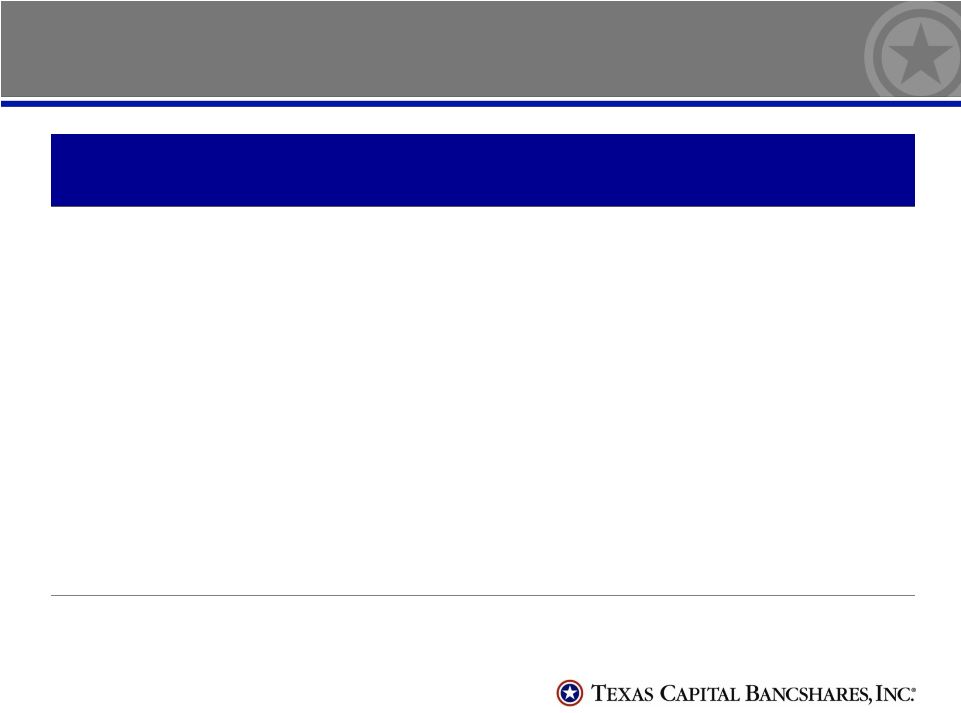
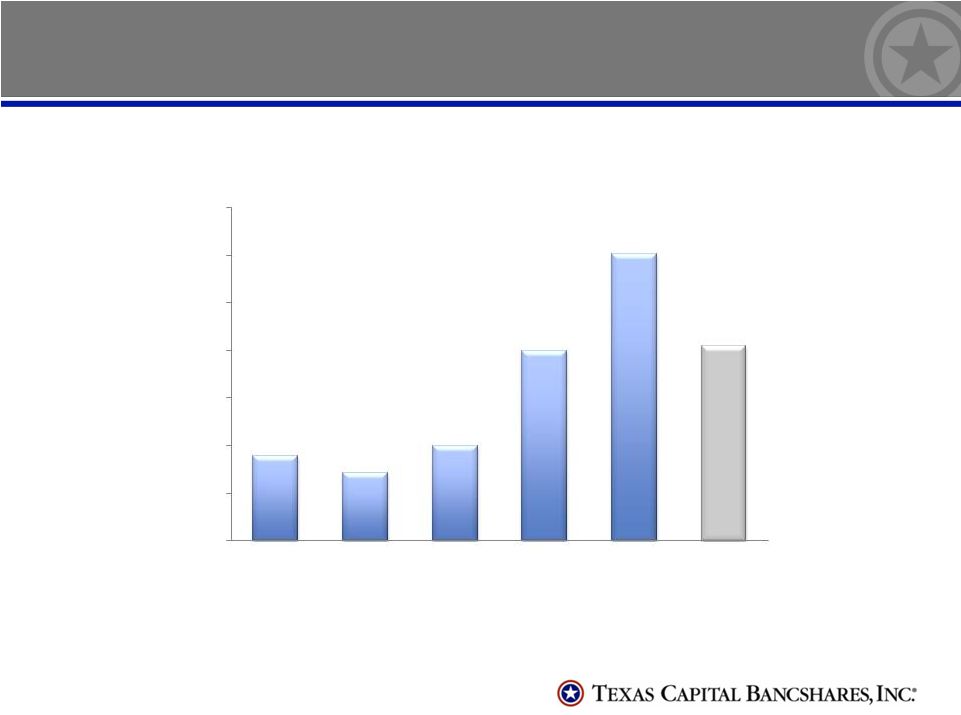 11
EPS Growth
2008
2009^
2010
2011
2012
5 Year EPS CAGR: 27%
Q3-2013
^Excludes $.15 effect of preferred TARP dividend during 2009. Reported
EPS was $0.56. $3.50
$3.00
$2.50
$2.00
$1.50
$1.00
$0.50
$0.00
$0.89
$0.71
$1.00
$1.99
3.01
$2.05 |
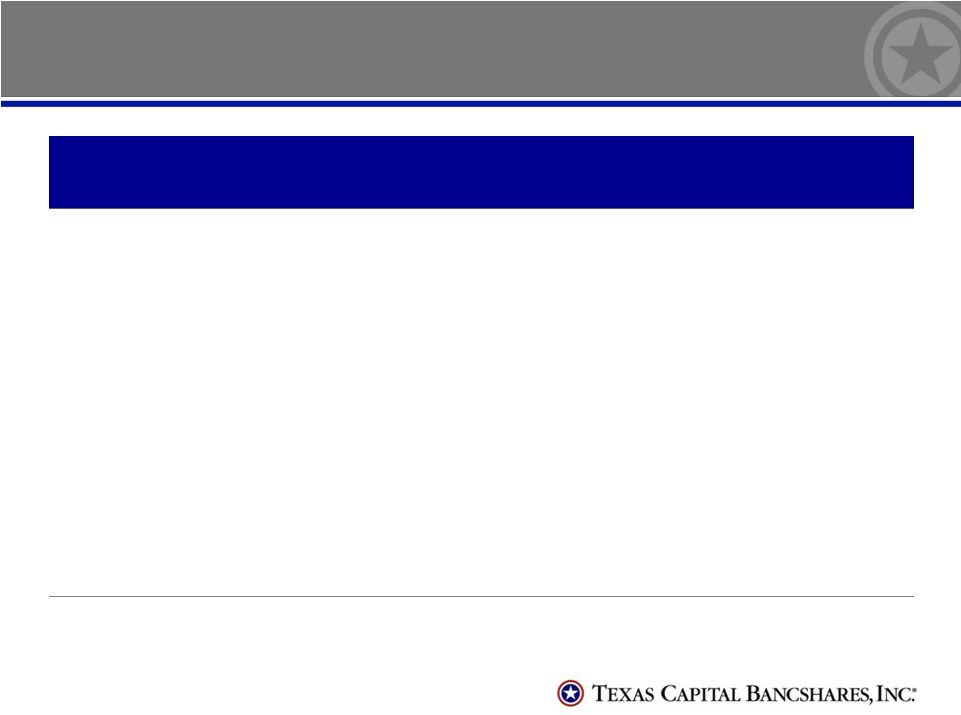
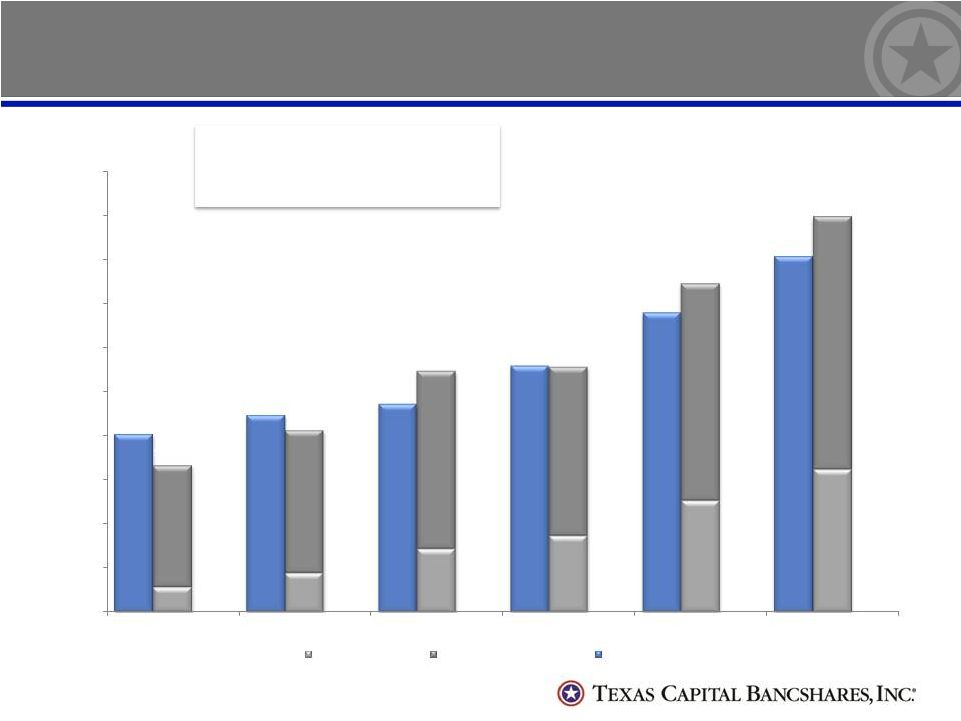 12
Deposit and Loan Growth
($ in millions)
Demand Deposit CAGR: 43%
Total Deposit CAGR: 23%
Loans Held for Investment CAGR: 16%
Demand Deposits
Intererst Bearing Deposits
Loans HFI
10,000
9,000
8,000
7,000
6,000
5,000
4,000
3,000
2,000
1,000
0
2008
2009
2010
2011
2012
2013
$4,028
$3,333
$4,457
$4,121
$4,711
$5,455
$5,572
$5,556
$6,786
$7,441
$8,051
$8,957 |
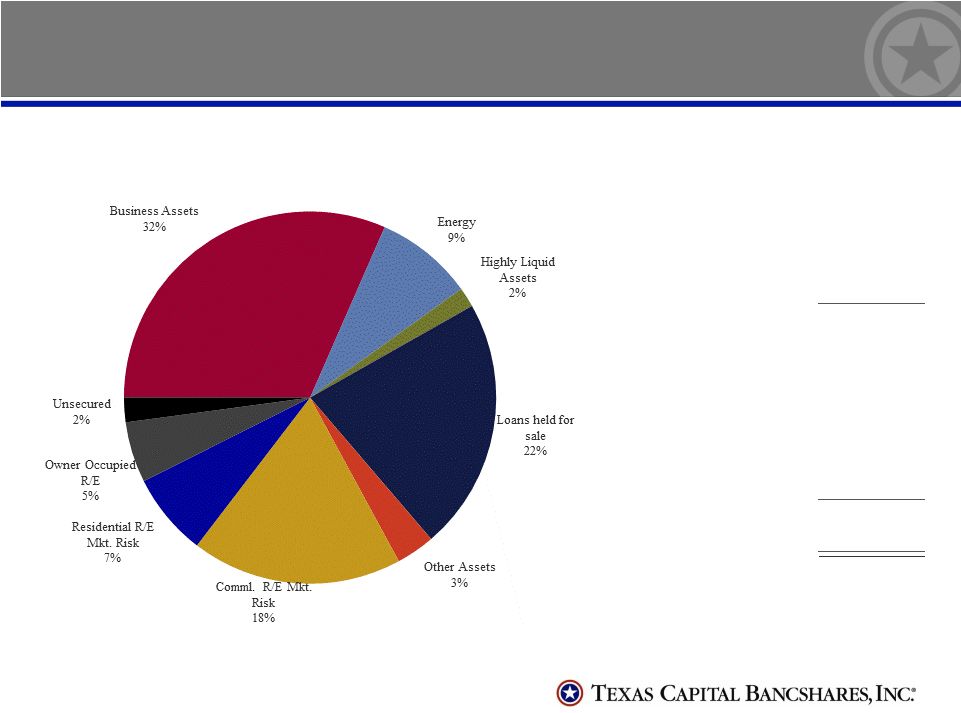 Loan Portfolio Statistics
13
Non-accrual loans
Commercial
$ 20,994
Construction
–
Real estate
14,616
Consumer
70
Equipment leases
57
Total non-accrual loans
35,737
Non-accrual loans as % of
loans held for investment
.44%
Non-accrual loans as % of
total loans
.35%
OREO
12,805
Total Non-accruals +
OREO
$ 48,542
Non-accrual loans + OREO
as % of loans held for
investment + OREO
.60%
Total Loans $10,313,413
All numbers in thousands.
Loan Collateral by Type 9/30/13 |
 Credit Quality
Improved Credit Trends
–
Total credit cost of $5.0 million for Q3-2013, compared to $ 7.4
million in Q2-2013 and $3.1 million in Q3-2012
•
Provision of $5.0 million for Q3-2013 compared to $7.0 million for
Q2-2013 and $3.0 million in Q3-2012
•
NCOs $46,000 (0 bps) in Q3-2013 compared to 13 bps in Q2-2013
and 8 bps in Q3-2012; NCO ratio of 7 bps for YTD
•
No OREO valuation charge in Q3-2013 compared to $382,000 in
Q2-2013 and $64,000 in Q3-2012
–
NPA ratio continues to decline
•
Reduction of $3.0 million (6%) from Q2-2013 and $27.8 million
(36%) from Q3-2012 •
NPA ratio of .60% compared to .68% in Q2-2013 and 1.16% in
Q3-2012 •
NPLs at $35.7 million, down $2.5 million from Q2-2013 and down
$21.5 million from Q3-2012
•
NPL ratio at .35% of total loans and .44% of LHI
•
OREO reduction of $248,000 (2%) from Q2-2013 and $6.3 million
(33%) from Q3-2012 14 |
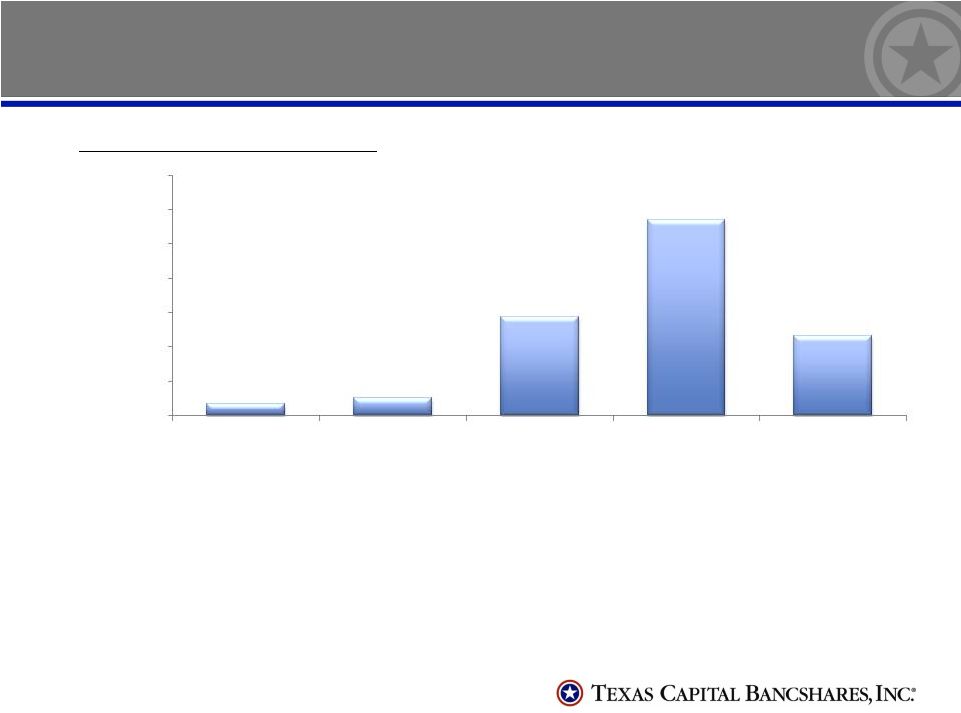 15
Credit Quality
Net Charge-offs / Average Loans
* Excludes loans held for sale.
Combined reserve /
Loans
*
1.10%
1.15%
1.31%
1.56%
1.59%
Non-accrual loans +
OREO to loans
*
+
OREO
.60%
1.06%
1.58%
3.25%
2.74%
Combined reserve to
non-accruals
2.4x
1.3x
1.3x
.6x
.7x
1.40%
1.20%
1.00%
0.80%
0.60%
0.40%
0.20%
0.00%
2013
2012
2011
2010
2009
0.07%
0.10%
0.58%
1.14%
0.46% |
 Closing Comments
•
Strong
core
earnings
power,
profitability
and
growth
to
continue
in
2013
•
Credit continues positive trend
•
Strong LHI pipeline and new commitments present opportunity for growth
potential
•
LHS average balances to remain in line with expectations for flat
year- over-year averages
16 |
 Q&A
17 |