Attached files
| file | filename |
|---|---|
| 8-K - FORM 8-K - UNITED SURGICAL PARTNERS INTERNATIONAL INC | d605488d8k.htm |
 September 2013
Exhibit 99.1 |
 2
SAFE HARBOR STATEMENT
This presentation contains forward-looking statements,
including those regarding United Surgical Partners
International, Inc. and the services it provides. Investors
are cautioned not to place an undue reliance on these
forward-looking statements, which will speak only as of
the date of this presentation. United Surgical Partners
International, Inc. undertakes no obligation to publicly
revise these forward-looking statements. |
 3
NON-GAAP MEASUREMENT
We
use
the
non-GAAP
financial
measurement
term
“EBITDA.”
EBITDA
is
calculated as operating income plus net gain (loss) on deconsolidations, disposals,
impairments
and
depreciation
and
amortization.
USPI
uses
EBITDA
and
EBITDA
less noncontrolling interests as analytical indicators for purposes of allocating
resources
and
assessing
performance.
EBITDA
is
commonly
used
as
an
analytical
indicator within the health care industry and also serves as a measure of leverage
capacity and debt service ability. EBITDA should not be considered as a
measure of financial performance under generally accepted accounting
principles, and the items excluded from EBITDA could be significant
components in understanding and assessing financial performance.
Because EBITDA is not a measurement determined in accordance with
generally
accepted
accounting
principles
and
is
thus
susceptible
to
varying
calculation methods, EBITDA as presented by USPI may not be comparable to
similarly titled measures of other companies. |
 4
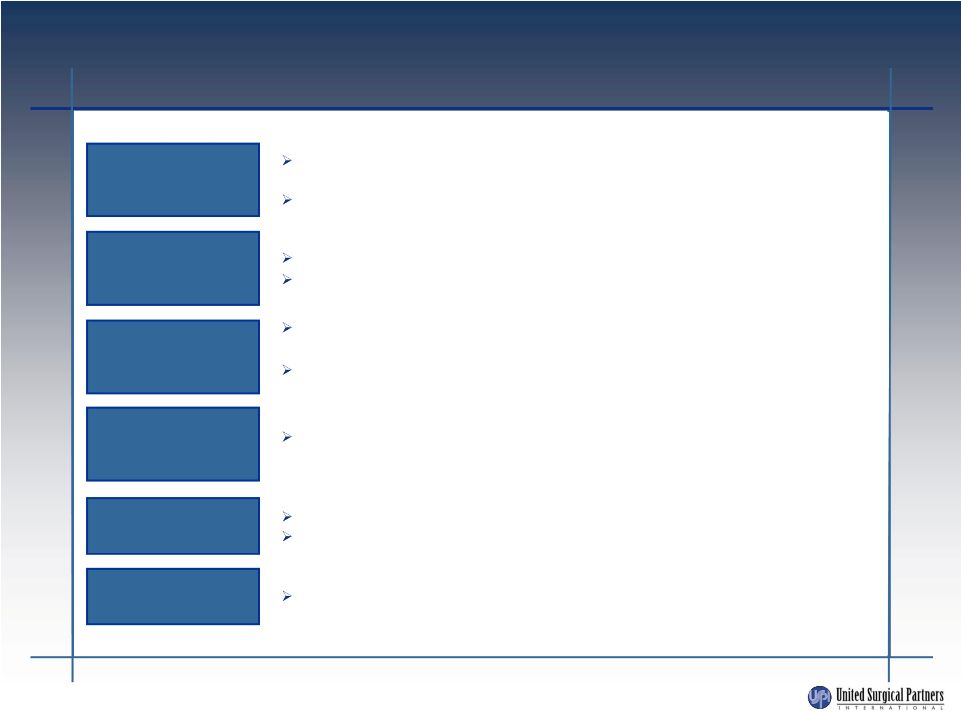
$2.3+bn of revenues under management from 214 facilities performing 900,000+ cases
by 9,000+ physician utilizers
High quality, low cost provider of surgical services
Leading operator
in an attractive
industry segment
Proven management
team
Attractive business
and payor mix
KEY HIGHLIGHTS
High margin, elective procedures with over half of revenue from orthopedic
specialties 78%
private
insurance;
operating
discipline
yields
bad
debt
expense
of
~2%
of
revenues
Two-thirds of our facilities are owned in a partnership with prominent
not-for-profit healthcare systems
Provides long-term strategic stability in the market place with strong brand
reputation and stability
Working with existing partners (physicians and hospitals) to grow market share and
enhance strategic positioning
Adjusted
EBITDA
1
CAGR
of
13%
from
2006
to
2012
Cumulative
Free
Cash
Flow
2
of
$330
million
from
2009
to
2012
Majority of USPI’s senior management has been with the Company over 10
years Consistent financial
performance
Focused on key
strategic markets with
significant share
Unique JV
partnership
strategy
1
Consolidated Adjusted EBITDA less noncontrolling interest
2
Consolidated FCF calculated as adjusted EBITDA less capital expenditures, cash
interest, cash taxes and change in working capital (defined as increases
(decreases) in cash from changes in operating assets and liabilities, net effects from purchases of new businesses) |
 5
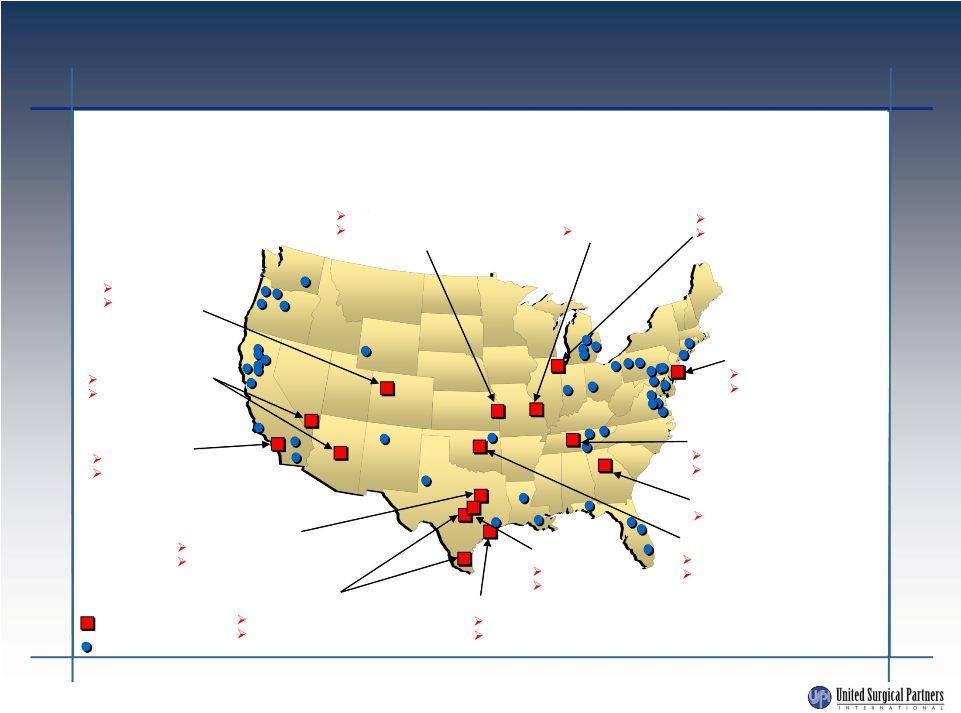
KEY MARKETS
Major Market
Facilities
USPI operates 214 facilities in 26 states
Denver
6 facilities
Centura Health
Partnership
Phoenix/Las Vegas
14 facilities
Dignity Health
Partnership
Los Angeles
6 facilities
Dignity Health
Partnership
Dallas/Ft. Worth
32 facilities
Baylor Health Care
System Partnership
San Antonio/Corpus Christi
5 facilities
CHRISTUS Health Partnership
Houston
20 facilities
Memorial Hermann Partnership
Austin
5 facilities
Seton Partnership
Oklahoma City
2 facilities
INTEGRIS Health Partnership
Atlanta
6 facilities
Nashville
15 facilities
St. Thomas Partnership
New Jersey
14 facilities
Meridian Health
Partnership
Chicago
4 facilities
NorthShore University
HealthSystem, Adventist
Partnership
St. Louis
18 facilities
Kansas City
5 facilities
North Kansas City Hospital
Ascension Partnership |
 6
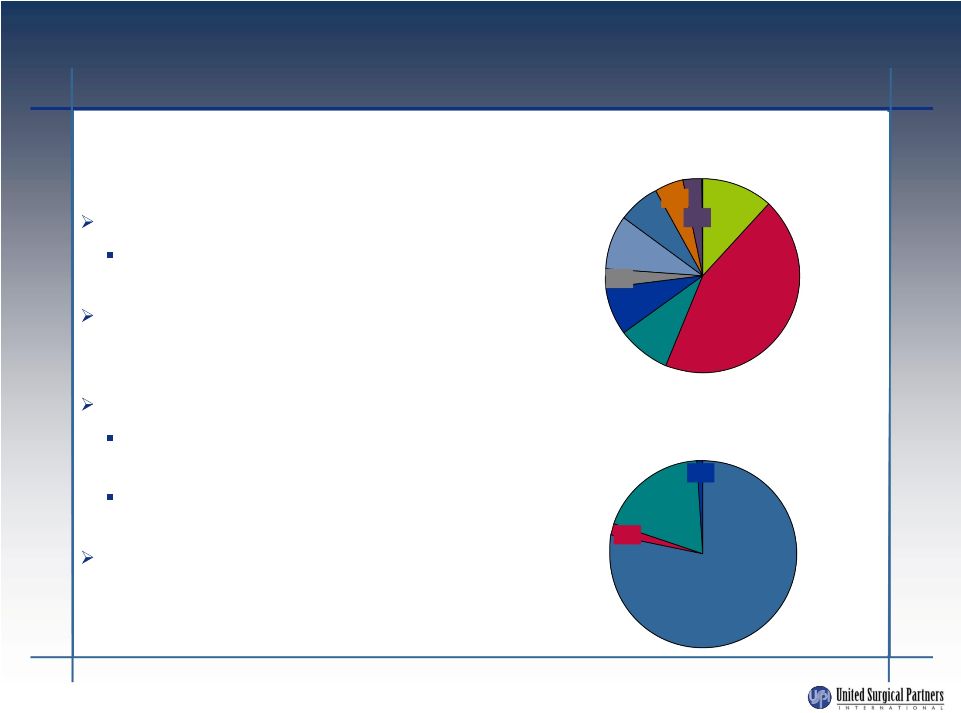
FAVORABLE REVENUE AND PAYOR
MIX
High margin, elective procedures
56% of revenue mix from orthopedic
and pain management
Diversification of specialties insulates USPI
from negative utilization and specialty pricing
changes
78% private insurance
Insurance companies favor low cost
providers
Modest exposure to government
reimbursement fluctuations
Reliable payors and operating discipline
yields bad debt expense of ~2% of revenues
and receivable days outstanding is under 35
Low risk cash flows from high margin
specialties and reliable payors:
2012 U.S. Revenue Mix
2012 U.S. Payor Mix
ENT
General
Gynecology
Pain Mgmt
Orthopedic
Medical/Other
Ophthalmology
Cosmetic
GI
Private Insurance
Self-pay
Government
Other
12%
3%
5%
3%
1%
2%
7%
9%
8%
9%
44%
19%
78% |
 7
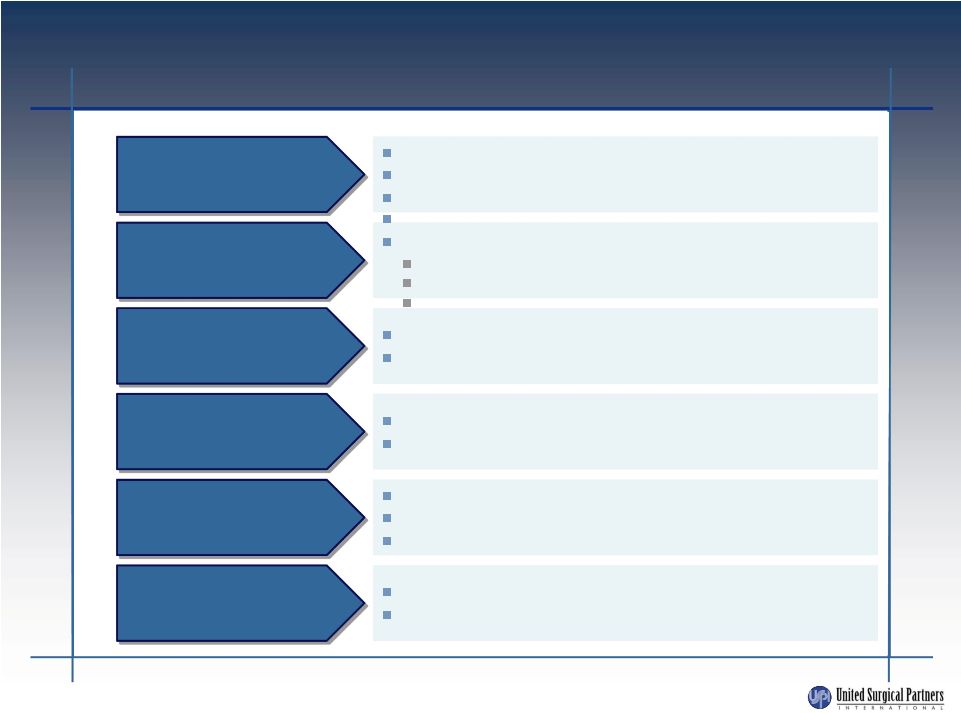
STRONG FINANCIAL AND OPERATING
PERFORMANCE POST 2007 LBO
84 acquisitions
22 de novo facility developments
16 new health system partners
Facility revenue CAGR of 13% from 2006 to 2012
Positive each of the past 5 years
Same facility revenue + 6.2% for 2011
Same facility revenue +5.7% for 2012
Same facility revenue (0.1%) for 1H 2013
Facility EBITDA CAGR of 13% from 2006 through 2012
Facility EBITDA margins of 30.5% for 2012 and 28.1% for 1H 2013
25% SWB as a percent of revenue
2% G&A as a percent of systemwide revenue
Installed decision support system
Improved quality management system
EHR Investment
41 facilities divested
75% of revenue from top 10 markets
Expansion
Facility revenue growth
Facility EBITDA
Cost management
System enhancements
Portfolio management |
 8
U.S. INDUSTRY OVERVIEW
ASCs have been widely successful and are a significant presence in
the U.S. healthcare delivery system
Advantages in patient safety and physician efficiency are meaningful
Significant savings to patients, government and commercial payors
Typically a savings to commercial insurers
Medicare savings >40%
Medicare beneficiary savings >50%
Able to reduce overall healthcare costs and manage need for surgical
services in an integrated care environment
Industry poised for consolidation
Top ten companies own less than 20%
Growth of new facilities has slowed in recent years |
 9
FRAGMENTED MARKET
Further consolidation likely within the industry and USPI is well-positioned
to capitalize
There are over 375 surgery center chains that own 2 or more ASCs.
Top ten companies still own less than 20%
Some ASCs and ASC companies choosing to sell in face of current headwinds
From 2000 –
2012, the percentage of ASCs owned by a multi-facility chain
increased from 22% to 40%
Source: SDI’s Outpatient Surgery Center Profiling Solution
Multi-facility
Independent
USPI facilities
2004
3,957
2012
2,717
(40%)
2008
5,876
2,136
(36%)
3,740
(64%)
6,758
4,041
(60%)
984
(25%)
2,973
(75%)
2000
3,172
704
(22%)
2,468
(78%)
49
87
161
213 |
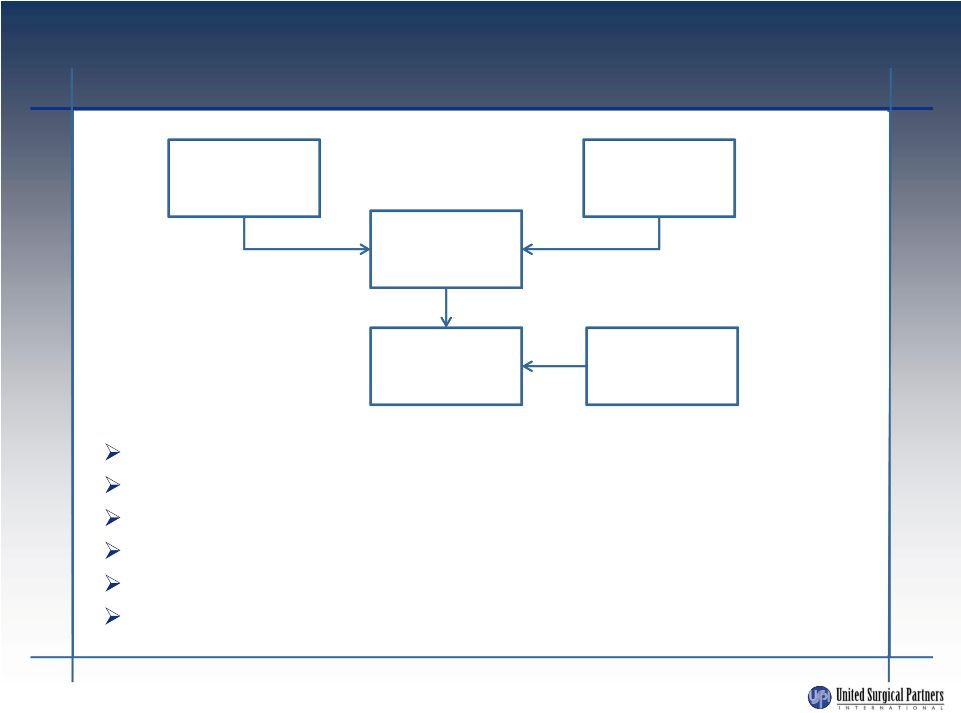
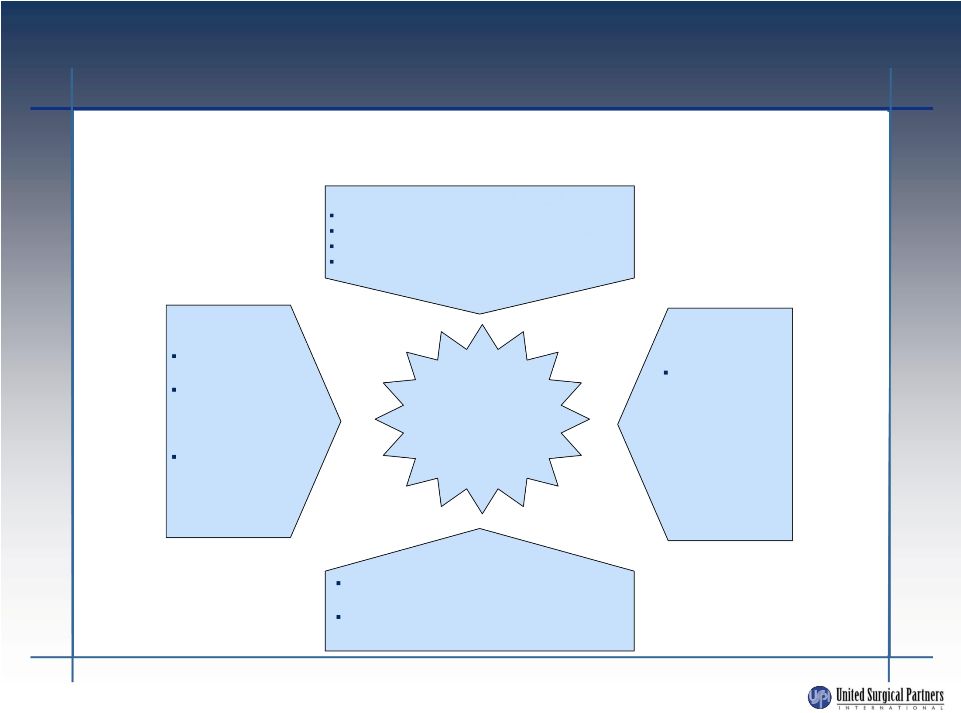 10
POSITIONED FOR REFORM
OPPORTUNITIES
Positioned to play an important role in managing increased need for surgical services
due to current reform initiatives and coverage of previously uninsured
lives Health System Partnerships
Physician
Partners
Professional Management
USPI is proven,
trusted partner
USPI involvement
can alleviate
historical distrust of
hospitals
USPI can help
provide targeted
solutions for
strategic
positioning
JV model in place
Commitment to highest level of quality service
Comfort regarding proper utilization of brand
Proven ability to execute and operate low
cost, high quality facilities
Proven ability in managing professional
partnerships
Opportunities
for USPI to
assist with
enhancement
of strategic
network
capabilities
Access to
Capital
In a rapidly
changing
environment,
ability to enhance
speed to market
with new models
where there are
capital
constraints
Health System Partnerships
Physician
Partners
Professional Management
USPI is proven,
trusted partner
USPI involvement
can alleviate
historical distrust of
hospitals
USPI can help
provide targeted
solutions for
strategic
positioning
JV model in place
Commitment to highest level of quality service
Comfort regarding proper utilization of brand
Proven ability to execute and operate low
cost, high quality facilities
Proven ability in managing professional
partnerships
Opportunities
for USPI to
assist with
enhancement
of strategic
network
capabilities
Access to
Capital
In a rapidly
changing
environment,
ability to enhance
speed to market
with new models
where there are
capital
constraints
Ability to assist with out-of-hospital strategies
|
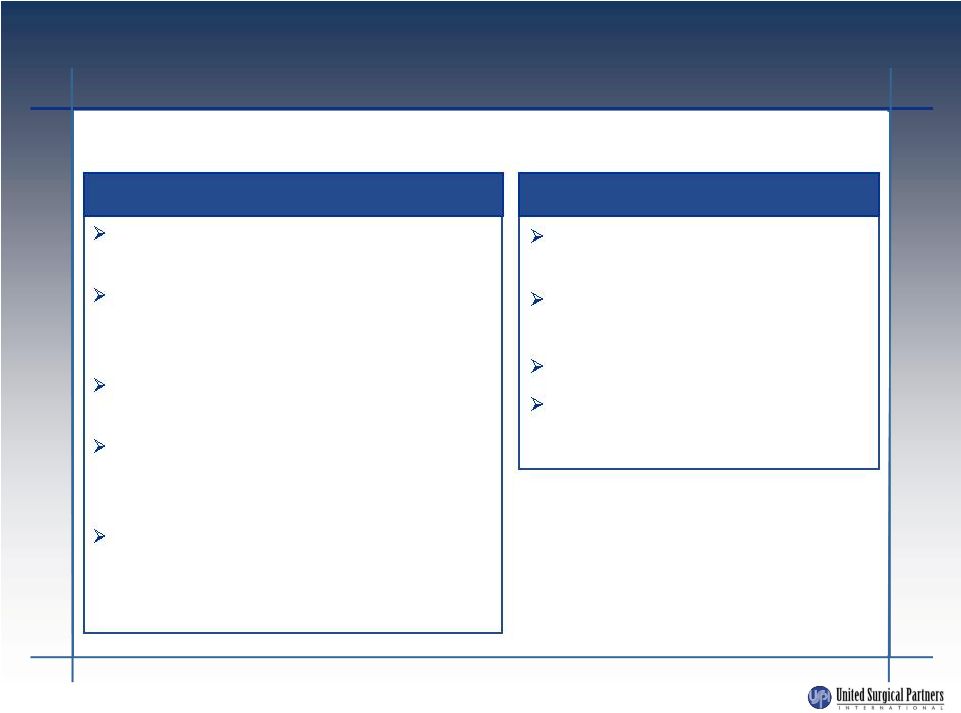 11
HEALTHCARE SYSTEM PARTNERS
148 facilities are in a partnership with a healthcare system
Benefits to Healthcare Systems
Leverage USPI’s operational expertise
and singular focus
Provides a strategy to promote
physician alignment and strategic
network capabilities
Provides defensive mechanism to
maintain short-stay surgical business
Provides capital and spreads risk
through USPI and physicians’
investment
Provides an opportunity to expand in
new markets at lower capital outlay
than a hospital
Benefits to USPI
Provides long-term strategic
stability in the marketplace
Provides brand, image,
reputation and credibility
Accelerates growth
Enhances relationships with
managed care payors |
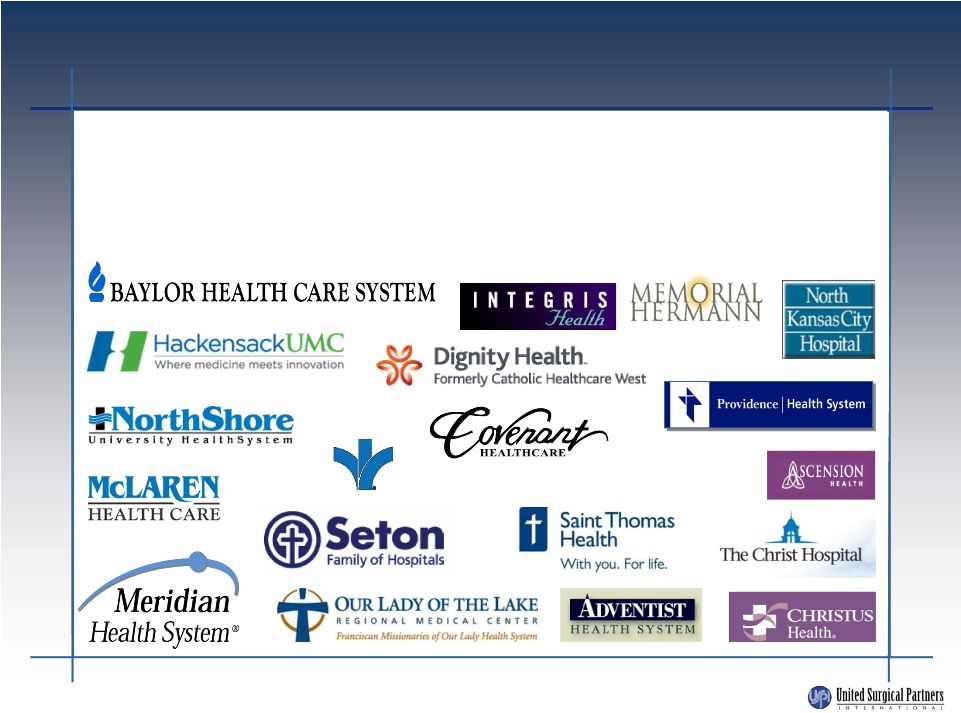 USPI’s strategy of partnering with not-for-profit healthcare systems
aligns the Company’s facilities with strong networks of physicians
and hospitals that are prominent in their communities and known
for providing high quality care
BON SECOURS HEALTH SYSTEM, INC.
HEALTHCARE SYSTEM PARTNERS
12 |
 13
Example Center
~25 physician investors
Average investment per physician of $50,000
Five operating rooms
12,000 square feet
29 FTEs
60% of cases performed by physician owners
Surgical
Facility
USPI
Hospital
Partner
Local
Physicians
Joint
Venture
49.9%
50.1%
50.1%
49.9% |
 14
GROWTH STRATEGY
Work with existing partners (physicians and hospitals) to grow market
share and enhance strategic positioning
Poised to react to current economic conditions and legislative
changes
Acquisition of troubled facilities
Selective acquisition of strong facilities
Selective de novo development
Selective acquisition of multi-facility companies
Selectively enter new markets with existing or new partners
Attractive demographics and/or payor characteristics
Prominent health system that embraces physician
alignment
strategy
Prominent physicians who are influential in the market
Committed to deploying capital with attractive ROI |
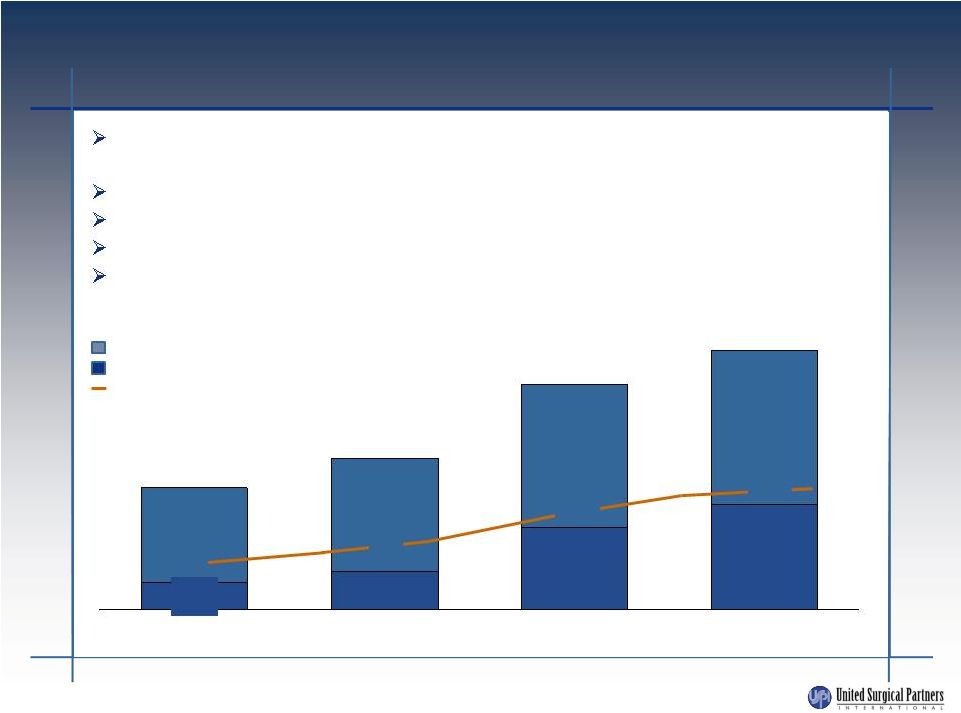
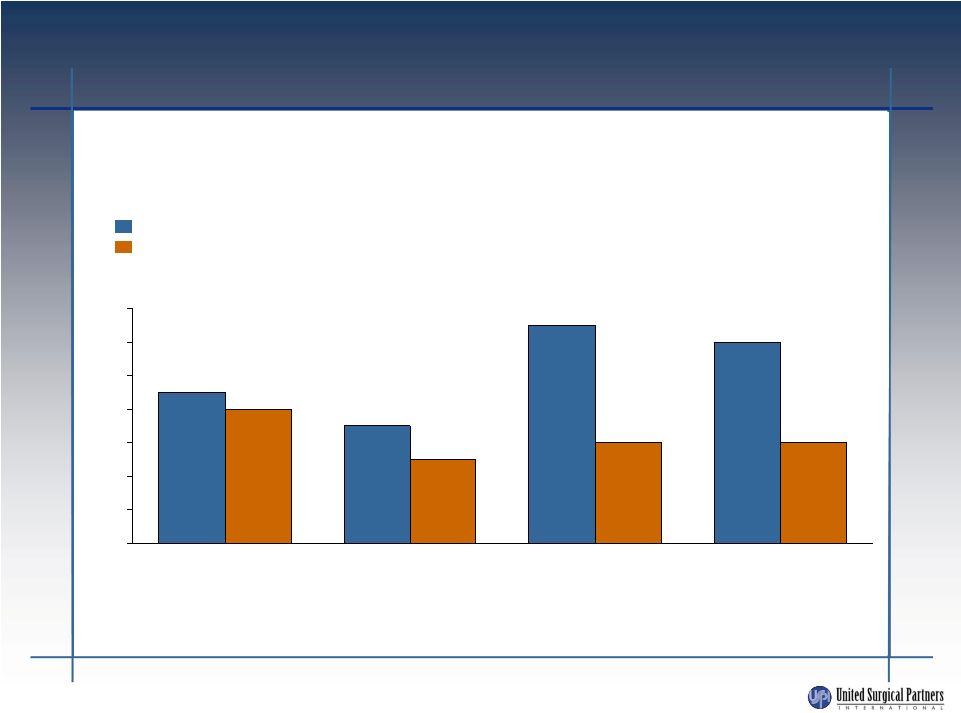 SUSTAINED REVENUE GROWTH
Systemwide revenue growth and same facility revenue growth
Facilities
operated at
year-end
165
185
200
213
12%
13%
7%
9%
6%
6%
5%
8%
0%
2%
4%
6%
8%
10%
12%
14%
2009
2010
2012
2011
Same facility revenue growth
Systemwide revenue growth
15 |
 U.S.
ADJUSTED EBITDA BRIDGE 16
($ in thousands)
2010
2011
2012
Operating income
194,611
$
233,659
$
245,234
$
Depreciation and amortization
22,493
21,177
23,955
EBITDA
217,104
254,836
269,189
Net income attributable to noncontrolling interests
(60,240)
(69,929)
(72,693)
EBITDA less noncontrolling interests
156,864
184,907
196,496
Net (gain) loss on deconsolidations, disposals and impairments
6,378
(1,529)
7,588
Impairment of unconsolidated affiliate
3,676
-
-
De novo start-up losses
136
4,009
500
Acquisition / transaction costs
2,857
3,314
2,200
Expense related to prior acquisition
6,000
-
-
Equity compensation
2,168
1,237
1,700
Management fee
2,000
2,000
2,000
Adjusted EBITDA
180,079
$
193,938
$
210,484
$
Years Ended December 31,
Unaudited Adjusted |
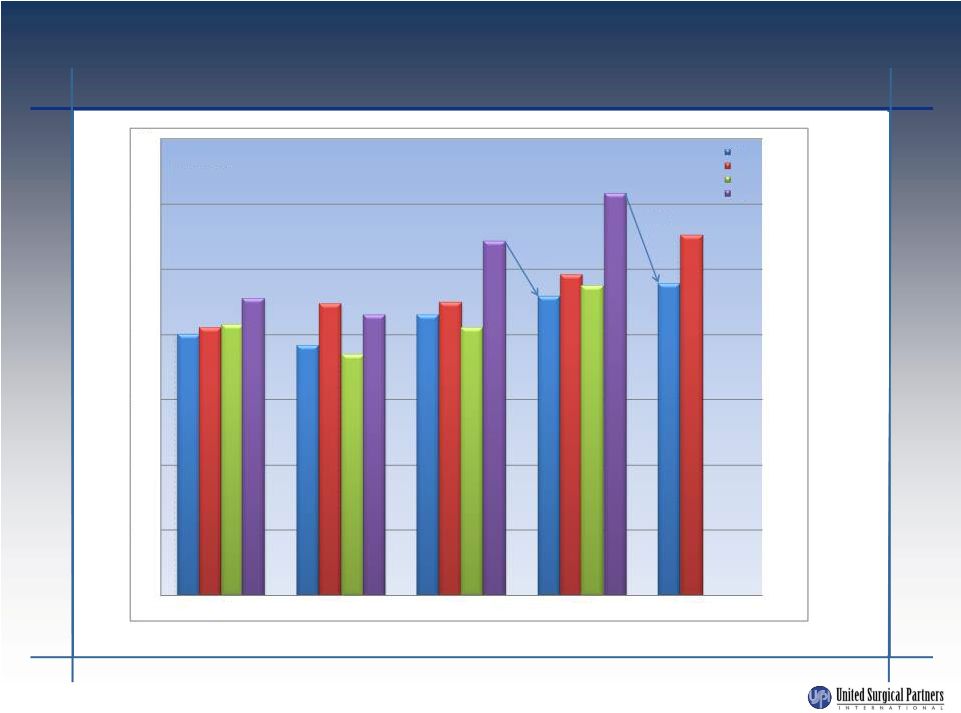 Contribution Trends
Totals
$168 $163
$183
$204
$103 17
Q1
Q2
Q3
Q4
$0
$10
$20
$30
$40
$50
$60
$70
2009
2010
2011
2012
2013
($ in Millons)
$8M
$14M |
  U.S.
ADJUSTED EBITDA BRIDGE ($ in thousands)
2013
2012
Operating income
118,839
$
119,984
$
Depreciation and amortization
14,075
11,663
EBITDA
132,914
131,647
Net income attributable to noncontrolling interests
(35,330)
(35,028)
EBITDA less noncontrolling interests
97,584
96,619
Net gain on deconsolidations, disposals and impairments
5,399
(1,572)
Equity compensation
899
837
Management fee
1,000
1,000
Adjusted EBITDA
104,882
$
96,884
$
Six Months Ended June 30
Unaudited Adjusted
18 |
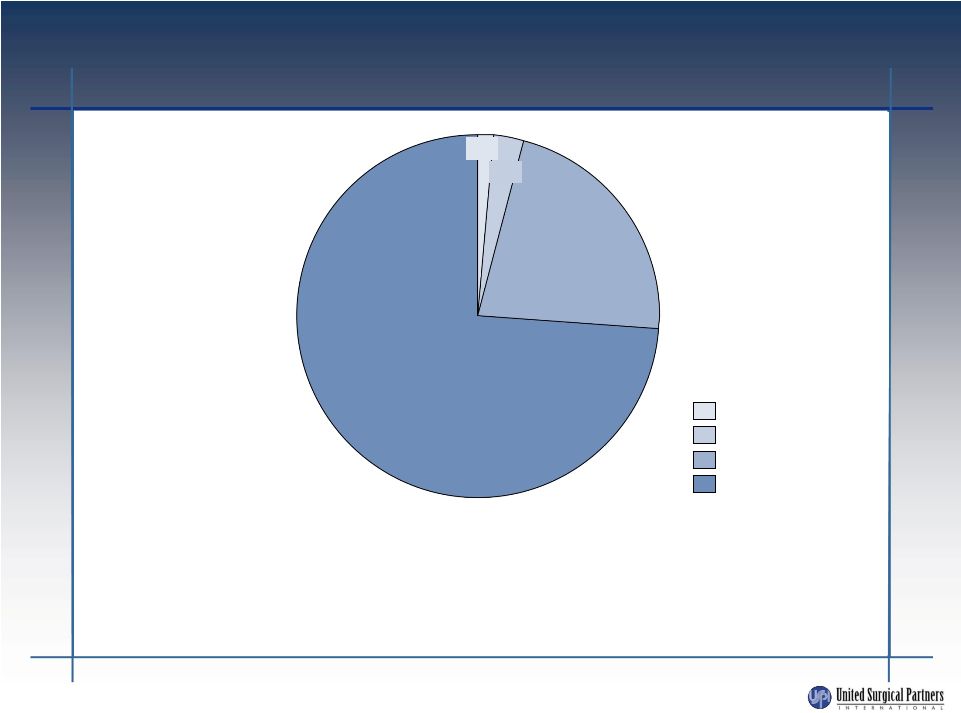 DEBT
MATURITIES Total debt of $1.5 billion
•
Weighted average rate of 6.1%
•
Corporate
level
debt
service
(cash
pay)
in
the
next
12
months
is
approximately
$94M,
including
$10M
principal
and
$84M interest, compared to approximately $98M, including $8M principal and $90M
interest for the trailing 12 months. 1%
3%
$331M
(22%)
$1,107
(74%)
Beyond 5 years
Months 37-60
Months 13-36
Next 12 Months
19 |
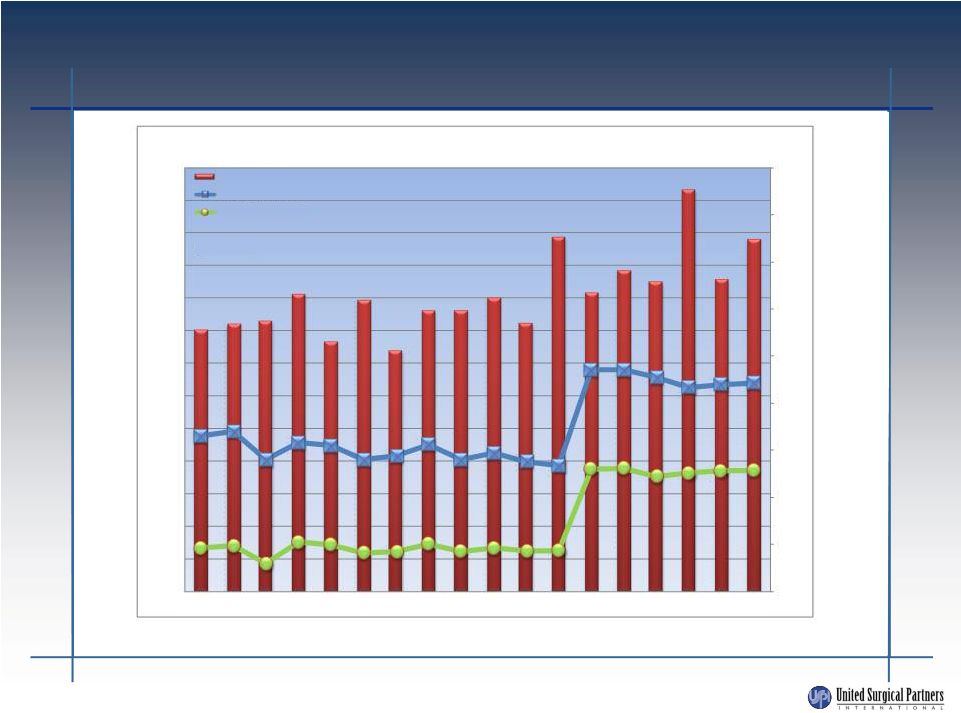 Leverage Trends
At June 30, 2013, total leverage was 6.4x and secured leverage was 4.6x.
20
2.0
3.0
4.0
5.0
6.0
7.0
8.0
9.0
10.0
11.0
$0
$5
$10
$15
$20
$25
$30
$35
$40
$45
$50
$55
$60
$65
Q109
Q209
Q309
Q409
Q110
Q210
Q310
Q410
Q111
Q211
Q311
Q411
Q112
Q212
Q312
Q412
Q113
Q213
USPI Contribution
Total Leverage Ratio
Secured Leverage Ratio
($ in
Millions) |
 SUMMARY
USPI is well positioned: high quality, low cost, high customer
satisfaction provider with sound long-term strategy
Partner with prominent health systems and local physicians
Strong partnering capabilities will continue to provide opportunities
for growth, even in difficult times
Focused on key strategic markets with significant market share
Stable revenue growth
Strong equity sponsor in WCAS
Capitalized for growth and flexibility
21 |
 |