Attached files
| file | filename |
|---|---|
| 8-K - 8-K - QUEST DIAGNOSTICS INC | item701.htm |
| EX-99.1 - PRESS RELEASE - QUEST DIAGNOSTICS INC | exhibit991.htm |

JEFFERIES 2013 GLOBAL HEALTHCARE CONFERENCE JUNE 6, 2013 Quest Diagnostics
Safe Harbor Disclosure This presentation may contain forward-looking statements. Readers are cautioned not to place undue reliance on forward-looking statements, which speak only as of the date that they are made and which reflect management's current estimates, projections, expectations or beliefs and which involve risks and uncertainties that could cause actual results and outcomes to be materially different. Risks and uncertainties that may affect the future results of the company include, but are not limited to, adverse results from pending or future government investigations, lawsuits or private actions, the competitive environment, changes in government regulations, changing relationships with customers, payers, suppliers and strategic partners and other factors discussed in “Business,” “Risk Factors,” “Cautionary Factors that May Affect Future Results,” “Legal Proceedings,” “Management's Discussion and Analysis of Financial Condition and Results of Operations,” and “Quantitative and Qualitative Disclosures About Market Risk” in the company's 2012 Annual Report on Form 10-K and “Management's Discussion and Analysis of Financial Condition and Results of Operations,” “Quantitative and Qualitative Disclosures About Market Risk,” and “Risk Factors” in the company's Quarterly Reports on Form 10-Q and other items throughout the Form 10-K and the company's 2013 Quarterly Reports on Form 10-Q and Current Reports on Form 8-K. 2

Professional Services (29%) Other (16%) Prescriptions (12%) Hospital (36%) Source: CMS, Thomson Reuters, Quest Diagnostics analysis * Excludes healthcare expenditures related to administration (government and private), government funded public health activities, government-funded research, and investments in structures and equipment. Estimated 2012 Health Consumption Expenditures $2.4T U.S. Diagnostic Testing Represents a Small Cost but Drives a Disproportionate Impact on Healthcare Laboratory Testing makes up only 3% of health consumption expenditures Other Medical Products(4%) Lab $72B (3%) Increasing Role of Diagnostics • Diagnostic testing has an increasingly important seat at the table in delivering lower cost, higher quality healthcare • Trend towards more precision medicine and disease-oriented, personalized healthcare will strengthen the value we bring to the market 3
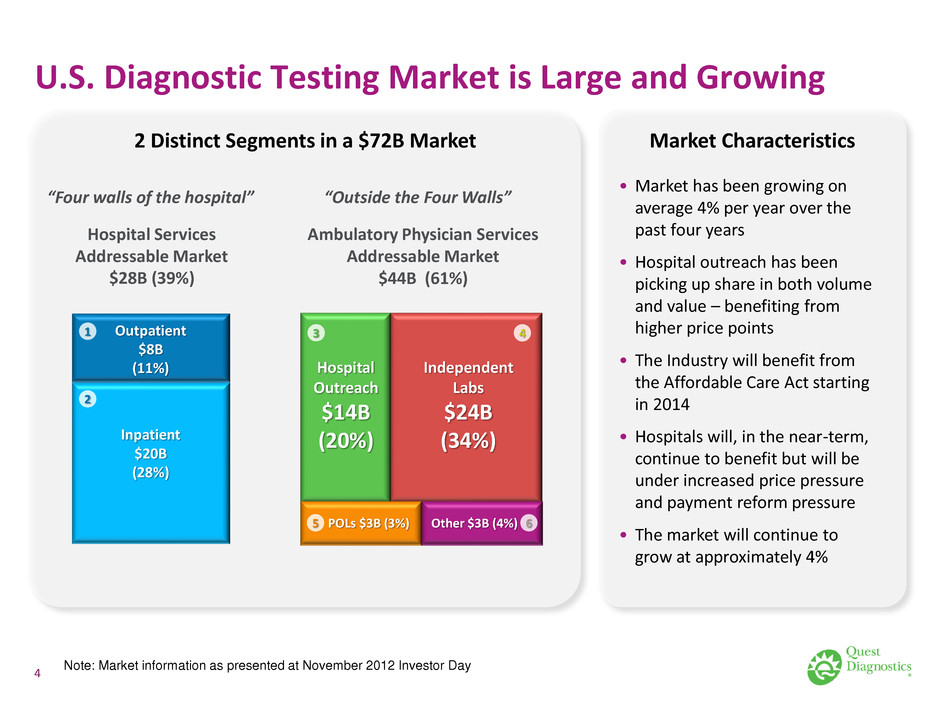
U.S. Diagnostic Testing Market is Large and Growing Hospital Outreach $14B (20%) Independent Labs $24B (34%) Other $3B (4%) POLs $3B (3%) 3 4 5 6 Ambulatory Physician Services Addressable Market $44B (61%) Hospital Services Addressable Market $28B (39%) Inpatient $20B (28%) Outpatient $8B (11%) 1 2 “Four walls of the hospital” “Outside the Four Walls” Market Characteristics • Market has been growing on average 4% per year over the past four years • Hospital outreach has been picking up share in both volume and value – benefiting from higher price points • The Industry will benefit from the Affordable Care Act starting in 2014 • Hospitals will, in the near-term, continue to benefit but will be under increased price pressure and payment reform pressure • The market will continue to grow at approximately 4% 2 Distinct Segments in a $72B Market 4 Note: Market information as presented at November 2012 Investor Day
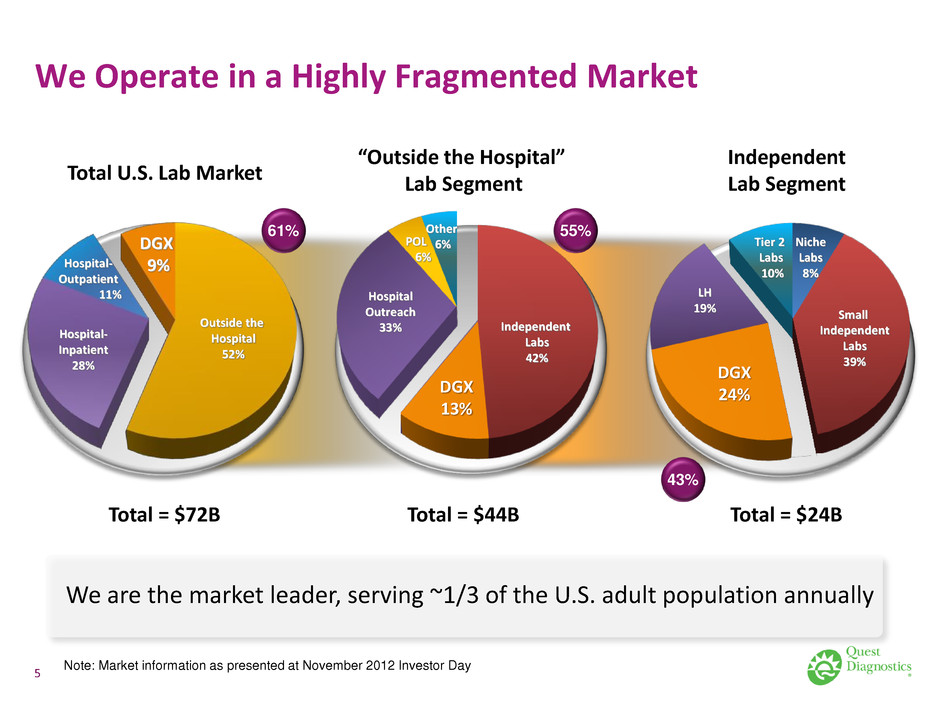
We Operate in a Highly Fragmented Market Total U.S. Lab Market Total = $24B Total = $44B “Outside the Hospital” Lab Segment Independent Lab Segment Total = $72B Outside the Hospital 52% Hospital- Inpatient 28% Hospital- Outpatient 11% Independent Labs 42% Hospital Outreach 33% POL 6% Other 6% DGX 9% DGX 13% 61% 55% Small Independent Labs 39% DGX 24% Tier 2 Labs 10% Niche Labs 8% LH 19% 43% 5 We are the market leader, serving ~1/3 of the U.S. adult population annually Note: Market information as presented at November 2012 Investor Day
One Vision, Three Goals, Five-Point Strategy 6
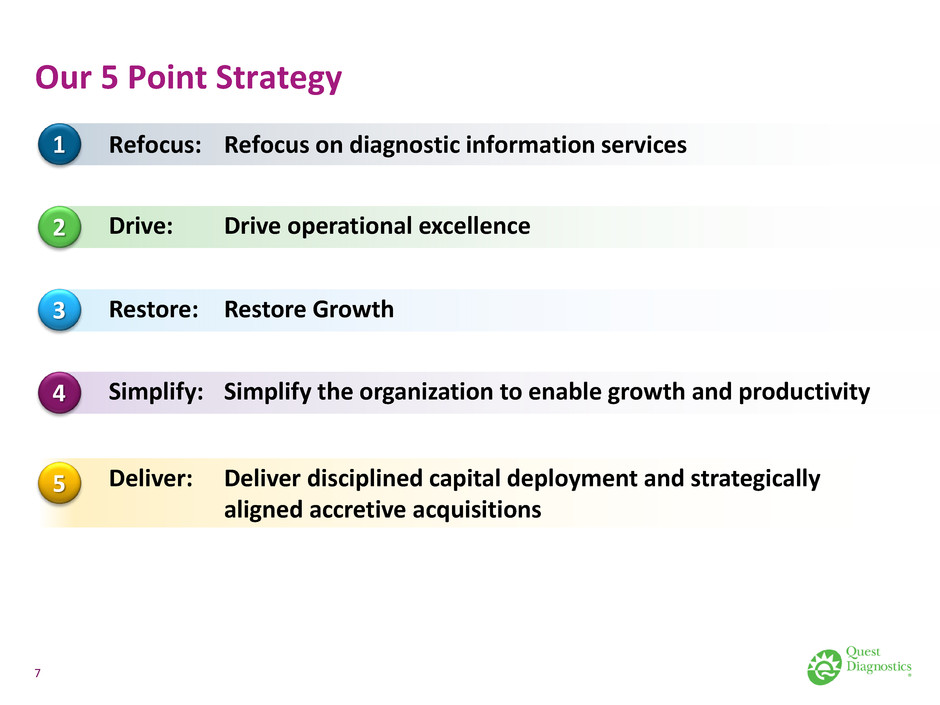
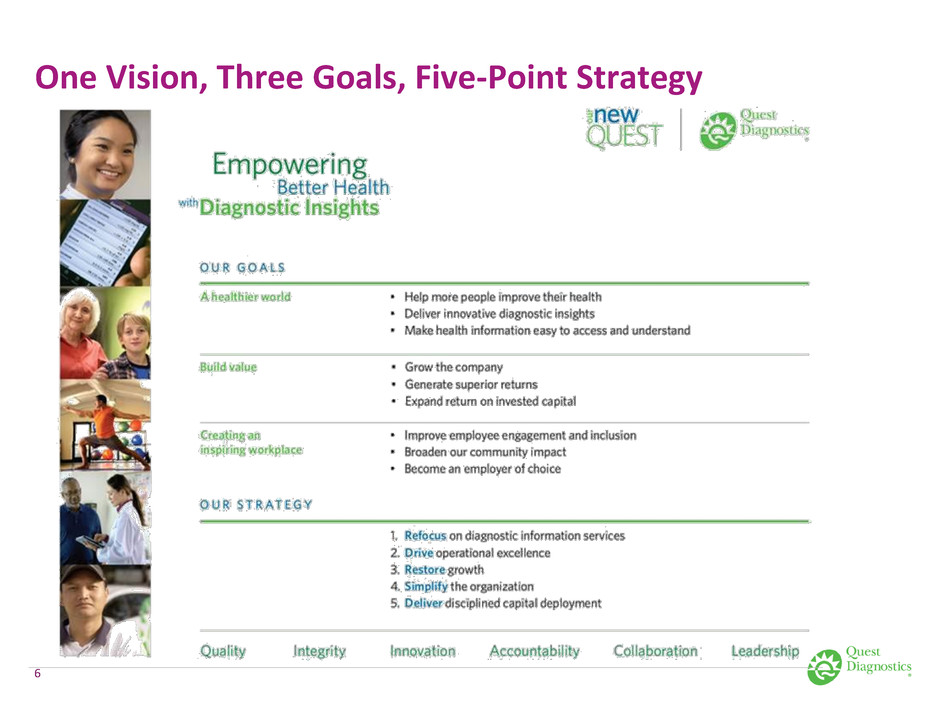
Our 5 Point Strategy Refocus: Refocus on diagnostic information services 1 2 3 4 5 Drive: Drive operational excellence Restore: Restore Growth Simplify: Simplify the organization to enable growth and productivity Deliver: Deliver disciplined capital deployment and strategically aligned accretive acquisitions 7
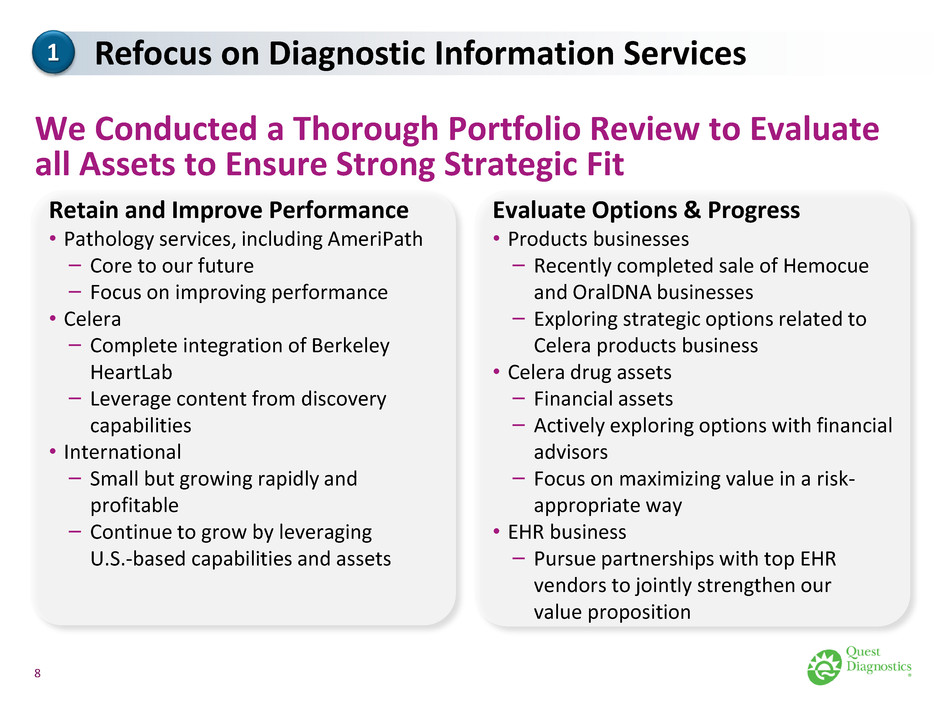
1 We Conducted a Thorough Portfolio Review to Evaluate all Assets to Ensure Strong Strategic Fit Retain and Improve Performance • Pathology services, including AmeriPath ‒ Core to our future ‒ Focus on improving performance • Celera ‒ Complete integration of Berkeley HeartLab ‒ Leverage content from discovery capabilities • International ‒ Small but growing rapidly and profitable ‒ Continue to grow by leveraging U.S.-based capabilities and assets Evaluate Options & Progress • Products businesses ‒ Recently completed sale of Hemocue and OralDNA businesses ‒ Exploring strategic options related to Celera products business • Celera drug assets ‒ Financial assets ‒ Actively exploring options with financial advisors ‒ Focus on maximizing value in a risk- appropriate way • EHR business ‒ Pursue partnerships with top EHR vendors to jointly strengthen our value proposition Refocus on Diagnostic Information Services 8
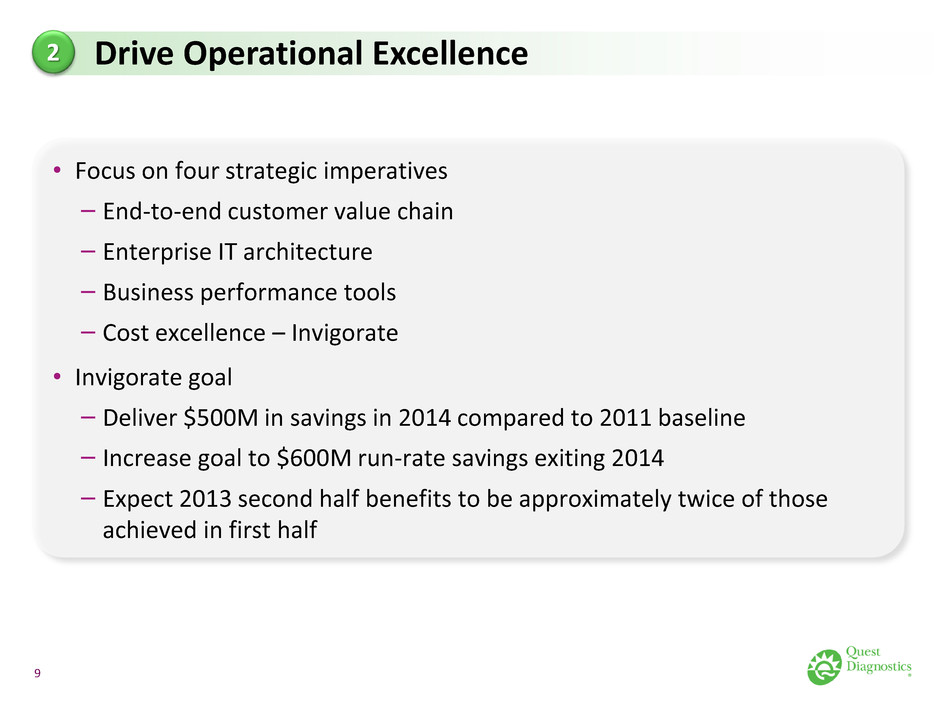
• Focus on four strategic imperatives ‒ End-to-end customer value chain ‒ Enterprise IT architecture ‒ Business performance tools ‒ Cost excellence – Invigorate • Invigorate goal ‒ Deliver $500M in savings in 2014 compared to 2011 baseline ‒ Increase goal to $600M run-rate savings exiting 2014 ‒ Expect 2013 second half benefits to be approximately twice of those achieved in first half 2 Drive Operational Excellence 9
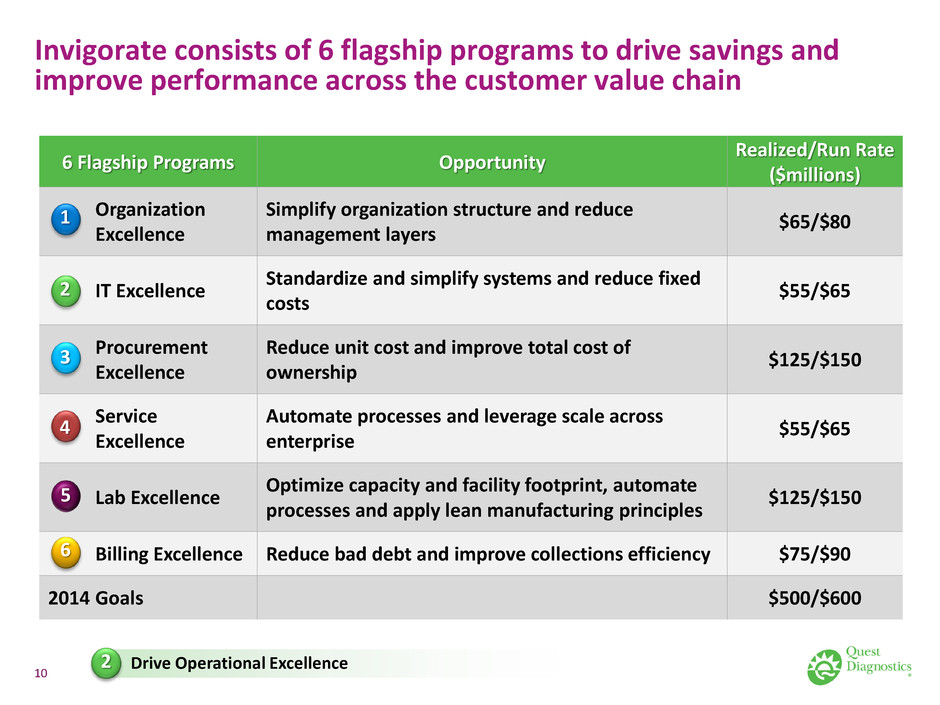
Invigorate consists of 6 flagship programs to drive savings and improve performance across the customer value chain 6 Flagship Programs Opportunity Realized/Run Rate ($millions) Organization Excellence Simplify organization structure and reduce management layers $65/$80 IT Excellence Standardize and simplify systems and reduce fixed costs $55/$65 Procurement Excellence Reduce unit cost and improve total cost of ownership $125/$150 Service Excellence Automate processes and leverage scale across enterprise $55/$65 Lab Excellence Optimize capacity and facility footprint, automate processes and apply lean manufacturing principles $125/$150 Billing Excellence Reduce bad debt and improve collections efficiency $75/$90 2014 Goals $500/$600 6 5 4 3 2 1 10 Drive Operational Excellence 2
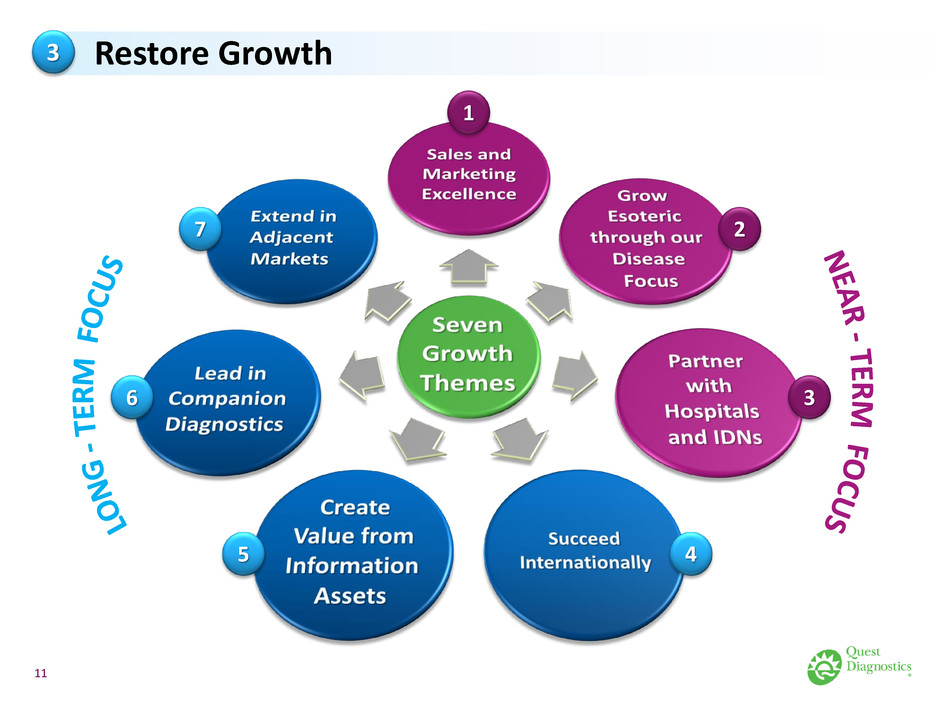
1 2 3 4 5 6 7 3 Restore Growth 11
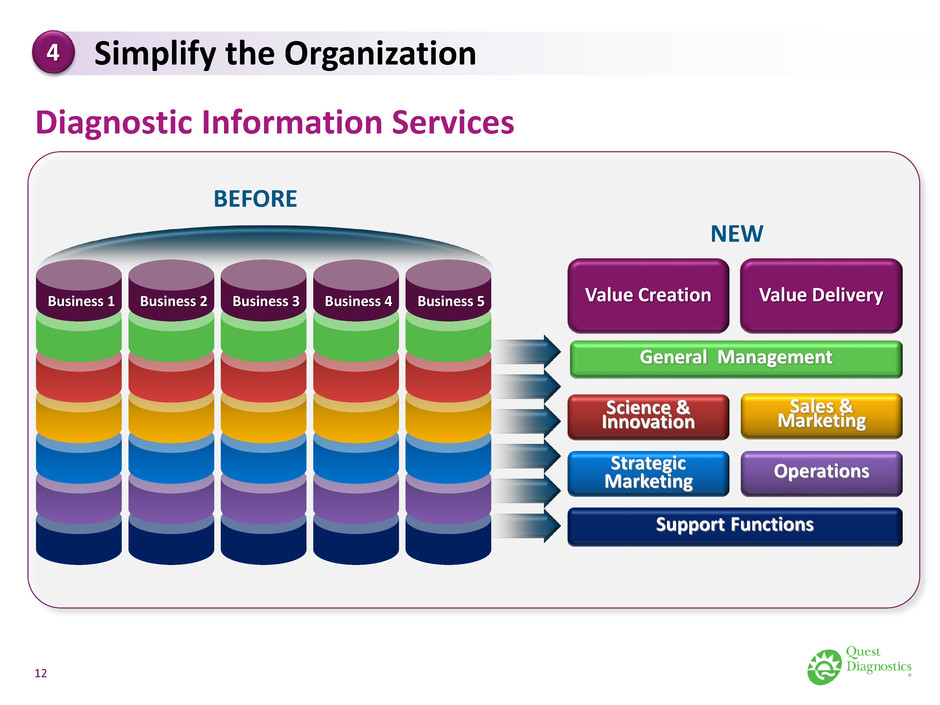
Value Delivery Value Creation Diagnostic Information Services Science & Innovation Sales & Marketing Operations Support Functions NEW General Management Strategic Marketing BEFORE Business 1 Business 2 Business 3 Business 4 Business 5 4 Simplify the Organization 12
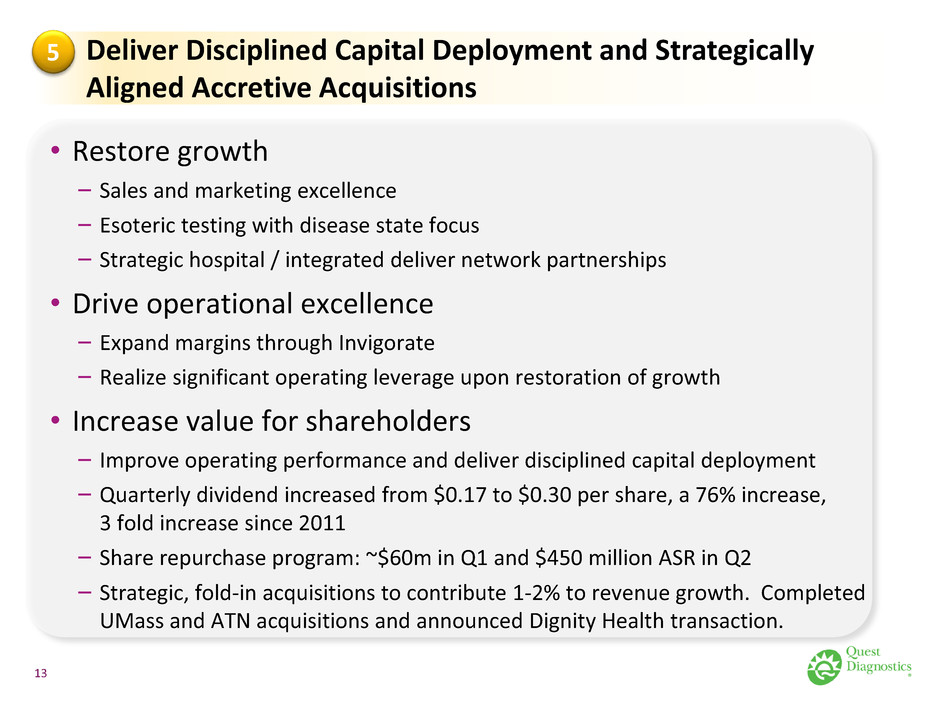
• Restore growth ‒ Sales and marketing excellence ‒ Esoteric testing with disease state focus ‒ Strategic hospital / integrated deliver network partnerships • Drive operational excellence ‒ Expand margins through Invigorate ‒ Realize significant operating leverage upon restoration of growth • Increase value for shareholders ‒ Improve operating performance and deliver disciplined capital deployment ‒ Quarterly dividend increased from $0.17 to $0.30 per share, a 76% increase, 3 fold increase since 2011 ‒ Share repurchase program: ~$60m in Q1 and $450 million ASR in Q2 ‒ Strategic, fold-in acquisitions to contribute 1-2% to revenue growth. Completed UMass and ATN acquisitions and announced Dignity Health transaction. 5 Deliver Disciplined Capital Deployment and Strategically Aligned Accretive Acquisitions 13
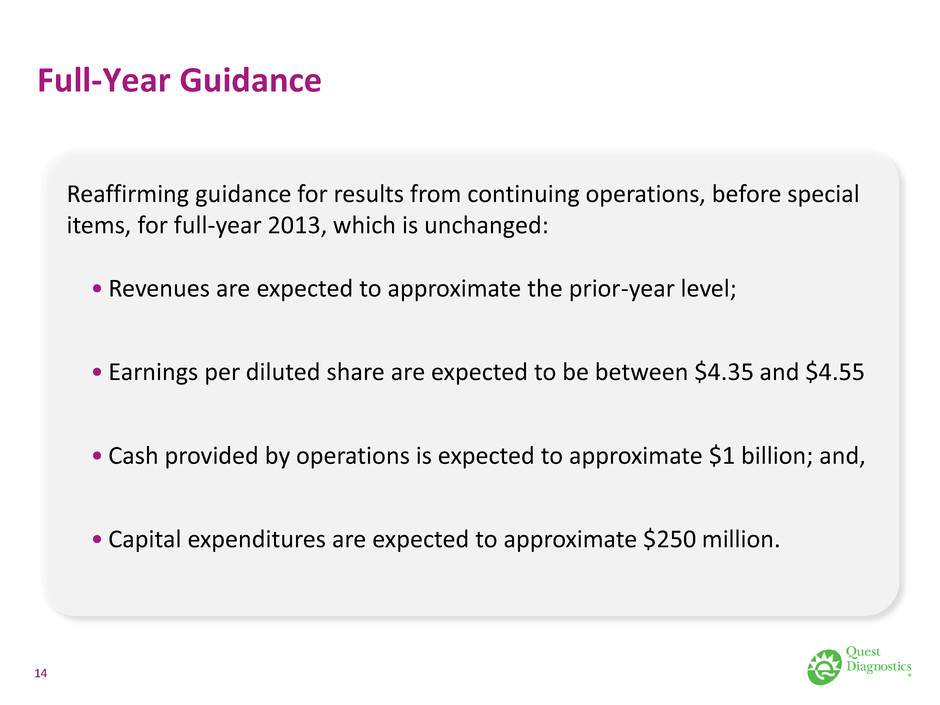
Full-Year Guidance Reaffirming guidance for results from continuing operations, before special items, for full-year 2013, which is unchanged: • Revenues are expected to approximate the prior-year level; • Earnings per diluted share are expected to be between $4.35 and $4.55 • Cash provided by operations is expected to approximate $1 billion; and, • Capital expenditures are expected to approximate $250 million. 14
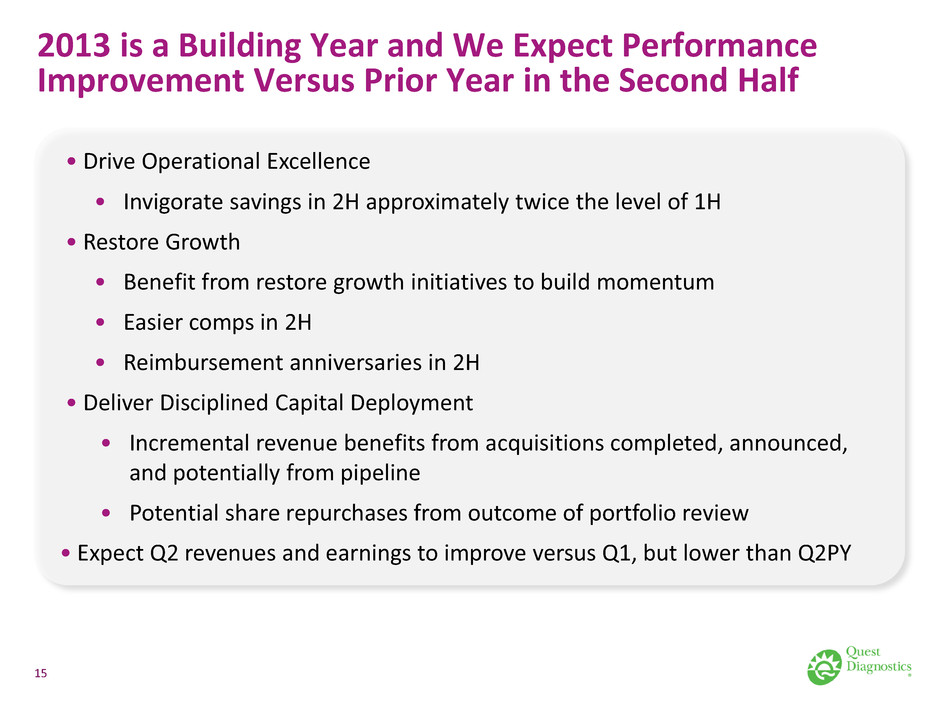
2013 is a Building Year and We Expect Performance Improvement Versus Prior Year in the Second Half • Drive Operational Excellence • Invigorate savings in 2H approximately twice the level of 1H • Restore Growth • Benefit from restore growth initiatives to build momentum • Easier comps in 2H • Reimbursement anniversaries in 2H • Deliver Disciplined Capital Deployment • Incremental revenue benefits from acquisitions completed, announced, and potentially from pipeline • Potential share repurchases from outcome of portfolio review • Expect Q2 revenues and earnings to improve versus Q1, but lower than Q2PY 15

Quest Diagnostics
