Attached files
| file | filename |
|---|---|
| 8-K - 8-K - Silver Bay Realty Trust Corp. | a13-14312_18k.htm |
Exhibit 99.1
|
|
[LOGO] |
|
|
SAFE HARBOR STATEMENT FORWARD-LOOKING STATEMENTS This presentation includes “forward-looking statements” within the meaning of the safe harbor provisions of the United States Private Securities Litigation Reform Act of 1995. Actual results may differ from expectations, estimates and projections and, consequently, readers should not rely on these forward-looking statements as predictions of future events. Words such as “expect,” “target,” “assume,” “estimate,” “project,” “budget,” “forecast,” “anticipate,” “intend,” “plan,” “may,” “will,” “could,” “should,” “believe,” “predicts,” “potential,” “continue,” and similar expressions are intended to identify such forward-looking statements. These forward looking statements involve significant risks and uncertainties that could cause actual results to differ materially from expected results. Factors that could cause actual results to differ include: adverse economic or real estate developments in Silver Bay’s target markets; defaults on, early terminations of or non-renewal of leases by residents; difficulties in identifying properties to acquire and completing acquisitions; increased time and/or expense to gain possession and renovate properties; Silver Bay’s failure to successfully operate acquired properties; the Company’s ability to obtain financing arrangements; Silver Bay’s failure to meet the conditions to draw under the credit facility; general volatility of the markets in which we participate; interest rates and the market value of Silver Bay’s target assets; the impact of changes in governmental regulations, tax law and rates, and similar matters. Readers are cautioned not to place undue reliance upon any forward-looking statements, which speak only as of the date made. Silver Bay does not undertake or accept any obligation to release publicly any updates or revisions to any forward-looking statement to reflect any change in its expectations or any change in events, conditions or circumstances on which any such statement is based. Additional information concerning these and other risk factors is contained in Silver Bay’s most recent filings with the Securities and Exchange Commission. All subsequent written and oral forward looking statements concerning Silver Bay or matters attributable to Silver Bay or any person acting on its behalf are expressly qualified in their entirety by the cautionary statements above. |
|
|
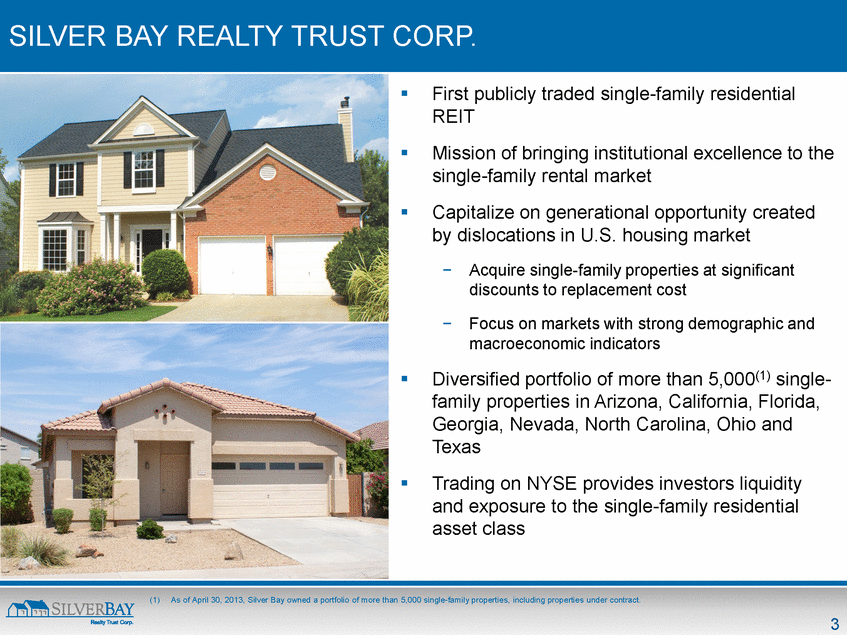
SILVER BAY REALTY TRUST CORP. . First publicly traded single-family residential REIT . Mission of bringing institutional excellence to the single-family rental market . Capitalize on generational opportunity created by dislocations in U.S. housing market - Acquire single-family properties at significant discounts to replacement cost - Focus on markets with strong demographic and macroeconomic indicators . Diversified portfolio of more than 5,000(1) single- family properties in Arizona, California, Florida, Georgia, Nevada, North Carolina, Ohio and Texas . Trading on NYSE provides investors liquidity and exposure to the single-family residential asset class (1) As of April 30, 2013, Silver Bay owned a portfolio of more than 5,000 single-family properties, including properties under contract. |
|
|
SILVER BAY POSITIONED TO DELIVER VALUE TO STOCKHOLDERS . Ownership of residential assets provides direct exposure to the housing recovery . Favorable macroeconomic and demographic trends support multi-year investment horizon . Expected future appreciation in rental cash flows provides cash flow growth and inflation protection . Downside protection from buying at cyclically low levels and discounts to replacement cost . Industry consolidation provides further opportunity for scale and diversification SINGLE-FAMILY RESIDENTIAL INVESTMENT OPPORTUNITY SILVER BAY OPPORTUNITY . First pure-play, public vehicle providing exposure and liquidity to single-family residential sector . Successfully deployed IPO proceeds; portfolio of over 5,000 homes as of April 30 . Top quality sponsorship by Pine River Capital Management . Proprietary analytics, research and technology support investment and execution . Valuation trading close to book value (unadjusted for any appreciation in market value from HPA)(1) MULTI-YEAR INVESTMENT TODAY’S OPPORTUNITY LONG-TERM OPPORTUNITY . Depressed housing prices . Elevated supply of distressed properties . Strong HPA in most compelling markets . Favorable rental dynamics . Industry consolidation . Operating efficiencies . Rental growth following HPA . National brand and resident loyalty (1) As of March 31, 2013, the Company’s reported book value per common share was $17.49, which includes $0.14 in accumulated depreciation and amortization. Book value per common share does not reflect any mark-to-market adjustment to the Company’s assets. |
|
|
INVESTMENT OPPORTUNITY |
|
|
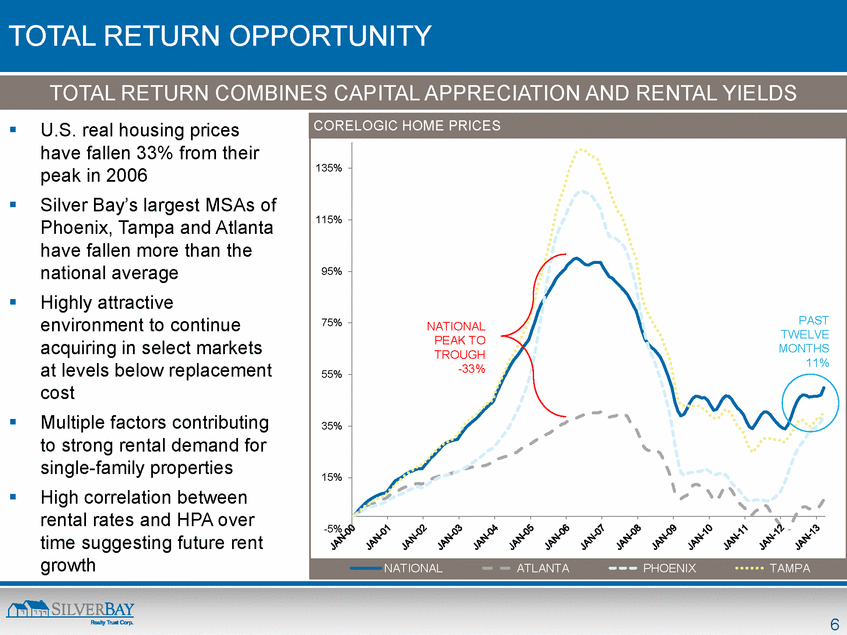
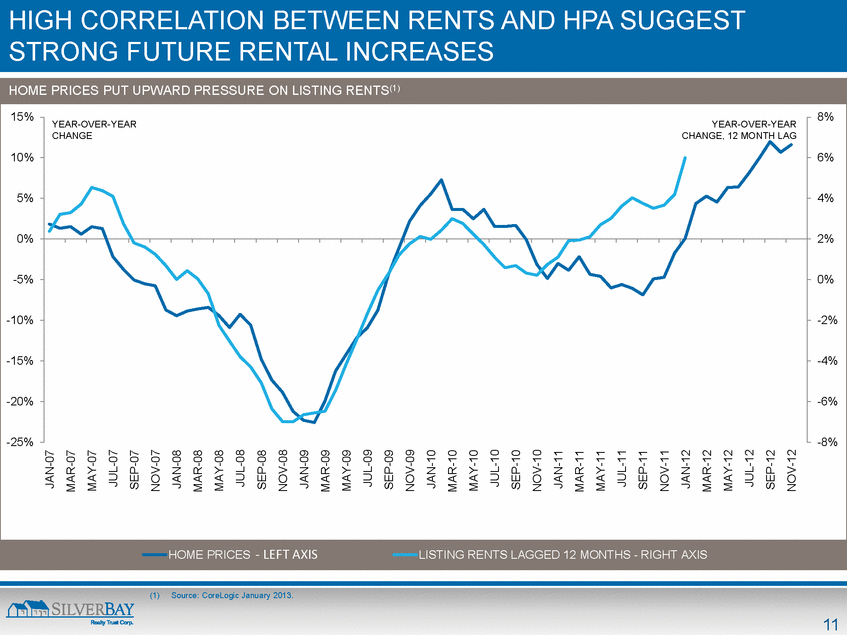
TOTAL RETURN OPPORTUNITY -5% 15% 35% 55% 75% 95% 115% 135% NATIONAL ATLANTA PHOENIX TAMPA . U.S. real housing prices have fallen 33% from their peak in 2006 . Silver Bay’s largest MSAs of Phoenix, Tampa and Atlanta have fallen more than the national average . Highly attractive environment to continue acquiring in select markets at levels below replacement cost . Multiple factors contributing to strong rental demand for single-family properties . High correlation between rental rates and HPA over time suggesting future rent growth TOTAL RETURN COMBINES CAPITAL APPRECIATION AND RENTAL YIELDS NATIONAL PEAK TO TROUGH -33% PAST TWELVE MONTHS 11% CORELOGIC HOME PRICES |
|
|
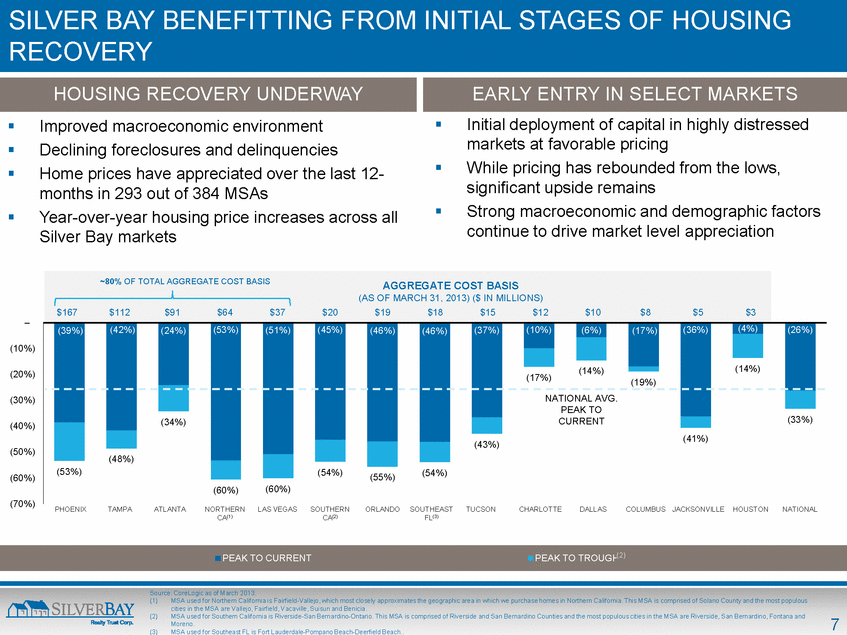
SILVER BAY BENEFITTING FROM INITIAL STAGES OF HOUSING RECOVERY HOUSING RECOVERY UNDERWAY EARLY ENTRY IN SELECT MARKETS . Improved macroeconomic environment . Declining foreclosures and delinquencies . Home prices have appreciated over the last 12- months in 293 out of 384 MSAs . Year-over-year housing price increases across all Silver Bay markets . Initial deployment of capital in highly distressed markets at favorable pricing . While pricing has rebounded from the lows, significant upside remains . Strong macroeconomic and demographic factors continue to drive market level appreciation (39%) (42%) (24%) (53%) (51%) (45%) (46%) (46%) (37%) (10%) (6%) (17%) (36%) (4%) (26%) (53%) (48%) (34%) (60%) (60%) (54%) (55%) (54%) (43%) (17%) (14%) (19%) (41%) (14%) (33%) (70%) (60%) (50%) (40%) (30%) (20%) (10%) – PEAK TO CURRENT PEAK TO TROUGH (2) Source: CoreLogic as of March 2013. (1) MSA used for Northern California is Fairfield-Vallejo, which most closely approximates the geographic area in which we purchase homes in Northern California. This MSA is comprised of Solano County and the most populous cities in the MSA are Vallejo, Fairfield, Vacaville, Suisun and Benicia. (2) MSA used for Southern California is Riverside-San Bernardino-Ontario. This MSA is comprised of Riverside and San Bernardino Counties and the most populous cities in the MSA are Riverside, San Bernardino, Fontana and Moreno. (3) MSA used for Southeast FL is Fort Lauderdale-Pompano Beach-Deerfield Beach $112 $167 $91 $64 $37 $20 $19 $18 $15 $12 $10 $8 $5 $3 AGGREGATE COST BASIS (AS OF MARCH 31, 2013) ($ IN MILLIONS) ~80% OF TOTAL AGGREGATE COST BASIS NATIONAL AVG. PEAK TO CURRENT PHOENIX TAMPA ATLANTA NORTHERN CA(1) LAS VEGAS SOUTHERN CA(2) ORLANDO SOUTHEAST FL(3) TUCSON CHARLOTTE DALLAS COLUMBUS JACKSONVILLE HOUSTON NATIONAL (2) |
|
|
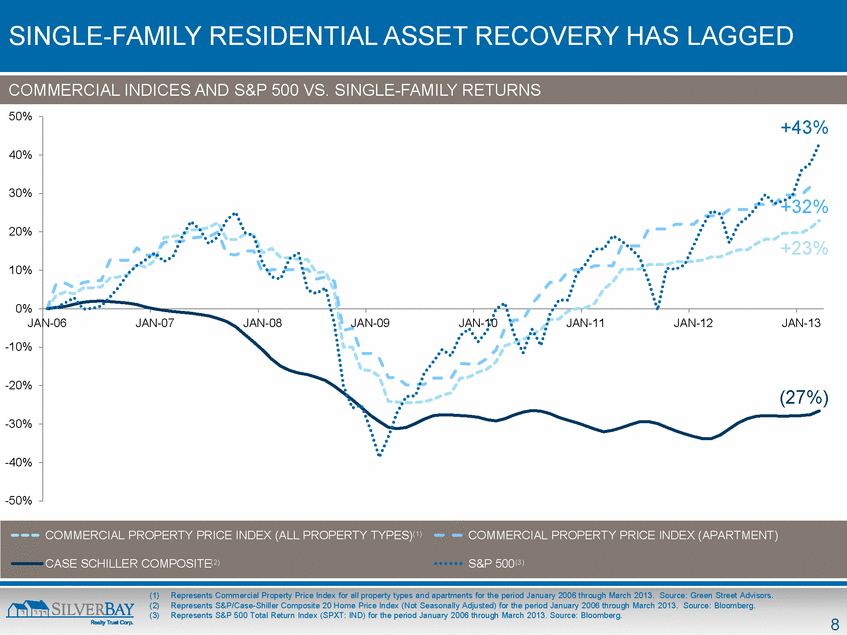
SINGLE-FAMILY RESIDENTIAL ASSET RECOVERY HAS LAGGED -50% -40% -30% -20% -10% 0% 10% 20% 30% 40% 50% JAN-06 JAN-07 JAN-08 JAN-09 JAN-10 JAN-11 JAN-12 JAN-13 COMMERCIAL PROPERTY PRICE INDEX (ALL PROPERTY TYPES) COMMERCIAL PROPERTY PRICE INDEX (APARTMENT) CASE SCHILLER COMPOSITE S&P 500 +32% (27%) COMMERCIAL INDICES AND S&P 500 VS. SINGLE-FAMILY RETURNS +43% +23% (1) Represents Commercial Property Price Index for all property types and apartments for the period January 2006 through March 2013. Source: Green Street Advisors. (2) Represents S&P/Case-Shiller Composite 20 Home Price Index (Not Seasonally Adjusted) for the period January 2006 through March 2013. Source: Bloomberg. (3) Represents S&P 500 Total Return Index (SPXT: IND) for the period January 2006 through March 2013. Source: Bloomberg. (1) (2) (3) |
|
|
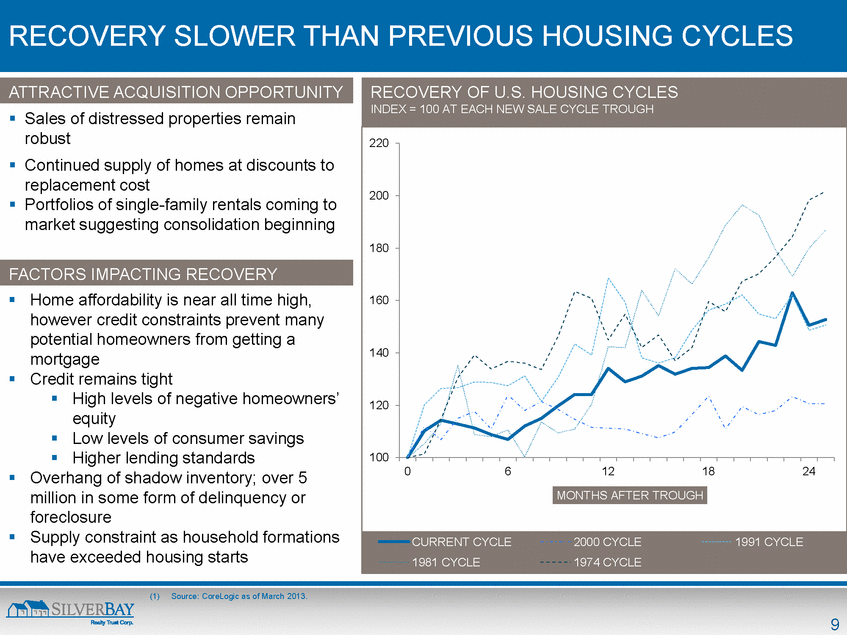
RECOVERY SLOWER THAN PREVIOUS HOUSING CYCLES . Sales of distressed properties remain robust . Continued supply of homes at discounts to replacement cost . Portfolios of single-family rentals coming to market suggesting consolidation beginning FACTORS IMPACTING RECOVERY . Home affordability is near all time high, however credit constraints prevent many potential homeowners from getting a mortgage . Credit remains tight . High levels of negative homeowners’ equity . Low levels of consumer savings . Higher lending standards . Overhang of shadow inventory; over 5 million in some form of delinquency or foreclosure . Supply constraint as household formations have exceeded housing starts ATTRACTIVE ACQUISITION OPPORTUNITY (1) Source: CoreLogic as of March 2013. (1) 100 120 140 160 180 200 220 0 6 12 18 24 MONTHS AFTER TROUGH CURRENT CYCLE 2000 CYCLE 1991 CYCLE 1981 CYCLE 1974 CYCLE RECOVERY OF U.S. HOUSING CYCLES INDEX = 100 AT EACH NEW SALE CYCLE TROUGH |
|
|
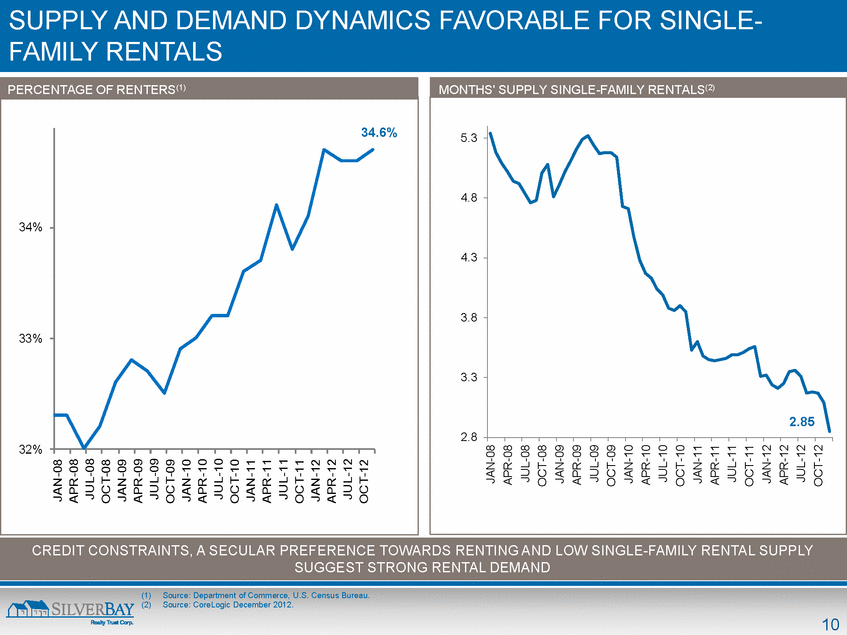
SUPPLY AND DEMAND DYNAMICS FAVORABLE FOR SINGLE- FAMILY RENTALS (1) Source: Department of Commerce, U.S. Census Bureau. (2) Source: CoreLogic December 2012. <tags><tag n="AppId" v="1" /><tag n="Type" v="0" /><tag n="TimeStamp" v="2012-11-27 22:15:37" /><tag n="File" v="\\DCTM_FSS\AM\Client\Two harbors Investment Co(TJC7)\Bus Dev\General\Project Phoenix\11. Presentations\1. Pre-marketing (JOBs) mgmt presentation\Excel backup\Homeowners vs renters rate 2000 - 6.30.2012.xls" /><tag n="Sheet" v="HomeownershipRate" /><tag n="Range" v="" /><tag n="EmbeddedName" v="Worksheet in Silver Bay Roadshow Presentation v85.pptx 3" /></tags>MONTHS' SUPPLY SINGLE-FAMILY RENTALS(2) PERCENTAGE OF RENTERS(1) <tags><tag n="AppId" v="1" /><tag n="Type" v="0" /><tag n="TimeStamp" v="2012-11-27 22:15:37" /><tag n="File" v="\\DCTM_FSS\AM\Client\Two harbors Investment Co(TJC7)\Bus Dev\General\Project Phoenix\11. Presentations\1. Pre-marketing (JOBs) mgmt presentation\Excel backup\Homeowners vs renters rate 2000 - 6.30.2012.xls" /><tag n="Sheet" v="HomeownershipRate" /><tag n="Range" v="" /><tag n="EmbeddedName" v="Worksheet in Silver Bay Roadshow Presentation v85.pptx 3" /></tags>CREDIT CONSTRAINTS, A SECULAR PREFERENCE TOWARDS RENTING AND LOW SINGLE-FAMILY RENTAL SUPPLY SUGGEST STRONG RENTAL DEMAND 34.6% 2.85 |
|
|
HIGH CORRELATION BETWEEN RENTS AND HPA SUGGEST STRONG FUTURE RENTAL INCREASES -8% -6% -4% -2% 0% 2% 4% 6% 8% -25% -20% -15% -10% -5% 0% 5% 10% 15% JAN-07 MAR-07 MAY-07 JUL-07 SEP-07 NOV-07 JAN-08 MAR-08 MAY-08 JUL-08 SEP-08 NOV-08 JAN-09 MAR-09 MAY-09 JUL-09 SEP-09 NOV-09 JAN-10 MAR-10 MAY-10 JUL-10 SEP-10 NOV-10 JAN-11 MAR-11 MAY-11 JUL-11 SEP-11 NOV-11 JAN-12 MAR-12 MAY-12 JUL-12 SEP-12 NOV-12 HOME PRICES LISTING RENTS LAGGED 12 MONTHS - RIGHT AXIS HOME PRICES PUT UPWARD PRESSURE ON LISTING RENTS(1) (1) Source: CoreLogic January 2013. YEAR-OVER-YEAR CHANGE YEAR-OVER-YEAR CHANGE, 12 MONTH LAG - LEFT AXIS |
|
|
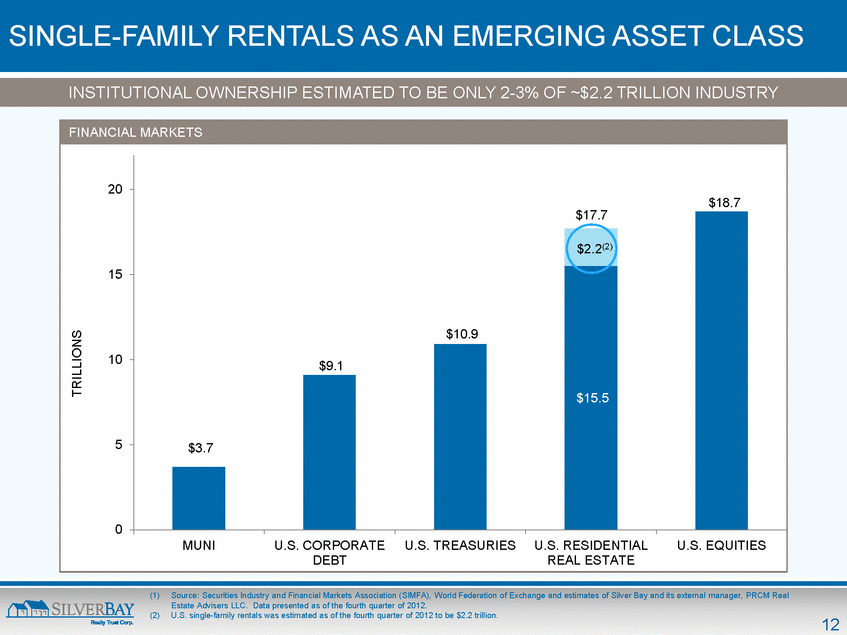
$17.7 SINGLE-FAMILY RENTALS AS AN EMERGING ASSET CLASS $15.5 $3.7 $9.1 $10.9 $2.2(2) $18.7 0 5 10 15 20 MUNI U.S. CORPORATE DEBT U.S. TREASURIES U.S. RESIDENTIAL REAL ESTATE U.S. EQUITIES TRILLIONS INSTITUTIONAL OWNERSHIP ESTIMATED TO BE ONLY 2-3% OF ~$2.2 TRILLION INDUSTRY (1) Source: Securities Industry and Financial Markets Association (SIMFA), World Federation of Exchange and estimates of Silver Bay and its external manager, PRCM Real Estate Advisers LLC. Data presented as of the fourth quarter of 2012. (2)U.S. single-family rentals was estimated as of the fourth quarter of 2012 to be $2.2 trillion. FINANCIAL MARKETS |
|
|
STRATEGY AND EXECUTION |
|
|
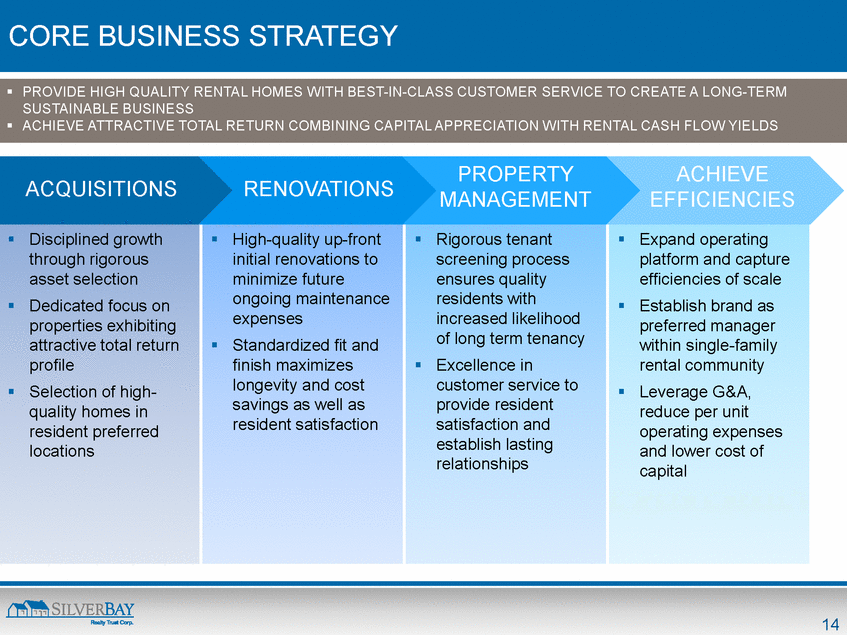
CORE BUSINESS STRATEGY . PROVIDE HIGH QUALITY RENTAL HOMES WITH BEST-IN-CLASS CUSTOMER SERVICE TO CREATE A LONG-TERM SUSTAINABLE BUSINESS . ACHIEVE ATTRACTIVE TOTAL RETURN COMBINING CAPITAL APPRECIATION WITH RENTAL CASH FLOW YIELDS ACQUISITIONS RENOVATIONS PROPERTY MANAGEMENT ACHIEVE EFFICIENCIES . Disciplined growth through rigorous asset selection . Dedicated focus on properties exhibiting attractive total return profile . Selection of high- quality homes in resident preferred locations . High-quality up-front initial renovations to minimize future ongoing maintenance expenses . Standardized fit and finish maximizes longevity and cost savings as well as resident satisfaction . Rigorous tenant screening process ensures quality residents with increased likelihood of long term tenancy . Excellence in customer service to provide resident satisfaction and establish lasting relationships . Expand operating platform and capture efficiencies of scale . Establish brand as preferred manager within single-family rental community . Leverage G&A, reduce per unit operating expenses and lower cost of capital |
|
|
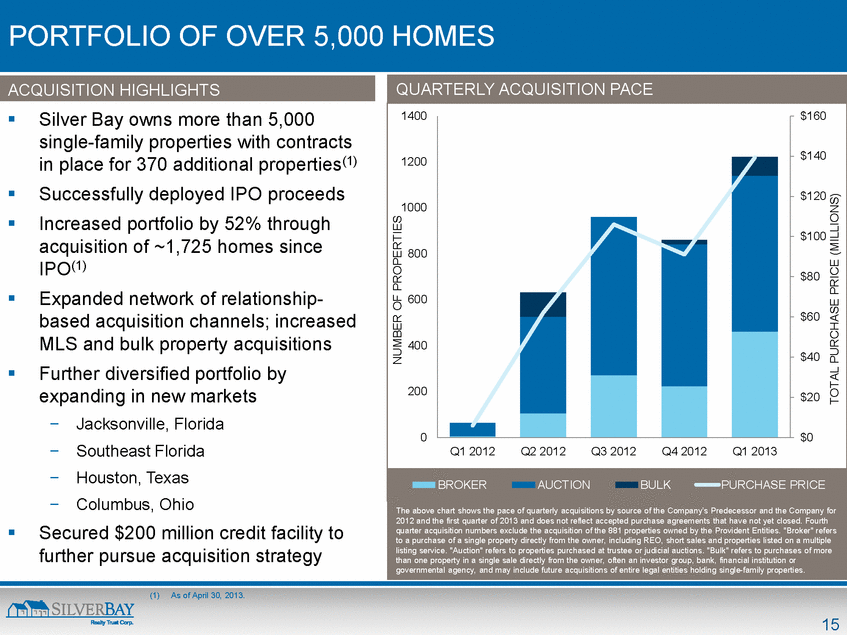
PORTFOLIO OF OVER 5,000 HOMES . Silver Bay owns more than 5,000 single-family properties with contracts in place for 370 additional properties(1) . Successfully deployed IPO proceeds . Increased portfolio by 52% through acquisition of ~1,725 homes since IPO(1) . Expanded network of relationship- based acquisition channels; increased MLS and bulk property acquisitions . Further diversified portfolio by expanding in new markets - Jacksonville, Florida - Southeast Florida - Houston, Texas - Columbus, Ohio . Secured $200 million credit facility to further pursue acquisition strategy QUARTERLY ACQUISITION PACE The above chart shows the pace of quarterly acquisitions by source of the Company’s Predecessor and the Company for 2012 and the first quarter of 2013 and does not reflect accepted purchase agreements that have not yet closed. Fourth quarter acquisition numbers exclude the acquisition of the 881 properties owned by the Provident Entities. "Broker" refers to a purchase of a single property directly from the owner, including REO, short sales and properties listed on a multiple listing service. "Auction" refers to properties purchased at trustee or judicial auctions. "Bulk" refers to purchases of more than one property in a single sale directly from the owner, often an investor group, bank, financial institution or governmental agency, and may include future acquisitions of entire legal entities holding single-family properties. $0 $20 $40 $60 $80 $100 $120 $140 $160 0 200 400 600 800 1000 1200 1400 Q1 2012 Q2 2012 Q3 2012 Q4 2012 Q1 2013 TOTAL PURCHASE PRICE (MILLIONS) NUMBER OF PROPERTIES BROKER AUCTION BULK PURCHASE PRICE ACQUISITION HIGHLIGHTS (1) As of April 30, 2013. |
|
|
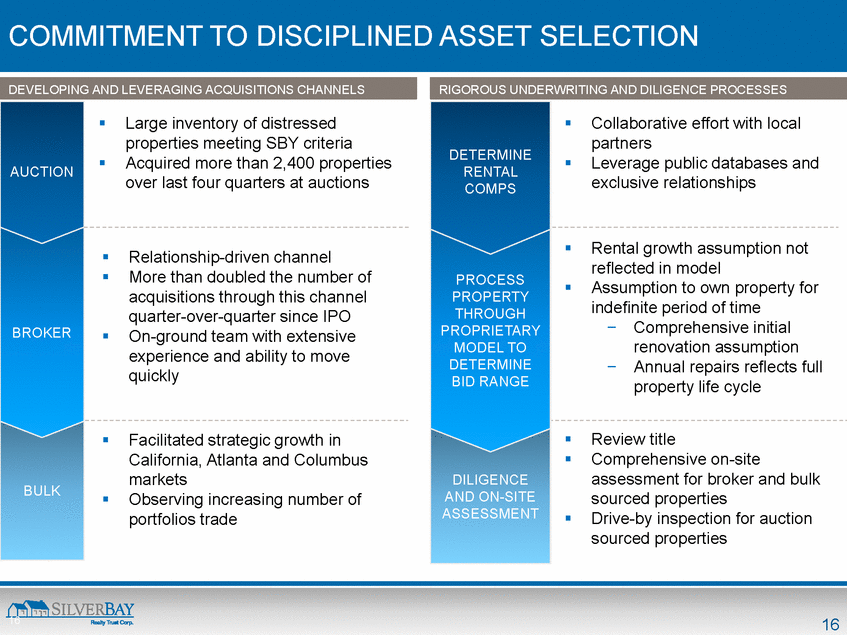
COMMITMENT TO DISCIPLINED ASSET SELECTION BULK DILIGENCE AND ON-SITE ASSESSMENT AUCTION BROKER . Large inventory of distressed properties meeting SBY criteria . Acquired more than 2,400 properties over last four quarters at auctions . Relationship-driven channel . More than doubled the number of acquisitions through this channel quarter-over-quarter since IPO . On-ground team with extensive experience and ability to move quickly . Facilitated strategic growth in California, Atlanta and Columbus markets . Observing increasing number of portfolios trade RIGOROUS UNDERWRITING AND DILIGENCE PROCESSES DEVELOPING AND LEVERAGING ACQUISITIONS CHANNELS . Collaborative effort with local partners . Leverage public databases and exclusive relationships PROCESS PROPERTY THROUGH PROPRIETARY MODEL TO DETERMINE BID RANGE . Rental growth assumption not reflected in model . Assumption to own property for indefinite period of time - Comprehensive initial renovation assumption - Annual repairs reflects full property life cycle . Review title . Comprehensive on-site assessment for broker and bulk sourced properties . Drive-by inspection for auction sourced properties DETERMINE RENTAL COMPS |
|
|
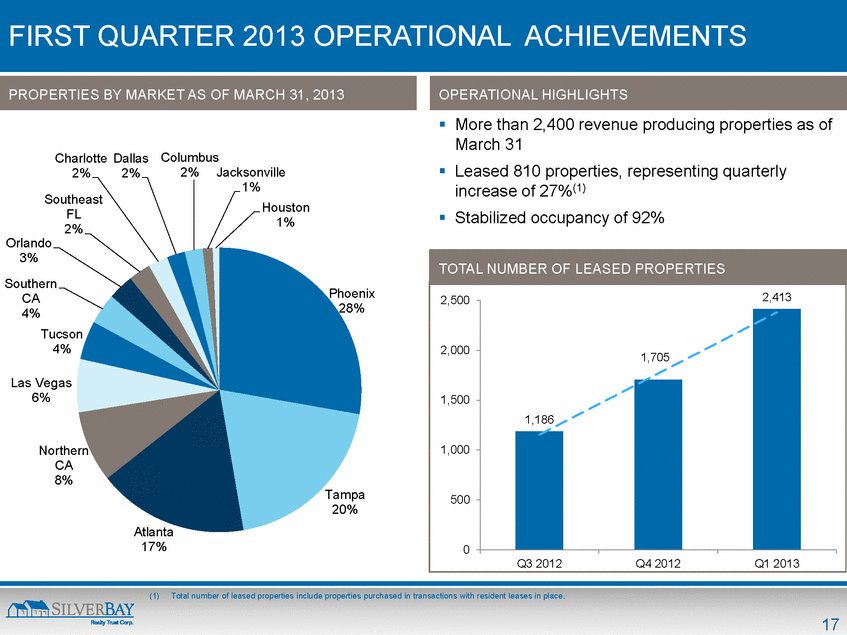
FIRST QUARTER 2013 OPERATIONAL ACHIEVEMENTS PROPERTIES BY MARKET AS OF MARCH 31, 2013 (1) Total number of leased properties include properties purchased in transactions with resident leases in place. Phoenix 28% Tampa 20% Atlanta 17% Northern CA 8% Las Vegas 6% Tucson 4% Southern CA 4% Orlando 3% Southeast FL 2% Charlotte 2% Dallas 2% Columbus 2% Jacksonville 1% Houston 1% TOTAL NUMBER OF LEASED PROPERTIES 1,186 1,705 2,413 0 500 1,000 1,500 2,000 2,500 Q3 2012 Q4 2012 Q1 2013 . More than 2,400 revenue producing properties as of March 31 . Leased 810 properties, representing quarterly increase of 27%(1) . Stabilized occupancy of 92% OPERATIONAL HIGHLIGHTS |
|
|
APPENDIX |
|
|
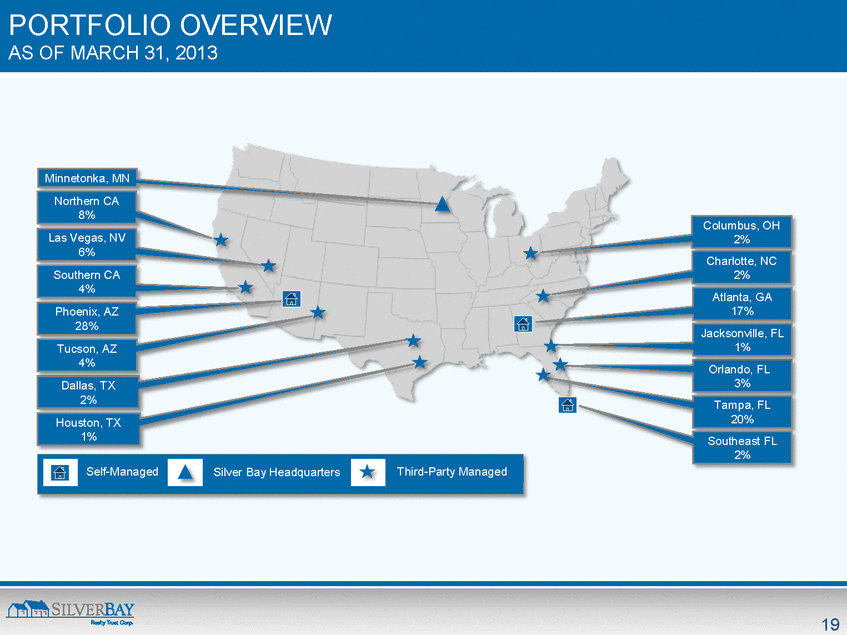
PORTFOLIO OVERVIEW AS OF MARCH 31, 2013 http://upload.wikimedia.org/wikipedia/commons/thumb/e/e9/Blank_US_Map_48states.svg/450px-Blank_US_Map_48states.svg.pngCharlotte, NC 2% Atlanta, GA 17% Orlando, FL 3% Phoenix, AZ 28% Northern CA 8% Las Vegas, NV 6% Dallas, TX 2% Tucson, AZ 4% Tampa, FL 20% Silver Bay Headquarters Southern CA 4% Jacksonville, FL 1% Southeast FL 2% Minnetonka, MN Columbus, OH 2% Self-Managed Houston, TX 1% Third-Party Managed |
|
|
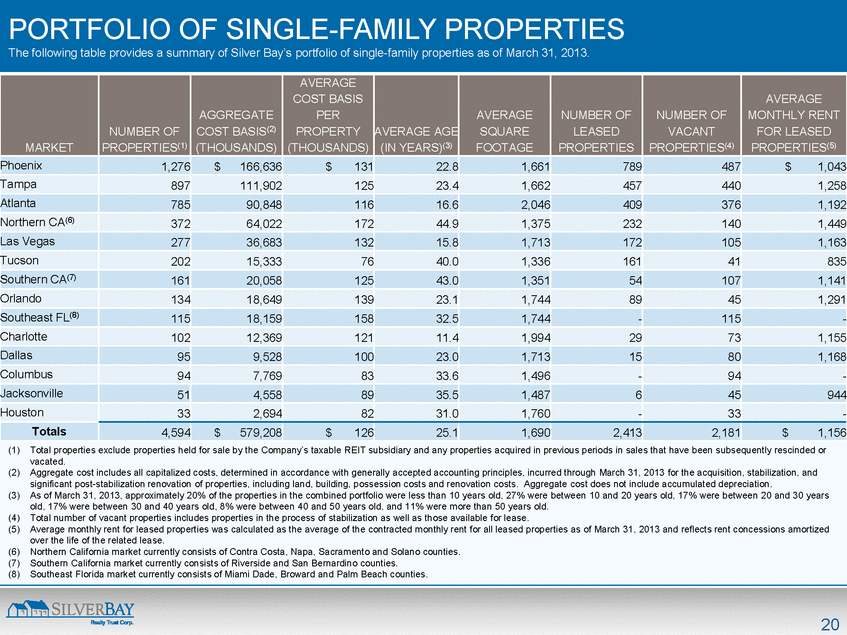
PORTFOLIO OF SINGLE-FAMILY PROPERTIES The following table provides a summary of Silver Bay’s portfolio of single-family properties as of March 31, 2013. (1) Total properties exclude properties held for sale by the Company’s taxable REIT subsidiary and any properties acquired in previous periods in sales that have been subsequently rescinded or vacated. (2) Aggregate cost includes all capitalized costs, determined in accordance with generally accepted accounting principles, incurred through March 31, 2013 for the acquisition, stabilization, and significant post-stabilization renovation of properties, including land, building, possession costs and renovation costs. Aggregate cost does not include accumulated depreciation. (3) As of March 31, 2013, approximately 20% of the properties in the combined portfolio were less than 10 years old, 27% were between 10 and 20 years old, 17% were between 20 and 30 years old, 17% were between 30 and 40 years old, 8% were between 40 and 50 years old, and 11% were more than 50 years old. (4) Total number of vacant properties includes properties in the process of stabilization as well as those available for lease. (5) Average monthly rent for leased properties was calculated as the average of the contracted monthly rent for all leased properties as of March 31, 2013 and reflects rent concessions amortized over the life of the related lease. (6) Northern California market currently consists of Contra Costa, Napa, Sacramento and Solano counties. (7) Southern California market currently consists of Riverside and San Bernardino counties. (8) Southeast Florida market currently consists of Miami Dade, Broward and Palm Beach counties. MARKET NUMBER OF PROPERTIES(1) AGGREGATE COST BASIS(2) (THOUSANDS) AVERAGE COST BASIS PER PROPERTY (THOUSANDS) AVERAGE AGE (IN YEARS)(3) AVERAGE SQUARE FOOTAGE NUMBER OF LEASED PROPERTIES NUMBER OF VACANT PROPERTIES(4) AVERAGE MONTHLY RENT FOR LEASED PROPERTIES(5) Phoenix 1,276 $ 166,636 $ 131 22.8 1,661 789 487 $ 1,043 Tampa 897 111,902 125 23.4 1,662 457 440 1,258 Atlanta 785 90,848 116 16.6 2,046 409 376 1,192 Northern CA(6) 372 64,022 172 44.9 1,375 232 140 1,449 Las Vegas 277 36,683 132 15.8 1,713 172 105 1,163 Tucson 202 15,333 76 40.0 1,336 161 41 835 Southern CA(7) 161 20,058 125 43.0 1,351 54 107 1,141 Orlando 134 18,649 139 23.1 1,744 89 45 1,291 Southeast FL(8) 115 18,159 158 32.5 1,744 - 115 - Charlotte 102 12,369 121 11.4 1,994 29 73 1,155 Dallas 95 9,528 100 23.0 1,713 15 80 1,168 Columbus 94 7,769 83 33.6 1,496 - 94 - Jacksonville 51 4,558 89 35.5 1,487 6 45 944 Houston 33 2,694 82 31.0 1,760 - 33 - Totals 4,594 $ 579,208 $ 126 25.1 1,690 2,413 2,181 $ 1,156 |
|
|
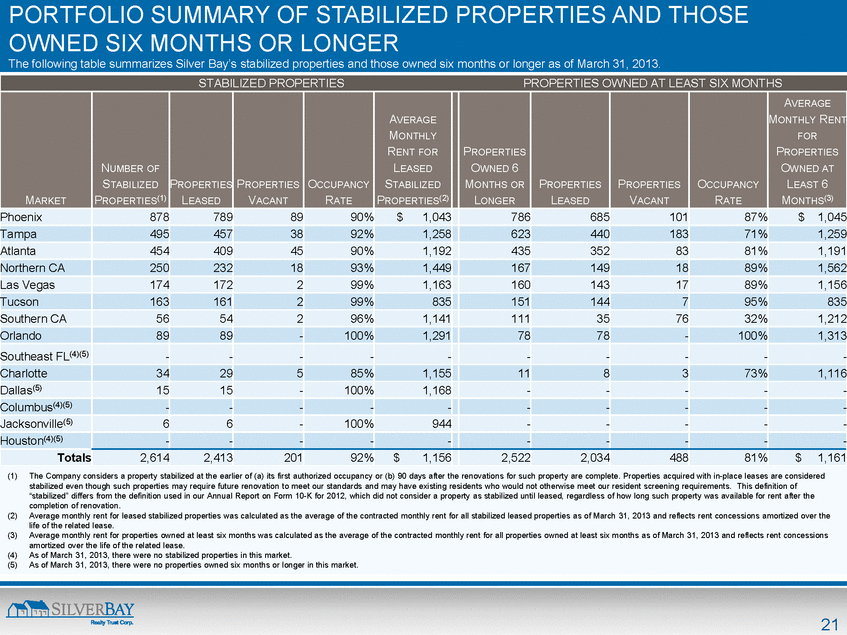
PORTFOLIO SUMMARY OF STABILIZED PROPERTIES AND THOSE OWNED SIX MONTHS OR LONGER The following table summarizes Silver Bay’s stabilized properties and those owned six months or longer as of March 31, 2013. STABILIZED PROPERTIES PROPERTIES OWNED AT LEAST SIX MONTHS MARKET NUMBER OF STABILIZED PROPERTIES(1) PROPERTIES LEASED PROPERTIES VACANT OCCUPANCY RATE AVERAGE MONTHLY RENT FOR LEASED STABILIZED PROPERTIES(2) PROPERTIES OWNED 6 MONTHS OR LONGER PROPERTIES LEASED PROPERTIES VACANT OCCUPANCY RATE AVERAGE MONTHLY RENT FOR PROPERTIES OWNED AT LEAST 6 MONTHS(3) Phoenix 878 789 89 90% $ 1,043 786 685 101 87% $ 1,045 Tampa 495 457 38 92% 1,258 623 440 183 71% 1,259 Atlanta 454 409 45 90% 1,192 435 352 83 81% 1,191 Northern CA 250 232 18 93% 1,449 167 149 18 89% 1,562 Las Vegas 174 172 2 99% 1,163 160 143 17 89% 1,156 Tucson 163 161 2 99% 835 151 144 7 95% 835 Southern CA 56 54 2 96% 1,141 111 35 76 32% 1,212 Orlando 89 89 - 100% 1,291 78 78 - 100% 1,313 Southeast FL(4)(5) - - - - - - - - - - Charlotte 34 29 5 85% 1,155 11 8 3 73% 1,116 Dallas(5) 15 15 - 100% 1,168 - - - - - Columbus(4)(5) - - - - - - - - - - Jacksonville(5) 6 6 - 100% 944 - - - - - Houston(4)(5) - - - - - - - - - - Totals 2,614 2,413 201 92% $ 1,156 2,522 2,034 488 81% $ 1,161 (1) The Company considers a property stabilized at the earlier of (a) its first authorized occupancy or (b) 90 days after the renovations for such property are complete. Properties acquired with in-place leases are considered stabilized even though such properties may require future renovation to meet our standards and may have existing residents who would not otherwise meet our resident screening requirements. This definition of “stabilized” differs from the definition used in our Annual Report on Form 10-K for 2012, which did not consider a property as stabilized until leased, regardless of how long such property was available for rent after the completion of renovation. (2) Average monthly rent for leased stabilized properties was calculated as the average of the contracted monthly rent for all stabilized leased properties as of March 31, 2013 and reflects rent concessions amortized over the life of the related lease. (3) Average monthly rent for properties owned at least six months was calculated as the average of the contracted monthly rent for all properties owned at least six months as of March 31, 2013 and reflects rent concessions amortized over the life of the related lease. (4) As of March 31, 2013, there were no stabilized properties in this market. (5) As of March 31, 2013, there were no properties owned six months or longer in this market. |
|
|
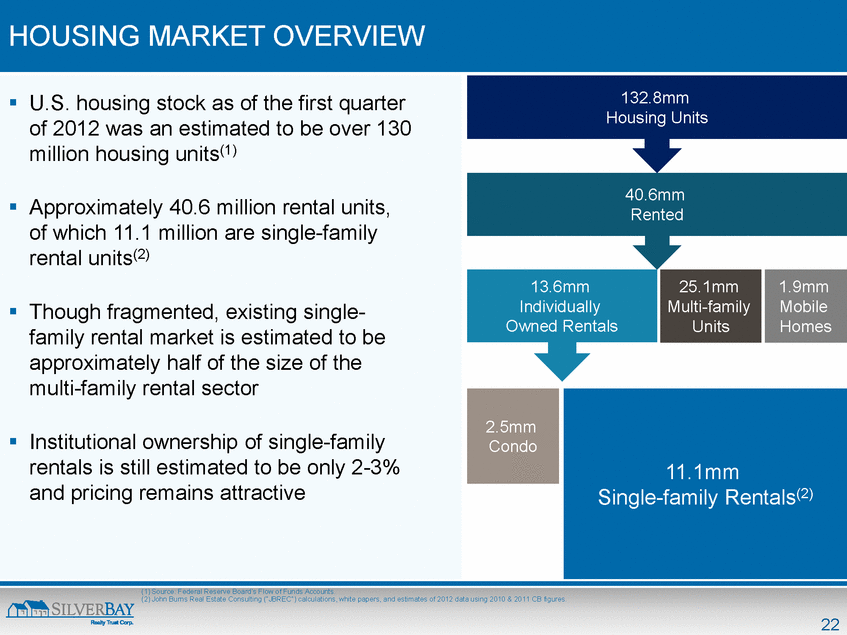
HOUSING MARKET OVERVIEW . U.S. housing stock as of the first quarter of 2012 was an estimated to be over 130 million housing units(1) . Approximately 40.6 million rental units, of which 11.1 million are single-family rental units(2) . Though fragmented, existing single- family rental market is estimated to be approximately half of the size of the multi-family rental sector . Institutional ownership of single-family rentals is still estimated to be only 2-3% and pricing remains attractive (1) Source: Federal Reserve Board’s Flow of Funds Accounts. (2) John Burns Real Estate Consulting (“JBREC”) calculations, white papers, and estimates of 2012 data using 2010 & 2011 CB figures. 132.8mm Housing Units 40.6mm Rented 13.6mm Individually Owned Rentals 25.1mm Multi-family Units 2.5mm Condo 11.1mm Single-family Rentals(2) 1.9mm Mobile Homes |
|
|
601 CARLSON PARKWAY | SUITE 250 | MINNETONKA | MN | 55305 P: 952.358.4400 | E: INVESTORS@SILVERBAYMGMT.COM |

