Attached files
| file | filename |
|---|---|
| 8-K - FORM 8-K - Tower Group International, Ltd. | d491391d8k.htm |
 1.
Presentation
Exhibit 99.1 |
 1
Forward-Looking Statements
This document contains certain forward-looking information about Tower
Group, Inc. (“Tower”) and Canopius Holdings Bermuda Limited
(“Canopius Bermuda”), which will be renamed Tower Group International, Ltd. (“Tower Ltd.”) following the merger transaction
described herein . Forward-looking information about Tower or Tower Ltd. is
intended to be covered by the safe harbor for “forward- looking
statements” provided by the Private Securities Litigation Reform Act
of 1995. Forward-looking statements may be made directly in this
document and may include statements for the period after the completion of the merger. Representatives of Tower
and Canopius Bermuda may also make forward-looking statements.
Forward-looking statements are statements that are not
historical
facts.
Words
such
as
“expect,”
“believe,”
“will,”
“may,”
“anticipate,”
“plan,”
“estimate,”
“intend,”
“should,”
“can,”
“likely,”
“could”
and similar expressions are intended to identify forward-looking
statements. These statements include statements about the expected
benefits
of
the
merger,
pro
forma
financial
information
and
financial
information
for
future
periods,
the
expected
ownership of Tower Ltd., information about the combined company’s
objectives, plans and expectations, the likelihood of satisfaction of
certain conditions to the completion of the merger and whether and when the merger will be completed. Forward-
looking statements are not guarantees of performance. These statements are
based upon the current beliefs and expectations of the management of
Tower and / or Canopius Bermuda, as applicable, and are subject to risks and uncertainties that could cause
actual results to differ materially from those expressed in, or implied or
projected by, the forward-looking information and statements. For a
more complete discussion of the risks and uncertainties relating to Tower, the merger and this private placement,
investors are urged to read the information under the caption and in
Tower’s Annual Report on Form 10-K to be filed after the date
hereof.
In
light
of
these
risks,
uncertainties,
assumptions
and
factors,
the
results
anticipated
by
the
forward-looking
statements
discussed
in
this document or made by representatives of Tower or Canopius Bermuda may not
occur. Readers are cautioned not to place undue reliance on these
forward-looking statements, which speak only as of the date hereof or, in the case of statements made by
representatives of Tower or Canopius Bermuda, on the date those statements are
made. All subsequent written and oral forward- looking
statements
concerning
the
merger
or
the
combined
company
or
other
matters
addressed
in
this
document
and
attributable
to Tower or Canopius Bermuda or any person acting on their behalf are expressly
qualified in their entirety by the cautionary statements contained or
referred to in this section. Except to the extent required by applicable law or regulation, neither Tower nor
Canopius Bermuda undertakes any obligation to update or publish revised
forward-looking statements to reflect events or circumstances after
the date hereof or the date of the forward-looking statements or to reflect the occurrence of unanticipated
events.
Notes on Non-GAAP Financial Measures
(1)
(2)
Operating income excludes realized gains and losses, acquisition-related
transaction costs and the results of the reciprocal business, net of
tax. Operating income is a common measurement for property and casualty insurance companies. We
believe this presentation enhances the understanding of our results of
operations by highlighting the underlying profitability of our
insurance business. Additionally, these measures are a key internal management performance standard. Operating
earnings per share is operating income divided by diluted weighted average
shares outstanding. Operating return on equity is annualized operating
income divided by average common stockholders' equity.
Gross premiums written and managed include gross premiums written through
Tower’s insurance subsidiaries and produced as managing general
agent on behalf of other insurance companies, including the reciprocal business. |
 2
High Level Pro Forma Corporate Chart
Tower Group
Delaware Holding Company
*CP Re used solely to reinsure US Pool
Tower
Stockholders
100%
US Pool*
Castle Point Re*
(“CP Re”)
CURRENT STRUCTURE
New
Shareholders
Tower
Shareholders
Tower Ltd.
Bermuda Holding Company
Bermuda Operations
and CP Re business
Tower and its
Subsidiaries
U.S. Operations
EXPECTED POST MERGER STRUCTURE |
 3
Investment Highlights
Tower’s demonstrated track record of growth and profitability
•
169% total return since IPO in 2004
•
•
Strong operating performance (19.9% ROE) from 2005 to 2008
•
Began deploying capital from CastlePoint acquisition in 2009
•
Implemented
five
year
plan
(2010
to
2014)
to
build
a
diversified
international
specialty
insurance
company
•
Gain access to Bermuda platform to provide efficient source of capital
•
Final key step to completing five year plan (2010 to 2014)
Attractive entry point for new investors
•
0.78x P/B and 1.2x P/TB, based on 2012 year end book value
•
3.8%
dividend
yield
vs.
1.2%
yield
of
the
SNL
U.S.
Insurance
P&C
Index
Significant insider ownership
•
$89 MM (approximately 9% pro forma ownership)
Source: SNL Financial. Market data as of February 22, 2013;
*Excludes catastrophic storm losses and reserve development
Since 2010, Tower’s core domestic franchise has generated a stable 10%
- 12% ROE* (15% - 17%
ROTE)*
Canopius transaction expected in 2014 to result in 13% - 15% Pro Forma
ROE
(forecasted 18% - 20% ROTE)
Outperformed S&P 500 by 2.6x and SNL U.S. Insurance P&C Index by
1.6x |
 4
Overview of Tower
Diversified international specialty P&C insurance company
•
Rated “A-”
by A.M. Best
•
Top 50 P&C insurance company
•
20 offices nationwide with over 1,400 employees
Diversified product offering in U.S.
•
Commercial General: 34%*
»
Comprehensive product offering to small business owners
•
Commercial Specialty: 28%*
»
Narrowly focused specialty insurance and reinsurance products
•
Personal Lines: 38%*
»
Home and auto
Canopius transaction enables further growth in international markets
•
Expands existing relationships with Lloyd’s syndicates
•
Bermuda platform provides capital to support Tower and third parties
* Percentage of total premium for the year ended 12/31/12
|
 5
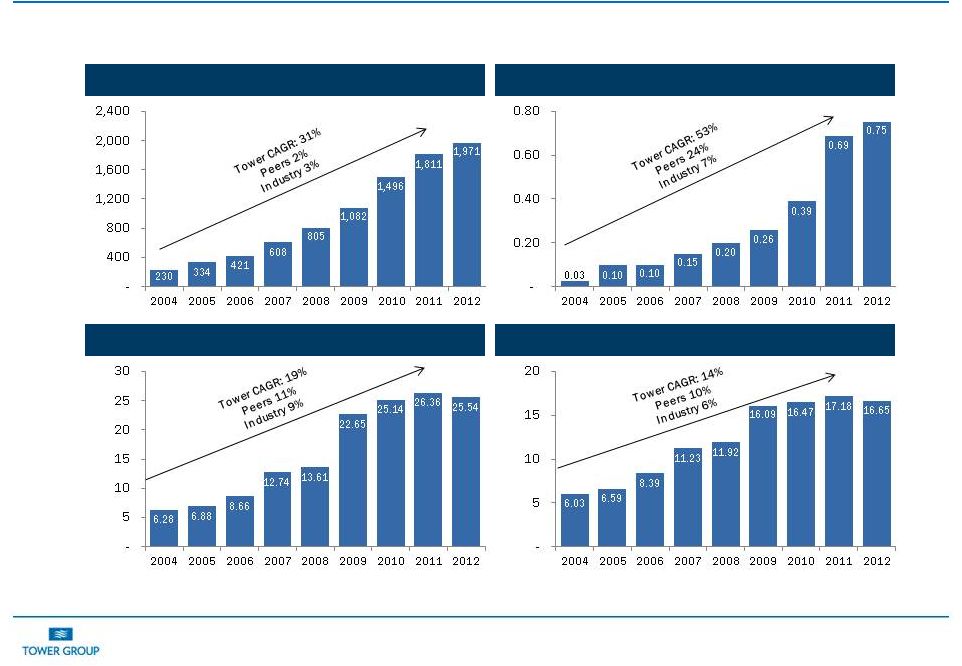
Strong and Consistent Track Record of Profitable Growth
Source: SNL Financial. Industry data based upon SNL U.S. Insurance P&C
Index. Component companies and weighting based on SNL U.S. Insurance P&C Index as of 2/22/2013. CAGR TWGP period
through 12/31/12, industry CAGR through 12/31/11
Book Value per Share
Tangible Book Value per Share
Gross Written Premiums ($MM)
Dividends Per Share
Peers consist of AFG, AFSI, HCC, MKL, NAVG, RLI, SIGI, THG, UFCS, WRB.
|
 6
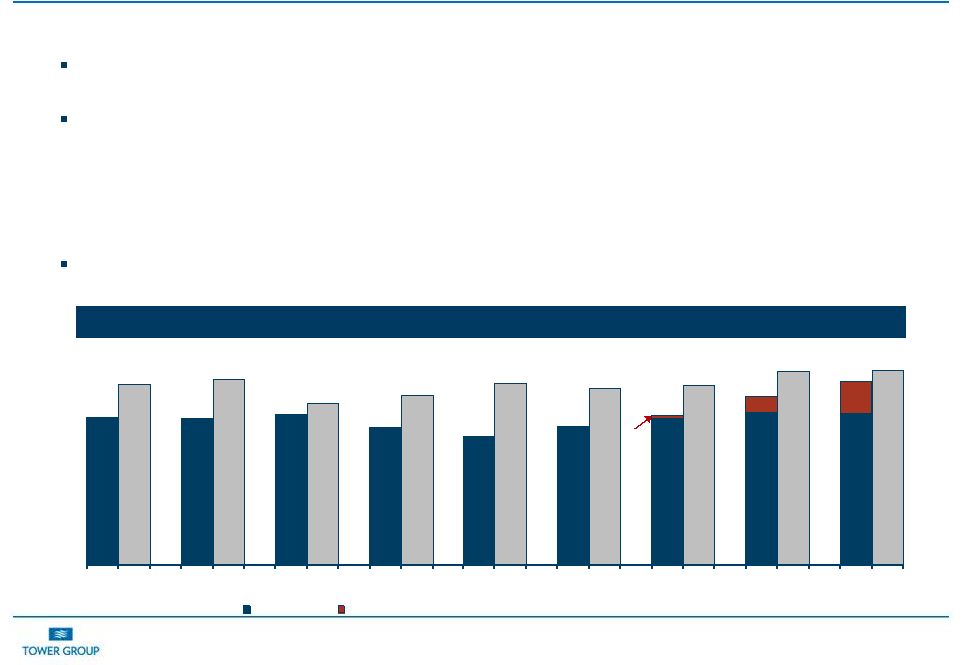
Superior Underwriting Track Record
Tower has outperformed the P&C industry loss ratio by approximately 10
points Positive loss ratio trends
•
Changes to business mix
•
Corrective underwriting actions
•
Claims cost reduction
•
Improving pricing environment
2Q12 reserve charge solidifies balance sheet
•
No adverse development expected
Note: P&C Industry Data source A.M. Best; 2012 P&C industry data
A.M. Best estimate Loss Ratio
59.4%
72.7%
58.8%
74.4%
60.3%
65.2%
55.2%
68.0%
51.7%
73.1%
55.6%
70.8%
58.7%
72.1%
61.1%
77.9%
60.9%
78.0%
1.5%
6.5%
12.6%
60.2%
67.6%
73.5%
2004
2005
2006
2007
2008
2009
2010
2011
2012
Core Tower
Tower Catastrophe & Reserve Development
P&C Industry |
 7
Tower Phase I (2005 -
2008)
Strong operating performance
•
Average ROE 19.9%
•
Average combined ratio 86.6%
•
Gross premiums written & produced CAGR of 34%
Efficient use of capital
•
$805 MM in premiums written and managed with $319 MM of capital
•
Generated significant fee income through management fees and ceding
commissions Geographic and product specialization
•
Heavily concentrated in Northeast
•
Primarily focused on small commercial products
Note: Average combined ratio and average ROE metrics are premium weighted |
 8
Tower Phase II (2009 -
2012)
Challenging market conditions
•
Financial crisis and prolonged economic downturn
•
Competitive market conditions
•
Low interest rate environment
•
Unprecedented catastrophic events for Tower (e.g., Irene and Sandy)
CastlePoint merger in 2009 and successful deployment of capital
•
Changes to the business model used in phase I
Tower acquired CastlePoint, a Bermuda reinsurer
Significant increase in capital and share count
Capital increased from $319 MM to $819 MM ($1B by year-end 2009)
Share count increased from 23M to 45M shares by year end 2009
•
Deployed excess capital through organic growth and acquisitions
Premiums written and managed increased from $805MM in 2008 to $2B in
2012 Since 2010, Tower’s ROE met 10 to 12% ROE near term ROE target
excluding reserve charges and catastrophe losses (Irene and Sandy)
|
 9
Strategic Five-Year Plan (2010 to 2014)
In 2010 Tower began a five year plan to create a diversified international
specialty insurance company
Expand geographically
Tower expanded geographically from the Northeast to U.S and internationally
with expansion into Lloyds’ market
Broaden product platform in U.S. to add personal and specialty lines
Implemented organic growth initiative to expand products, improve existing and
create new businesses Enhance business model
Increase fee income from managing other insurance companies
(reciprocals) Gain access to Bermuda platform
Improve systems infrastructure
Recent infrastructure investments should allow Tower to achieve greater scale
and grow profitably and efficiently without significant future capital
expenditures Improve ROE
10 to 12% historical ROE in U.S. since 2010*
13 to 15% expected within 18 months of merger closing*
Merger with CHBL is final key step in executing five-year plan
*Excluding reserve charges and catastrophe losses
|
 10
Canopius Merger Background
CHBL’s parent company, Canopius Group Limited (“CGL”), is a
privately owned (re)insurance group with operations at Lloyd’s and
Bermuda •
2011 GPW of approximately $1 billion
•
Quota share relationship with Tower since July 2011
Tower invested $75 MM in CGL in August 2012
•
10.7% ownership stake
•
Option to merge with subsidiary of CHBL
•
Increased
existing
quota
share
of
CGL’s
Lloyd’s
business
for
2013
–
2015
•
CGL assistance in creating Tower’s Lloyd’s platform
Strategic benefits:
•
Bermuda platform
•
Access to profitable specialty and international business
•
Reduce acquisition or start-up related execution risk of creating a
Lloyd’s syndicate •
Take advantage of the leverage opportunities offered by Lloyd’s through
quota share arrangements Bermuda operations
•
Quota share Lloyd’s business from CGL and third parties
•
CHBL acquired for tangible book value plus the value of retained
business (currently estimated to be ~$8 MM)
»
Tower determines CHBL tangible book value and retained business as part of
pre-closing restructuring |
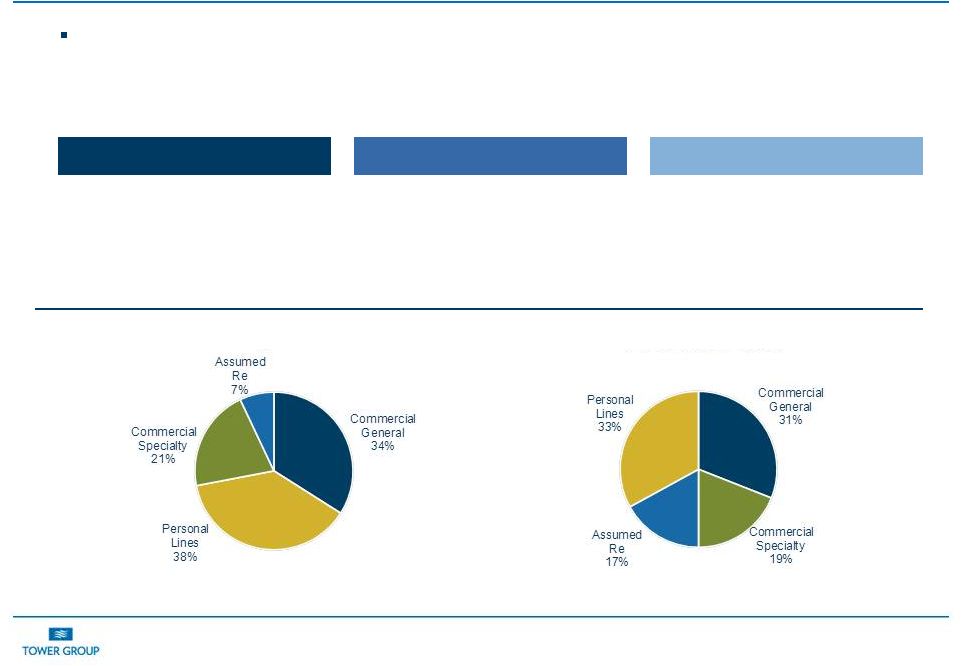 11
Tower Phase III (2013 -
2014)
Merger is final key step in executing five-year plan
•
EPS accretion expected to be *~8% in 2013 and projected to be ~21% in 2014
•
Expected to increase ROE to 13% -
15% within 18 months
•
Creates a global specialty insurance company
U.S.
Bermuda
Lloyd’s
•
Continue expansion of commercial,
personal and specialty businesses
•
Establish more efficient platform to
support U.S. and international
business
•
Expand existing relationships with
Lloyd’s syndicates to access $38B
market
•
Expect to create Tower Lloyd’s
managing agency
* Assumes transaction closes in March 2013
** Percentage of total 2012 premiums
Existing Tower**
2013 Pro Forma
Assumed Re 2012 and 2013 Pro Forma Premiums contain 71% and 87% of quota share of
Lloyds’ business respectively |
 12
Organic Growth Strategy
Transitioning from acquisitions to organic growth
•
Completed deployment of excess capital by making accretive acquisitions
•
Implemented organic growth initiative in 2011
»
Develop and customize products for different industries and customer groups as
well as key clients »
Improve existing business units and create new business units
»
Improve technical expertise in functions related to generating organic growth
(ex. Product and business development)
Organic growth is working
•
Newly created business units are driving organic growth
»
Assumed reinsurance and customized solutions generated $158 MM of new written
premiums in 2011 and $195 MM in 2012
•
Talent depth
»
Recently hired highly experienced underwriting managers with national markets
and product experience to provide leadership for personal and
commercial lines businesses –
Expected expansion into affluent personal lines market and various commercial
niche markets expected in 2013 •
Currently developing a pipeline of customized products for select agents
•
Recently formed strategic alliances with Lloyd’s syndicates and key
business partners to significantly improve product and analytical
expertise in specialty markets |
 13
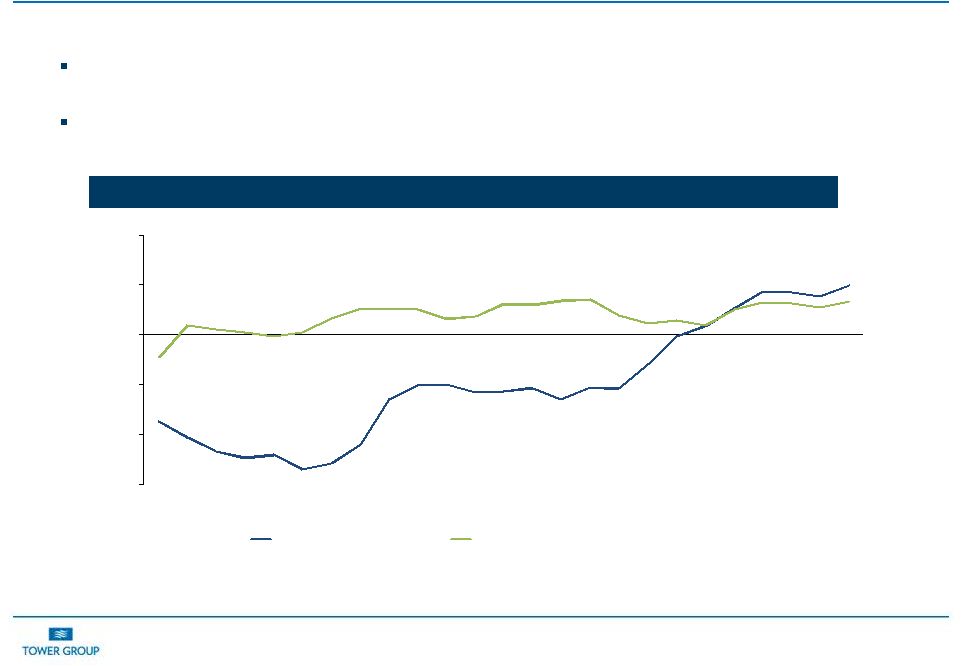
Improving Market Conditions
Positive commercial U.S. pricing beginning in mid 2011
Sandy expected to serve as a catalyst for further pricing improvements in the
Northeast P&C Pricing Trends
-15.0%
-10.0%
-5.0%
0.0%
5.0%
10.0%
4Q06
2Q07
4Q07
2Q08
4Q08
2Q09
4Q09
2Q10
4Q10
2Q11
4Q11
2Q12
4Q12
Commercial insurance
Tenants' and household insurance
Source: The Council of Insurance Agents & Brokers for commercial lines;
Bureau of Labor Statistics for Tenants’ and household insurance. |
  14
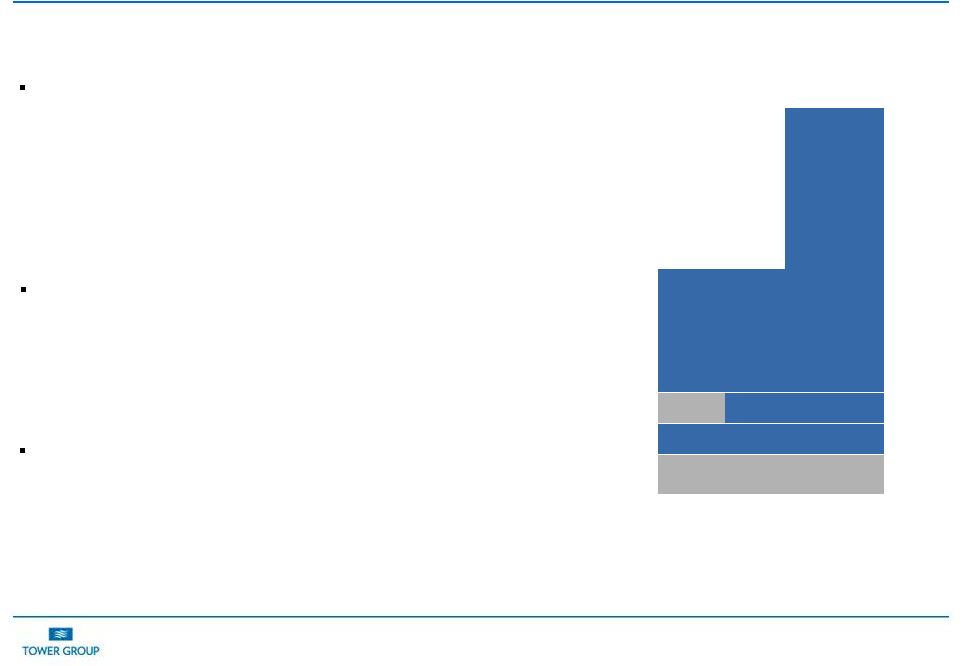
Sandy Losses Limited by Reinsurance and Underwriting
•
Tower’s share of industry losses is expected to be less than half of its
1.8% market share of insured homes and businesses affected
»
Irene 1% of industry loss despite 3.9% market share
»
After tax loss includes $2.7 million investment loss from Canopius
•
Through February 24, 2013, Tower has closed 93.7% of the 30,511 claims that
its stock companies and reciprocal exchanges received as a result of
Superstorm Sandy.
•
Irene and Sandy were two of the four major windstorms to make landfall in the
Tri-state area in last 100 years
•
Losses from Sandy and Irene represent the two single largest loss events in
Tower’s history
»
Prior to Irene and Sandy, Tower’s total aggregate historical catastrophe
losses were less than Irene losses
•
Continued geographical diversification
•
Utilization of reciprocals to reduce Tower’s earnings volatility
•
Further strengthen reinsurance program
100% Tower
100% Reinsured
30% Tower
70% Reinsured
$925 MM
$225 MM
$150 MM
$75 MM
$0 MM
100% Reinsured
Limited catastrophe activity in the Northeast prior to Irene and
Sandy
Sandy’s pre-tax net loss estimated to be $119.0 million,
after-tax net loss estimated to be $80.1
million
Expect future impact of catastrophe losses on Tower’s earnings
to be more limited |
 15
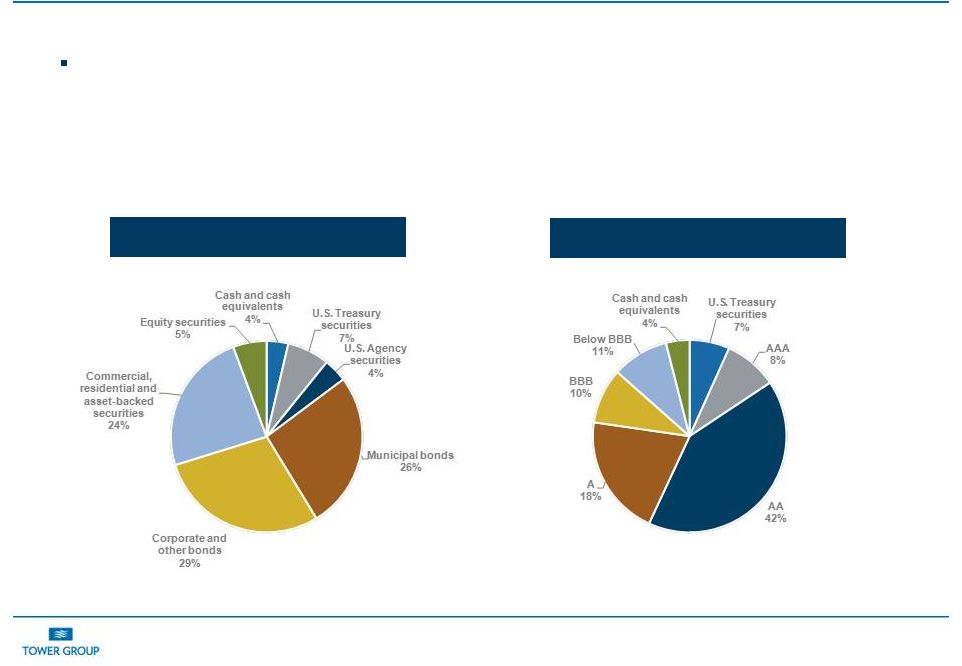
Our investment portfolio had net unrealized pre-tax gains of $135 MM at
December 31, 2012 attributable to Tower shareholders
•
Fixed income average quality of A+
•
Duration of 4.6 years
•
Tax equivalent book yield of 4.5%
Asset Allocation
Asset Quality
Note: All numbers exclude the reciprocal exchanges. Data as of December 31,
2012 Highly Rated Investments |
 16
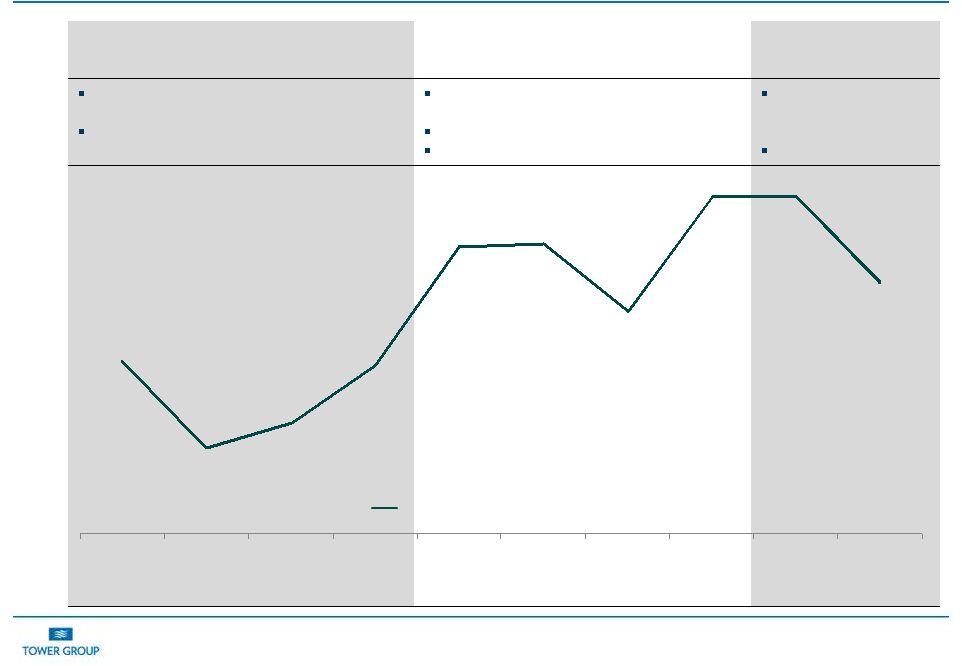
Phase I
Phase II
Phase III
Achieve scale for predominately commercial
business
Fee income
Significant investments in infrastructure to
support two additional businesses
Acquisition integration
Shift in claims expense to underwriting
Leverage
infrastructure through
organic growth
Increasing fee income
Leveraging Existing Infrastructure
Premium
($MM)
335
421
608
805
1,082
1,496
1,811
1,971
2,270
2,577
Premium is gross written premium and produced, expense ratios are adjusted to
reflect 1/1/2011 adoption of new guidance for DAC reporting 32%
29%
30%
32%
35%
35%
33%
36%
36%
34%
2005
2006
2007
2008
2009
2010
2011
2012
2013 E
2014 E
Expense Ratio Excluding Reciprocals |
 17
Earnings Outlook
Merger is expected to be ~8% accretive to 2013 EPS
Projected to be ~21% accretive in 2014
Capital Fully
Deployed
13 -
15% ROE
12.0% ROE
Pro Forma EPS on a Tower equivalent basis. Assumes merger transaction closes in
March 2013 $2.63
($0.50)
$0.49
$0.14
$0.09
$2.85
$3.75
Base 2013
Dilution
Bermuda
Platform
Efficiency
Additional
Investment
Income
Additional
Underwriting
Earnings
Pro Forma 2013
Pro Forma 2014 |
 18
ROE Drivers
Note: 2013 and 2014 forecast assumes merger transaction closes in March
2013 2012
2013
2014
Operating Combined Ratio
109.0%
97.8%
95.5% - 97.5%
Operating Leverage
1.5x
1.4x
1.5x
Underwriting ROE
-13.7%
3.3%
3.8% - 6.8%
Investment Leverage
2.3x
2.3x
2.3x
Investment Yield
4.7%
4.6%
4.6%
Investment ROE
10.9%
10.8%
10.9%
Contribution from Fee Income
1.0%
1.8%
1.7%
Contribution from Corporate Overhead & Debt
-3.7%
-2.3%
-2.4%
Pre-Tax ROE
-5.5%
13.6%
14% - 17%
Tax Rate
N/A
11.5%
7.3%
Adjusted Operating ROE
10.1%
12.0%
13% - 15%
Impact of Storms and Adverse Development
-12.8%
Operating Return on Equity
-2.7%
12.0%
13% - 15%
Adjusted Return on Tangible Equity
15.0%
17.3%
18% - 20%
Pro Forma Estimates
2014 forecasted ROTE is expected to be 18% - 20%
|
 19
Summary
Completed investment in infrastructure to build diversified commercial, specialty
and personal lines platform
•
Since
2010,
domestic
franchise
has
generated
a
stable
10%
-
12%
ROE
(15%
to
17%
ROTE)*
Merger is a key final step to creating a diversified international specialty
insurance company •
Further expands international and specialty business
•
Gains access to Bermuda platform to provide efficient source of capital
•
Completed business platform expected to yield 13% -
15% ROE in 2014 (forecasted 18% to 20% ROTE)
Attractive entry point for new investors
•
0.78x P/B and 1.2x P/TB
•
3.8% dividend yield vs. 1.2% yield of the SNL U.S. Insurance P&C
Index
Significant insider ownership
•
$89 MM (approximately 9%
pro forma ownership)
Source: SNL Financial. Market data as of February 22, 2012; Tower financial
data as of 12/31/2012 *Excludes catastrophic storm losses and adverse
development. |