Attached files
| file | filename |
|---|---|
| EX-99.1 - EX-99.1 - Allison Transmission Holdings Inc | d488770dex991.htm |
| 8-K - 8-K - Allison Transmission Holdings Inc | d488770d8k.htm |
 Q4
2012 Earnings Release February 19, 2013
1
Lawrence Dewey, Chairman, President & Chief Executive Officer
David Graziosi, Executive Vice President & Chief Financial Officer
Exhibit 99.2 |
 Safe
Harbor Statement 2
The following information contains, or may be deemed to contain, “forward-looking
statements” (as defined in the U.S. Private Securities Litigation Reform Act of
1995). Most forward-looking statements contain words that identify them as
forward-looking, such as “may”, “plan”, “seek”, “will”,
“expect”, “intend”, “estimate”, “anticipate”, “believe”, “project”,
“opportunity”, “target”, “goal”, “growing” and
“continue” or other words that relate to future events, as opposed to past or current
events. By their nature, forward-looking statements are not statements of historical facts and involve risks and
uncertainties because they relate to events and depend on circumstances that may or may not occur in
the future. These statements give Allison Transmission’s current expectation of
future events or its future performance and do not relate directly to historical or current
events or Allison Transmission’s historical or future performance. As such, Allison
Transmission’s future results may vary from any expectations or goals expressed in, or implied
by, the forward-looking statements included in this presentation, possibly to a material
degree. Factors which may cause the actual results to differ materially from those anticipated
at the time the forward-looking statements are made include, but are not limited to: risks
related to our substantial indebtedness; our participation in markets that are competitive; general economic and
industry conditions; our ability to prepare for, respond to and successfully achieve our objectives
relating to technological and market developments and changing customer needs; the failure of
markets outside North America to increase adoption of fully-automatic transmissions; the
discovery of defects in our products, resulting in delays in new model launches, recall
campaigns and/or increased warranty costs and reduction in future sales or damage to our brand and
reputation; the concentration of our net sales in our top five customers and the loss of any one of
these; risks associated with our international operations; brand and reputational risks; our
intention to pay dividends; and labor strikes, work stoppages or similar labor disputes, which
could significantly disrupt our operations or those of our principal customers.
Allison Transmission cannot assure you that the assumptions made in preparing any of the
forward-looking statements will prove accurate or that any long-term financial goals
will be realized. All forward-looking statements included in this presentation speak only
as of the date made, and Allison Transmission undertakes no obligation to update or revise
publicly any such forward-looking statements, whether as a result of new information, future
events, or otherwise. In particular, Allison Transmission cautions you not to place undue
weight on certain forward-looking statements pertaining to potential growth opportunities,
long-term financial goals or the value we currently ascribe to certain tax attributes set forth
herein. Actual results may vary significantly from these statements. Allison Transmission’s
business is subject to numerous risks and uncertainties, which may cause future results of
operations to vary significantly from those presented herein. Important factors that could cause
actual results to differ materially are discussed in Allison Transmission’s prospectus
filed pursuant to Rule 424(b)(1) under the Securities Act of 1933, as amended, dated as of
March 15, 2012 and Quarterly Reports on Form 10-Q. |
 Non-GAAP Financial Information
3
We use Adjusted net income, Adjusted EBITDA, Adjusted EBITDA excluding technology-related license
expenses, Adjusted EBITDA margin, Adjusted EBITDA margin excluding technology-related
license expenses, adjusted free cash flow and free cash flow to evaluate our performance
relative to that of our peers. In addition, the Senior Secured Credit Facility has certain covenants that
incorporate Adjusted EBITDA. However, Adjusted net income, Adjusted EBITDA, Adjusted EBITDA excluding
technology-related license expenses, Adjusted EBITDA margin, Adjusted EBITDA margin
excluding technology-related license expenses, adjusted free cash flow and free cash flow
are not measurements of financial performance under GAAP, and these metrics may not be comparable
to similarly titled measures of other companies. Adjusted net income is calculated as the sum of net
income (loss), interest expense, net, income tax expense, trade name impairment and
amortization of intangible assets, less cash interest, net and cash income taxes, and adjusted
for certain non-recurring items. Adjusted EBITDA is calculated as the sum of Adjusted net income, cash interest,
net, cash income taxes, depreciation of property, plant and equipment and other adjustments as defined
by the Senior Secured Credit Facility and as further described below. Adjusted EBITDA excluding
technology-related license expenses is calculated as Adjusted EBITDA less
technology-related license expenses. Adjusted EBITDA margin is calculated as Adjusted EBITDA divided by
net sales. Adjusted EBITDA margin excluding technology-related license expenses is calculated as
Adjusted EBITDA excluding technology-related license expenses divided by net sales. Free
cash flow is calculated as net cash provided by operating activities less capital expenditures.
Adjusted free cash flow is free cash flow adjusted for non-recurring items.
We use Adjusted net income to measure our overall profitability because it better reflects our cash
flow generation by capturing the actual cash interest paid and cash taxes paid rather than our
interest expense and tax expense as calculated under GAAP and excludes the impact of the
non-cash annual amortization of certain intangible assets that were created at the time of the Acquisition
Transaction. We use Adjusted EBITDA, Adjusted EBITDA excluding technology-related license
expenses, Adjusted EBITDA margin and Adjusted EBITDA margin excluding technology-related
license expenses to evaluate and control our cash operating costs and to measure our operating
profitability. We use adjusted free cash flow and free cash flow to evaluate the amount of cash generated by
the business that, after the capital investment needed to maintain and grow our business, can be used
for strategic opportunities, including investing in our business and strengthening our balance
sheet. We believe the presentation of Adjusted net income, Adjusted EBITDA, Adjusted EBITDA
excluding technology-related license expenses, Adjusted EBITDA margin, Adjusted EBITDA
margin excluding technology-related license expenses, adjusted free cash and free cash flow
enhances our investors' overall understanding of the financial performance and cash flow of our
business.
You should not consider Adjusted net income, Adjusted EBITDA, Adjusted EBITDA excluding
technology-related license expenses, Adjusted EBITDA margin, Adjusted EBITDA margin
excluding technology-related license expenses, adjusted free cash flow and free cash flow
as an alternative to net income (loss), determined in accordance with GAAP, as an indicator of operating performance, or
as an alternative to net cash provided by operating activities, determined in accordance with GAAP, as
an indicator of Allison’s cash flow.
|
 Call
Agenda Q4 2012 Performance
2013 Guidance
4 |
 Q4
2012 Performance Summary 5
($ in millions)
Q4 2012
Q4 2011
% Variance
Net Sales
$487
$516
(5.6%)
Gross Margin %
39.9%
43.1%
(320 bps)
Adjusted Net Income
(1)
$46
$52
(12.6%)
Adjusted Free Cash Flow
(1)
$82
$30
171.0%
Commentary
Net
Sales:
the
decrease
was
principally
driven
by
reduced
demand
for
North
America
Off-Highway
transmission
products
and
service parts due to continued weakness in natural gas pricing.
Partially offsetting these declines were increased net sales
in the global On-Highway and Outside North America Off-Highway end markets
and price increases on certain products. Strength in the Outside North
America Off-Highway end market was principally driven by higher demand in the energy and
mining sectors.
Gross
Margin:
excluding
$15
million
of
costs
and
charges
to
conclude
a
new
five-year
labor
agreement
with
the
UAW
Local
933
the
gross
margin
decreased
30
bps.
Adjusted Net Income: the decrease was principally driven by decreased net sales, $16
million of costs and charges to conclude a new five-year labor agreement
with the UAW Local 933, a $9 million product warranty charge for specific product
issues and
higher
product
initiatives
spending
partially
offset
by
favorable
material
costs,
price
increases
on
certain
products,
reduced
global
commercial
spending
activities
and
decreased
cash
interest
expense
as
a
result
of
debt
refinancing
and
repayments.
Adjusted Free Cash Flow: the increase was principally driven by increased net cash
provided by operating activities and reduced capital expenditures. The
decrease in capital expenditures was principally driven by prior year spending for the India
expansion and the timing of investments in productivity and replacement programs
partially offset by increased product initiatives spending.
(1)
See Appendix for a reconciliation of Adjusted Net Income and Adjusted Free Cash
Flow. |
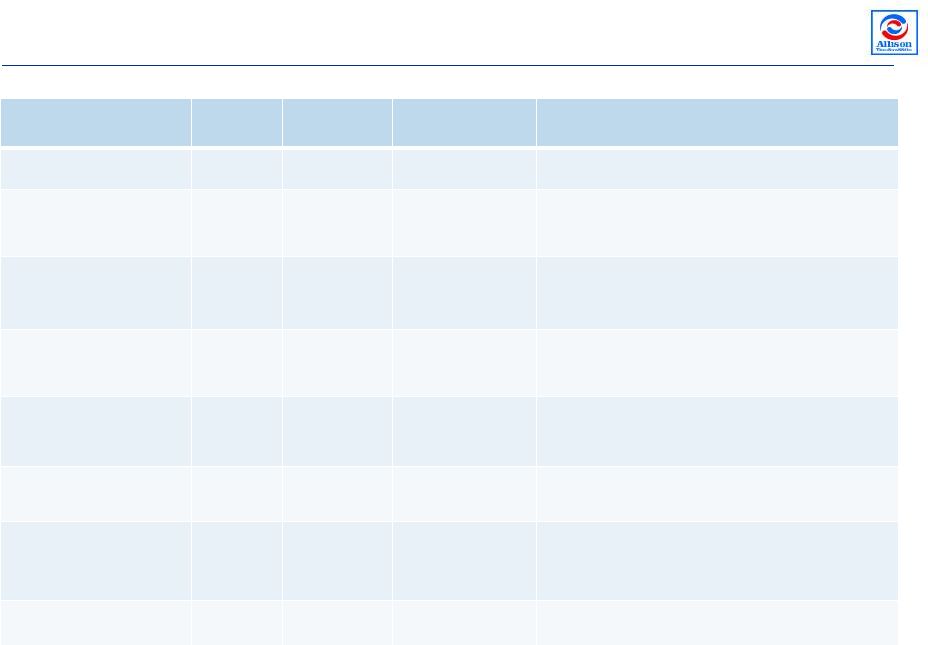 Q4
2012 Sales Performance End Markets
Q4 2012
Q4 2011
% Variance
Commentary
North America On-Hwy
$188
$175
7%
Increased commercial vehicle production
North America Hybrid-
Propulsion Systems for
Transit Bus
$32
$27
19%
Timing of orders
North America Off-Hwy
$17
$70
(76%)
Decreased demand from hydraulic fracturing
applications due to weakness in natural gas
pricing
Military
$74
$70
6%
Increased wheeled product requirements for
several programs partially offset by lower
tracked products demand
Outside North America
On-Hwy
$73
$70
4%
Strength in China partially offset by weakness in
Latin America while Europe was flat
Outside North America
Off-Hwy
$30
$19
58%
Stronger demand from the energy and mining
sectors
Service Parts, Support
Equipment & Other
$73
$85
(14%)
Reduced demand for North America Off-Hwy
and On-Hwy service parts partially offset by
price increases on certain products
Total
$487
$516
(6%)
6
($ in millions) |
 Q4
2012 Financial Performance 7
($ in millions)
Q4 2012
Q4 2011
$ Var
% Var
Commentary
Net Sales
$487.0
$516.1
($29.1)
(5.6%)
Decreased demand for North America Off-Highway and Service
Parts, Support Equipment & Other products partially offset by
increased demand for North America On-Highway, Outside North
America Off-Highway, North America Hybrid-Propulsion Systems
for Transit Bus, Military, Outside North America On-Highway
products and price increases on certain products
Cost of Sales
$292.8
$293.7
$0.9
0.3%
Gross Profit
$194.2
$222.4
($28.2)
(12.7%)
Decreased net sales and $15 million of costs and charges to
conclude a new five-
year labor agreement with the UAW Local
933 partially offset by favorable material costs and price
increases on certain products
Operating Expenses
Selling, general and administrative expenses
$112.0
$109.9
($2.1)
(1.9%)
Product warranty charge of $9 million and UAW Local 933
contract signing bonus charge of $1 million partially offset by
reduced global commercial spending activities
Engineering –
research and development
$28.1
$26.0
($2.1)
(8.1%)
Increased product initiatives spending
Total operating expenses
$140.1
$135.9
($4.2)
(3.1%)
Operating Income
$54.1
$86.5
($32.4)
(37.5%)
Interest Expense, net
($35.6)
($33.4)
($2.2)
(6.6%)
Lower favorable mark-to-market adjustments for interest rate
derivatives and increased Term B Loan margins due to
refinancing partially offset by the favorable impact of debt
repayments and repurchases
Other Income (Expense), net
$2.6
($3.3)
$5.9
178.8%
Increased grant income and reduction in loss associated with
debt redemptions
Income Before Income Taxes
$21.1
$49.8
($28.7)
(57.6%)
Higher U.S. taxable income
Income Tax Expense
($9.9)
($5.3)
($4.6)
(86.8%)
Net Income
$11.2
$44.5
($33.3)
(74.8%)
Diluted Earnings Per Share
$0.06
$0.24
($0.18)
(75.0%)
2012: 186.2M shares; 2011: 183.3M shares
(1)
See Appendix for a reconciliation from Net Income (Loss).
Adjusted EBITDA
(1)
$131.9
$156.2
($24.3)
(15.6%)
Adjusted Net Income
(1)
$45.8
$52.4
($6.6)
(12.6%) |
 Q4
2012 Cash Flow Performance 8
($ in millions)
Q4 2012
Q4 2011
$ Variance
% Variance
Commentary
Net Cash Provided by
Operating Activities
$112
$72
$40
55.9%
Reduced Operating Working
Capital investment principally
driven by lower net sales,
conclusion of 2012 labor
negotiations, debt repayments
and accruals for labor
negotiations charges partially
offset by lower net income
CapEx
$30
$42
($12)
(27.9%)
Completion of India facility
expansion (Q4 2011) and timing
of investments in productivity and
replacement programs partially
offset by product initiatives
spending
Adjusted Free Cash
Flow
(1)
$82
$30
$52
171.0%
Increased net cash provided by
operating activities and reduced
capital expenditures
($ in millions)
Q4 2012
Q4 2011
$ Variance
% Variance
Commentary
Operating Working
Capital
(2)
Percentage of
LTM Sales
8.8%
8.7%
N/A
10 bps
Cash Paid for Interest
$47
$68
($21)
(31.3%)
Reduced Sr. Notes interest
partially offset by Sr. Secured
Credit Facility refinancing
Cash Paid for Income
Taxes
$2
$1
$1
149.3%
Increased taxable income
(1)
See Appendix for a reconciliation of Adjusted Free Cash Flow.
(2)
Operating
Working
Capital
=
A/R
+
Inventory
–
A/P. |
 2013
Guidance - End Markets Commentary
9
Allison expects first quarter net sales to be significantly lower than the same period
in 2012 driven by considerably lower demand in the North America energy
sector’s hydraulic fracturing market, previously considered reductions in Military net sales and weaker Global On-
Highway
end
markets
entering
2013.
We
expect
that
the
majority
of
the
full
year
2013
net
sales
reduction
implied
by
the
midpoint
of
our
guidance will occur in the first quarter followed by growth in the Global
On-Highway end markets for the balance of the year. •
North America On-Highway
•
Moderated
market
recovery
rate:
somewhat
elevated
year
end
2012
vehicle
retail
inventory
levels,
November
2012
thru
January
2013
Allison
order
rates down year over year and OEMs reducing take rates/adding downtime in Q1
2013 •
2012 net sales $813 million; Expect 2013 net sales midpoint growth of 8
percent •
North America Hybrid-Propulsion Systems for Transit Bus
•
Municipal subsidy and spending constraints, engine emissions improvements and
non-hybrid alternative technologies that generally require a fully-
automatic transmission (e.g. xNG)
•
2012 net sales $115 million; Expect 2013 net sales midpoint reduction of 24
percent •
North America Off-Highway
•
Hydraulic fracturing market’s challenges continue for the first half of the
year given forecasts for low rig utilization rates and high levels of surplus
equipment attributable to weakness in natural gas pricing
•
2012 net sales $157 million; Expect 2013 net sales midpoint reduction of 68
percent •
Outside North America On-Highway
•
Growth in key developing markets through increased fully-automatic transmission
penetration and implementation of additional vehicle releases; limited
improvement in European end markets •
2012 net sales $290 million; Expect 2013 net sales midpoint growth of 5
percent •
Outside North America Off-Highway
•
2012 net sales $114 million; Expect 2013 net sales midpoint reduction of 11 percent
driven by weak mining sector capital spending forecasts •
Military
•
2012 net sales $305 million; Expect 2013 net sales midpoint reduction of 31 percent
driven by continued reductions in U.S. defense spending to longer term
averages experienced during periods without active conflicts •
Service Parts, Support Equipment & Other
•
2012 net sales $348 million; Expect 2013 net sales midpoint growth of 3 percent
driven by improved North America On-Highway service parts leveIs in the
second half of the year and increased support equipment sales commensurate with higher transmission unit volumes |
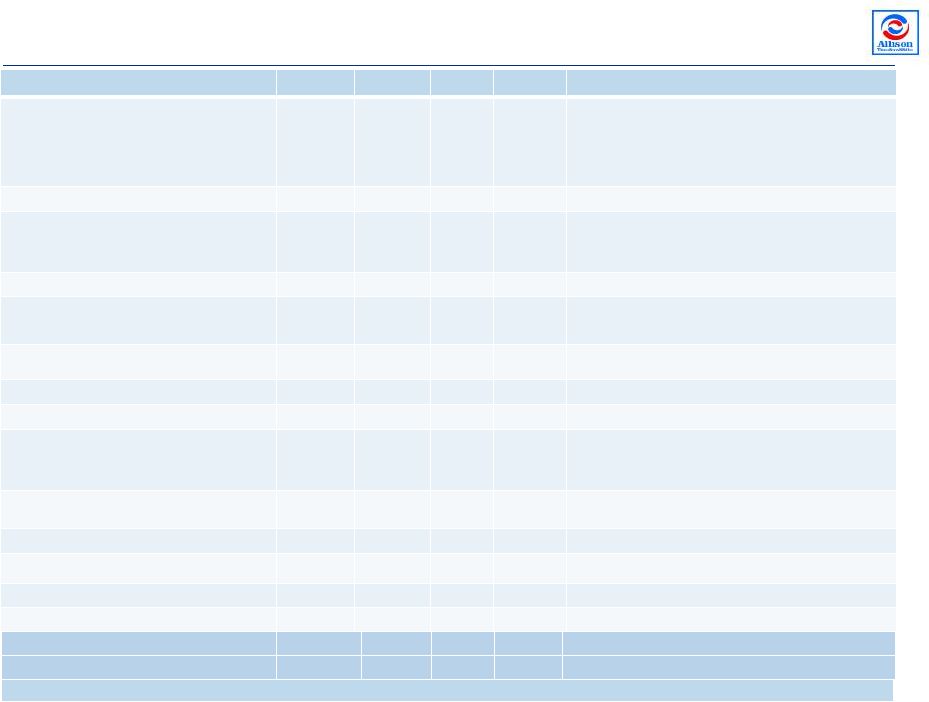
 2013 Guidance -
Summary
10
Guidance
Commentary
Net Sales Growth from 2012
(6) to (8) percent
Reflects a cautious approach given the continued heightened
level of uncertainty in our end markets and the lack of near-
term visibility and confidence in certain of our end markets.
Allison’s 2013 net sales outlook also incorporates an
assumed continuation of cyclically low levels of demand in
the North America energy sector’s hydraulic fracturing
market, the previously considered reductions in U.S. defense
spending to longer term averages experienced during
periods without active conflicts and lower demand in the
North America Hybrid-Propulsion Systems for Transit Bus
end market demand due to municipal spending constraints.
Accordingly we assume year over year net sales reductions
in the Global Off-Highway, Military and North America Hybrid-
Propulsion Systems for Transit Bus end markets partially
offset by year over year net sales growth in the Global On-
Highway and Service Parts, Support Equipment & Other end
markets.
Adjusted EBITDA Margin
32 to 34 percent
Principally driven by sales mix and volume timing
Adjusted Free Cash Flow
($ in millions)
$325 to $375
$1.75 to $2.01 per diluted share
CapEx
($ in millions)
Maintenance
New Product Programs
$60 to $65
$20 to $25
New product programs subject to timely completion of
development and sourcing milestones
Cash Income Taxes
($ in millions)
$15 to $20
U.S. income tax shield and net operating loss utilization
|
 11
APPENDIX
Non-GAAP Financial Information |
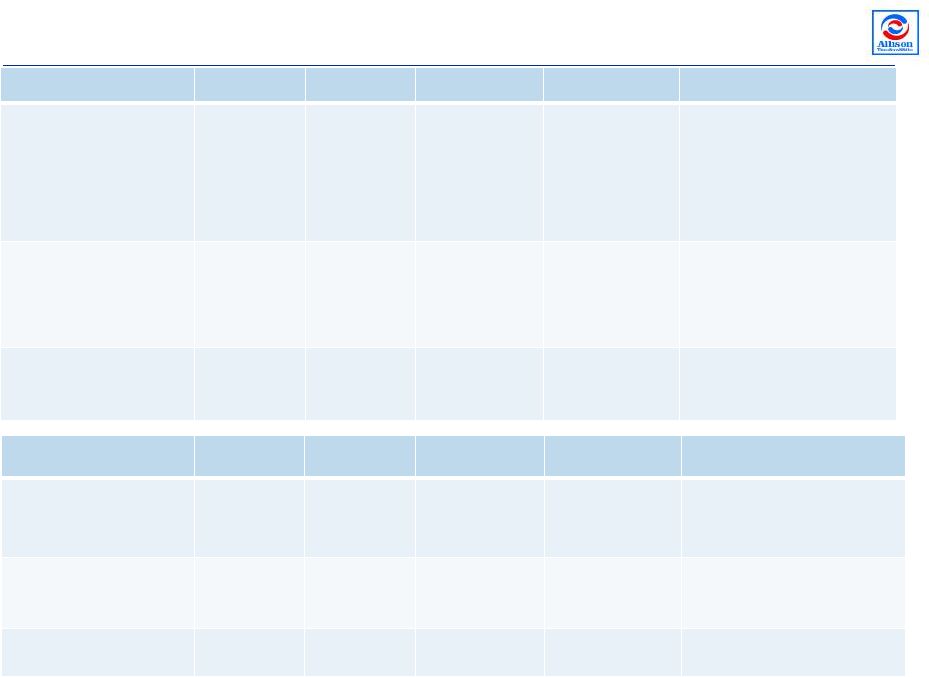
 Non-GAAP Reconciliations
(1 of 2)
Adjusted Net Income and Adjusted EBITDA reconciliation
(1) Includes charges or income related to legacy employee
benefits, shared income with General Motors, benefit plan adjustments, transitional costs to establish Allison as a stand-alone
entity, pension curtailment adjustments, employee stock compensation expense,
service fees paid to Allison’s Sponsors and an adjustment for the settlement of litigation which
originated with the Predecessor but was assumed by the Company as part of the
Acquisition Transaction. 12
$ in millions, Unaudited
2009
2010
2011
2012
2011
2012
Net (loss) income
($323.9)
$29.6
$103.0
$514.2
$44.5
$11.2
plus:
Interest expense,
net
234.2
277.5
217.3
151.2
33.4
35.6
Cash interest expense
(242.5)
(239.1)
(208.6)
(167.3)
(68.0)
(46.7)
Income tax expense (benefit)
41.4
53.7
47.6
(298.0)
5.3
9.9
Cash income
taxes
(5.5)
(2.2)
(5.8)
(10.7)
(0.7)
(1.7)
Fee to terminate services agreement with Sponsors
—
—
—
16.0
—
—
Technology-related investment expense
—
—
—
14.4
—
—
Initial public offering expenses
—
—
—
6.1
—
—
Trade name
impairment
190.0
—
—
—
—
—
Amortization of intangible
assets
155.9
154.2
151.9
150.0
37.9
37.5
Adjusted net
income
$49.6
$273.7
$305.4
$375.9
$52.4
$45.8
Cash interest expense
242.5
239.1
208.6
167.3
68.0
46.7
Cash income
taxes
5.5
2.2
5.8
10.7
0.7
1.7
Depreciation of property, plant and equipment
105.9
99.6
103.8
102.5
26.8
26.5
(Gain)/Loss on repurchases of long-term debt
(8.9)
(3.3)
16.0
22.1
4.7
0.5
Dual power inverter module extended coverage
11.4
(1.9)
—
9.4
—
—
UAW Local 933 signing bonus
—
—
—
8.8
—
8.8
Benefit plan re-measurement
—
—
—
2.3
—
—
Unrealized (gain) loss on hedge contracts
(5.8)
0.1
6.8
(0.9)
1.7
0.2
Premiums and expenses on tender offer for long-term debt
—
—
56.9
0.0
—
—
Restructuring charges
47.9
—
—
—
—
—
Reduction of supply contract liability
—
(3.4)
—
—
—
—
Other, net
(1)
53.2
10.9
8.6
7.0
1.9
1.7
Adjusted
EBITDA
$501.3
$617.0
$711.9
$705.1
$156.2
$131.9
Adjusted EBITDA excluding technology-related license expense
$501.3
$617.0
$711.9
$717.1
$156.2
$131.9
Net Sales
$1,766.7
$1,926.3
$2,162.8
$2,141.8
$516.1
$487.0
Adjusted EBITDA
margin
28.4%
32.0%
32.9%
32.9%
30.3%
27.1%
Adjusted EBITDA margin excl technology-related license expense
28.4%
32.0%
32.9%
33.5%
30.3%
27.1%
Three months ended
December 31,
For the year ended December 31, |
 $ in millions,
Unaudited 2009
2010
2011
2012
2011
2012
Net Cash Provided by Operating Activities
$168.7
$388.9
$469.2
$497.5
$71.9
$112.1
(Deductions) or Additions:
Long-lived assets
(88.2)
(73.8)
(96.9)
(123.9)
(41.6)
(30.0)
Fee to terminate services agreement with Sponsors
—
—
—
16.0
—
—
Technology-related license expense
—
—
—
12.0
—
—
2009 Non-Recurring Activity
(1)
61.0
—
—
—
—
—
Adjusted Free Cash Flow
$141.5
$315.1
$372.3
$401.6
$30.3
$82.1
Net
Sales
$1,766.7
$1,926.3
$2,162.8
$2,141.8
$516.1
$487.0
Adjusted Free Cash Flow (% to Net Sales)
8.0%
16.4%
17.2%
18.8%
5.9%
16.9%
Three months ended
December 31,
For the year ended December 31,
Adjusted Free Cash Flow reconciliation
(1)
Non-GAAP Reconciliations
(2 of 2)
13
2009 adjusted for certain non-recurring activity: (a) capitalized accrued interest on Senior
Toggle Notes ($29) million, (b) cash restructuring charge $51 million, (c) accounts payable
early payments $3 million, (d) delayed accounts receivable receipts $19 million and (e) Lehman
LIBOR swap settlement $17 million. |