Attached files
| file | filename |
|---|---|
| 8-K - FORM 8-K - CAPITAL ONE FINANCIAL CORP | d425528d8k.htm |
| EX-99.2 - FINANCIAL SUPPLEMENT - CAPITAL ONE FINANCIAL CORP | d425528dex992.htm |
| EX-99.1 - PRESS RELEASE - CAPITAL ONE FINANCIAL CORP | d425528dex991.htm |
 Third Quarter 2012
Results October 18, 2012
Exhibit 99.3 |
| Forward-Looking Statements
Please note that the following materials containing information regarding Capital One's financial
performance speak only as of the particular date or dates indicated in these materials. Capital
One does not undertake any obligation to update or revise any of the information contained herein whether as a result of new information,
future events or otherwise.
Certain statements in this presentation and other oral and written statements made by Capital One from
time to time are forward-looking statements, including those that discuss, among other
things: strategies, goals, outlook or other non-historical matters; projections, revenues, income, returns, expenses, capital measures,
accruals for claims in litigation and for other claims against Capital One, earnings per share or other
financial measures for Capital One; future financial and operating results; Capital One's plans,
objectives, expectations and intentions; the projected impact and benefits of the acquisitions of
ING Direct and HSBC's U.S. credit card business (the "Transactions"); and the assumptions
that underlie these matters. To the extent that any such information is
forward-looking, it is intended to fit within the safe harbor for forward-looking information provided by the Private
Securities Litigation Reform Act of 1995. Numerous factors could
cause Capital One's actual results to differ materially from those described in such forward-
looking statements, including, among other things: general economic and business conditions in the U.S.,
the U.K., Canada and Capital One’s local markets, including conditions affecting employment
levels, interest rates, consumer income and confidence, spending and savings that may affect consumer bankruptcies,
defaults, charge-offs and deposit activity; an increase or decrease in credit losses (including
increases due to a worsening of general economic conditions in the credit environment);
financial, legal, regulatory, tax or accounting changes or actions, including the impact of the Dodd-Frank Wall Street Reform and Consumer
Protection Act and the regulations promulgated thereunder and regulations governing bank capital and
liquidity standards, including Basel-related initiatives; the possibility
that
Capital
One
may
not
fully
realize
the
projected
cost
savings
and
other
projected
benefits
of
the
Transactions;
difficulties
and
delays
in
integrating
the
assets
and
businesses
acquired
in
the
Transactions;
business
disruption
following
the
Transactions;
diversion
of
management
time
on
issues
related
to
the
Transactions,
including
integration
of
the
assets
and
businesses
acquired;
reputational
risks
and
the
reaction
of
customers
and
counterparties
to
the
Transactions;
disruptions relating to the Transactions negatively impacting Capital One’s ability to maintain
relationships with customers, employees and suppliers; changes in asset quality and credit risk
as a result of the Transactions; the accuracy of estimates and assumptions Capital One uses to determine the fair value of assets
acquired
and
liabilities
assumed
in
the
Transactions,
and
the
potential
for
its
estimates
or
assumptions
to
change
as
additional
information
becomes
available
and
Capital One completes the accounting analysis of the Transactions; developments, changes or actions
relating to any litigation matter involving Capital One; the inability to sustain revenue and
earnings growth; increases or decreases in interest rates; Capital One’s ability to access the capital markets at attractive rates and
terms to capitalize and fund its operations and future growth; the success of Capital One’s
marketing efforts in attracting and retaining customers; increases or decreases in Capital
One’s aggregate loan balances or the number of customers and the growth rate and composition thereof, including increases or decreases
resulting from factors such as shifting product mix, amount of actual marketing expenses Capital One
incurs and attrition of loan balances; the level of future repurchase or indemnification requests
Capital One may receive, the actual future performance of mortgage loans relating to such
requests, the success rates of
claimants against it, any developments in litigation and the actual recoveries Capital One may make on
any collateral relating to claims against it; the amount and rate of deposit growth; changes in
the reputation of or expectations regarding the financial services industry or Capital One with respect to practices, products or
financial condition; any significant disruption in Capital One’s operations or technology platform;
Capital One’s ability to maintain a compliance infrastructure suitable for the nature of its
business; Capital One’s ability to control costs; the amount of, and rate of growth in, its expenses as its business develops or changes
or
as
it
expands
into
new
market
areas;
Capital
One’s
ability
to
execute
on
its
strategic
and
operational
plans;
any
significant
disruption
of,
or
loss
of
public
confidence in, the United States Mail service affecting Capital One’s response rates and consumer
payments; Capital One’s ability to recruit and retain experienced personnel to assist in the
management and operations of new products and services; changes in the labor and employment markets; fraud or misconduct by Capital
One’s customers, employees or business partners; competition from providers of products and
services that compete with Capital One’s businesses; and other risk factors set forth from
time to time in reports that Capital One files with the Securities and Exchange Commission, including, but not limited to, the Annual Report on
Form 10-K for the year ended December 31, 2011.
You should carefully consider the factors discussed above in evaluating these forward-looking
statements. All information in these slides is based on the consolidated results of Capital One
Financial Corporation, unless otherwise noted. A reconciliation of any non-GAAP financial measures included in this
presentation can be found in Capital One's most recent Current Report on Form 8-K filed October 18,
2012, available on its website at www.capitalone.com under "Investors."
|
| 3
October 18, 2012
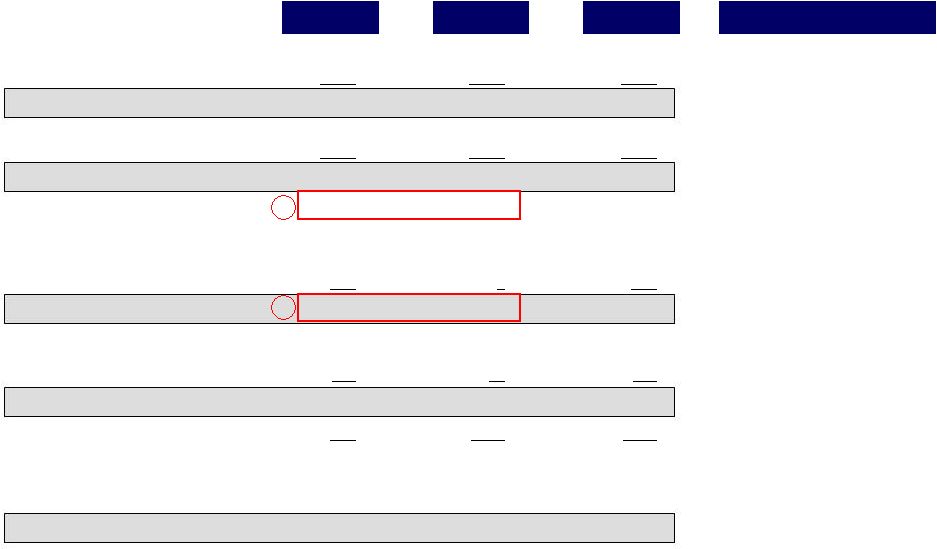
Third quarter net income was $1.18B, or $2.01 per common share,
including a full quarter of acquisitions and reduced credit impacts
•
Continued strong results evident in all three business segments
•
Relatively less impact from acquisition-related credit accounting
–
HSBC-related allowance build of $0.1B in Q3 vs. $1.2B in Q2
–
Other credit accounting impacts partially offsetting
•
Principal losses absorbed by HSBC mark of $176MM in Q3 vs. $251MM in Q2
•
Deal-related non-principal reserve build of $17MM in Q3 vs. $173MM in Q2
•
Ongoing impact from acquisition-related accounting on Q3’12 pre-
provision earnings; will decline gradually
–
Premium amortization on both deals of $133MM decreased revenue
–
PCCR amortization of $127MM included in operating expenses
–
Amortization on other intangibles and other assets related to acquisitions of $42MM
included in operating expenses |
 4
October 18, 2012
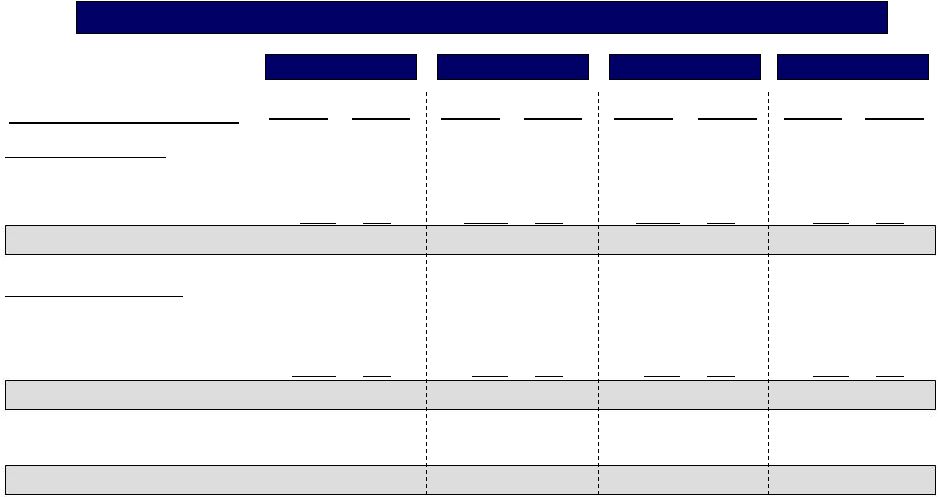
Third quarter results reflect continued solid business performance
Net interest income
Non-interest income
Total net revenue
Q3’12
Q2’12
Q1’12
Marketing
Operating expense
Non-interest expense
Net charge-offs
Allowance build/(release)
Provision for credit losses
Other
Pretax income from continuing operations
Income tax provision
Operating earnings, net of tax
Discontinued operations, net of tax
Pre-provision earnings
Net income
Diluted earnings per common share
4,646
1,136
5,782
316
2,729
3,045
2,737
887
156
(29)
1,014
1,723
535
1,188
(10)
1,178
$2.01
4,001
1,054
5,055
334
2,808
3,142
1,913
738
938
1
1,677
236
43
193
(100)
93
$0.16
3,414
1,521
4,935
321
2,183
2,504
2,431
780
(190)
(17)
573
1,858
353
1,505
(102)
1,403
$2.72
$MM
Q3 vs. Q2 highlights
A.
Increase in pre-
provision earnings
driven largely by full
quarter of HSBC, lower
charges on legal and
regulatory matters and
unique items
B.
Lower provision driven
largely by significantly
lower HSBC allowance
build
A
B
Wtd avg common shares outstanding
584.1
582.8
513.1
Net income avail to common stockholders
1,173
92
1,396
2
1
1
HSBC closed on 5/1/2012; includes partial quarter impacts of acquisition
2
ING Direct closed on 2/17/2012; includes partial quarter impacts of acquisition
and bargain purchase gain of $594MM recognized in non-interest
income |
 5
October 18, 2012
The impact of acquisitions on NIM has largely played through
Yield/
Rate
Yield/
Rate
Average
Balance
Yield/
Rate
Average
Balance
Average
Balance
Average
Balance
Yield/
Rate
Q3’12
Average Balances & Margin Highlights
(Dollars in millions)
Interest-earning assets:
Loans held for investment
$
202,856
9.66
%
Investment securities
57,928
2.31
Cash equivalents and other
6,019
1.20
Total interest-earning assets
$
266,803
7.88
%
Interest-bearing liabilities:
Total interest-bearing deposits
$
193,700
0.77
%
Securitized debt obligations
13,331
1.92
Senior and subordinated notes
3.08
Other borrowings
2.91
Total interest-bearing liabilities
$
1.06
%
Impact of non-interest bearing funding
0.15
%
Net interest margin
6.97
%
11,035
12,085
230,151
Q2’12
$
192,632
8.84
%
56,972
2.35
15,415
0.67
$
265,019
6.97
%
$
195,597
0.76
%
14,948
1.85
3.10
3.72
$
1.06
%
0.13
%
6.04
%
11,213
9,257
231,015
Q1’12
$
152,900
9.56
%
50,543
2.36
16,803
0.62
$
220,246
7.23
%
$
151,625
0.82
%
16,185
1.98
3.43
3.61
$
1.20
%
0.17
%
6.20
%
10,268
9,541
187,619
Q4’11
$
131,581
10.46
%
39,005
2.50
5,685
1.20
$
176,271
8.40
%
$
109,914
0.96
%
16,780
1.91
3.48
4.41
$
1.43
%
0.25
%
7.22
%
10,237
7,794
144,725 |
 6
October 18, 2012
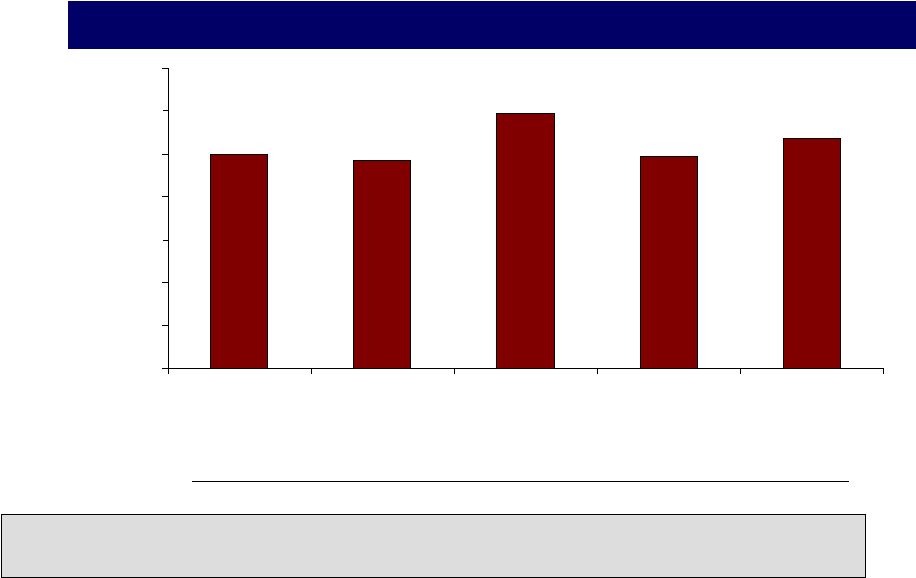
Our capacity to generate capital is strong
Tier 1 Common Ratio (Basel I)
10.0%
9.7%
11.9%
9.9%
10.7%
0.0%
2.0%
4.0%
6.0%
8.0%
10.0%
12.0%
14.0%
Q3'11
Q4'11
Q1'12
Q2'12
Q3'12
Disallowed DTA
RWA
EOP Loans
Tier 1 common capital
excluding disallowed DTA
($B)
Tier 1 common capital
(0.2)
149
130
15.1
14.9
(0.5)
156
15.6
15.1
136
(0.9)
183
22.6
21.7
174
216
22.3
21.5
203
(0.8)
1
Tier 1 common ratio is a regulatory capital measure calculated based on Tier 1 common capital divided
by risk-weighted assets. See "Exhibit 99.2—Table 13: Reconciliation of
Non-GAAP Measures and Calculation of Regulatory Capital Measures" for the calculation of this ratio.
218
23.5
23.3
203
(0.2)
1 |
| 7
October 18, 2012
We expect to meet an assumed Basel III capital target of 8% in 2013
•
We expect the Basel II rules will apply to us no earlier than January of 2016 but are
assumed to be fully implemented in our Basel III estimates
–
We expect to trigger Basel II status at the end of 2012
–
We will enter parallel run in 2015
•
Our Q3’12 estimated Basel III equivalent for Tier 1 common ratio is in the high 7%
range
–
Includes preliminary analysis of RWA (denominator) impacts of Basel II, and capital (numerator)
impacts of Basel II and Basel III
–
Is
adjusted
for
scheduled
amortization
of
PCCR
and
capital
punitive
securities
by
2016
•
We expect to be above an assumed target of 8% (Basel III Tier 1 common ratio) in
2013
1
2
1
Estimated based on our current interpretation, expectations and understanding of
the Basel III capital rules and other capital regulations proposed by
U.S. regulators and the application of such rules to our businesses as currently
conducted. Basel III calculations are necessarily subject to change
based on, among other things, the scope and terms of the final rules and
regulations, model calibration and other implementation guidance, changes
in our businesses and certain actions of management, including those affecting
the composition of our balance sheet. We believe this ratio provides
useful information to investors and others by measuring our progress against
expected future regulatory capital standards.
2
Our assumed 8% Basel III Tier 1 common ratio target assumes a SIFI buffer of 50
bps and a further buffer of 50 bps. Actual target will depend on
regulatory expectations and business judgments. See Note 1 above for more
information on Basel III calculations. |
 8
October 18, 2012
Consumer Banking
Commercial Banking
Domestic Card
Our businesses continue to deliver solid results
•
Ending loans declined by 0.2%
in the quarter
–
Excluding expected HSBC
and IL run-off, card grew
0.4%, in line with normal
seasonal patterns
•
Purchase
volumes
grew
9.1%
year-over-year
•
Net revenue margin of 17.1%
•
Charge-offs were 3.04%
–
Charge-offs suppressed by
89bps from purchase
accounting
–
Seasonally low quarter for
charge-offs
•
Steady growth continued with
ending loans up 3% in the
quarter and 15% year-over-
year
•
Revenue was up 2% in the
quarter and 11% year-over-
year
•
Charge-offs for the quarter
were zero, as recoveries offset
charge-offs
•
Modest decline in ending loan
balances
–
$2.0B expected run-off of
Home Loans
–
$1.2B growth in Auto loans
•
Revenue increased by 5%
quarter-over-quarter
–
Valuation of retained
mortgage interests
–
Growth in average Auto
loans
•
Charge-offs were 0.83%, up
35bps quarter-over-quarter,
consistent with normal Auto
seasonality
1
Reported purchase volume growth of 40.6% year-over-year, including the impact of the HSBC
acquisition 1 |
 9
October 18, 2012
Despite strong underlying growth, we expect significant run-off will
drive declining average loan balances in 2013
Underlying Growth
Portfolio Run-off
(expected 2013 run-off, ending loan balances)
•
Solid growth where we’re investing to grow:
–
Parts of Domestic Card
–
Auto Finance
–
Commercial Banking
•
Risks
–
Continued weak consumer demand
–
Increased competitive intensity
–
Uncertain economic, regulatory, and
rate environment
•
Increasing divergence between ending and
average loan balances
•
Consumer Banking (~$9 billion)
–
Home Loans inherited in acquisitions
•
Domestic Card (~$2 billion)
–
High-margin, high-loss portions of HSBC
U.S. credit card portfolio
–
Small amount of remaining run-off of
installment loans
•
Commercial Banking (~$140 million)
–
Small Ticket CRE inherited in acquisitions |
 10
October 18, 2012
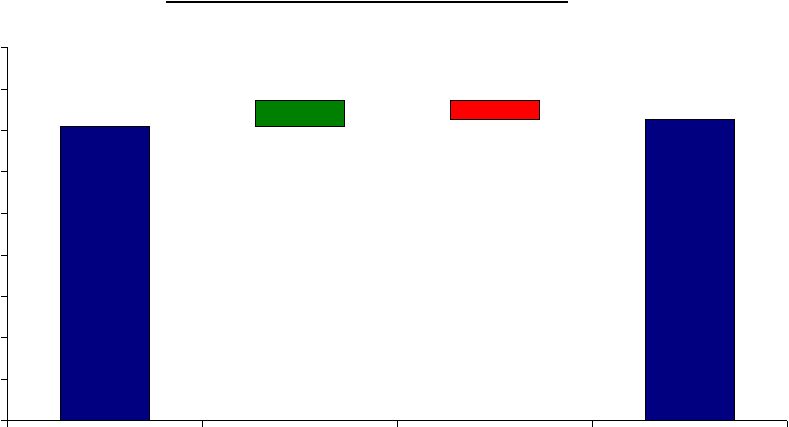
17.08%
17.26%
(0.45%)
0.63%
10%
11%
12%
13%
14%
15%
16%
17%
18%
19%
Q3'12
Removal of Purchase
Accounting Impacts
Removal of
Seasonality
Adjusted Q3'12
Third quarter Domestic Card revenue margin is seasonally high
Domestic Card Revenue Margin
Q3’12 |
 11
October 18, 2012
We expect Domestic Card revenue margin to decline from Q3 levels
Estimated Quarterly Revenue Margin Impacts
(cumulative basis point impact from Q3’12)
Q4’12
Q1’13
Q2’13
Q3’13
Q4’13
(10)
(30)
(40)
(40)
(50)
(1)
(5)
(9)
(12)
(15)
?
?
?
?
?
Franchise Enhancements
Align HSBC practices, payment
protection runoff, other
Mix Shift / Runoff
Higher yielding HSBC branded
book assets running off
Other Factors
Competitive, credit, and
interest rate environment |
 12
October 18, 2012
Expected 2013 trends for non-interest expense items are emerging in the
second half of 2012
Integration and
Purchase
Accounting
Synergies
Investments
Marketing
•
2013 marketing
expense of
approximately
$1.5B
•
Infrastructure and
customer
investments in 2013
similar to Q3’12
levels
•
Operating expense
investments to drive
Auto and
Commercial loan
growth similar to
Q3’12 levels
•
Majority of expected
synergies already
reflected in Q3’12
operating expense
•
Integration costs
and purchase
accounting
impacts in 2013
similar to Q3’12
levels
Operating Expense |
 13
October 18, 2012
Solid Business Results
in a Challenging
Environment
Strong Returns and
Capital Generation
Sure-footed
Integrations
We remain focused on delivering sustained shareholder value |
 14
October 18, 2012 |