Attached files
| file | filename |
|---|---|
| EX-99.1 - PRESS RELEASE - TPC Group Inc. | d390904dex991.htm |
| 8-K - FORM 8-K - TPC Group Inc. | d390904d8k.htm |
 Investor Conference Call
Quarter Ended June 30, 2012
August 3, 2012
Exhibit 99.2 |
 2
SEC Disclosure Information
»
Forward-Looking Statements -
Some of our comments today may include forward-
looking statements about our expectations for the future. These statements include
assumptions, expectations, predictions, intentions or beliefs about future
events. Although
we
believe
that
such
statements
are
based
on
reasonable
assumptions,
no
assurance can be given that such statements will prove to have been correct, and
we do not plan to update any forward-looking statements if our
expectations change. More information about the risks and
uncertainties relating to TPC Group and the forward- looking statements
may be found in our SEC filings. »
Non-GAAP Financial Measures -
Some of our comments today will reference
EBITDA, which is a non-GAAP financial measure. We calculate EBITDA as
earnings before interest, taxes, depreciation and amortization. In
certain periods we have reported EBITDA adjusted to remove or add back
items that management believed distorted comparability between periods
(Adjusted EBITDA). There were no such adjustments to EBITDA for any
of the periods presented. Provided herein is a reconciliation, for
each period presented, of EBITDA to Net Income (Loss), which is the most
directly comparable GAAP measure reported in our financial statements. |
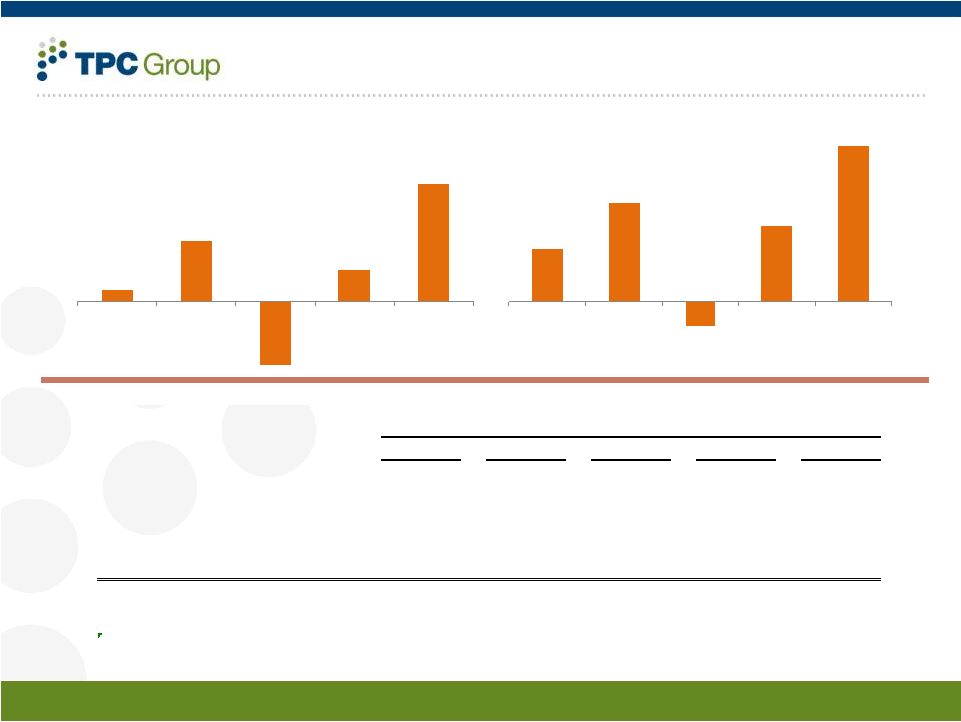 $24.3
$45.2
$(11.0)
$34.4
$71.0
Qtr Ended
06/30/12
Qtr Ended
03/31/12
Qtr Ended
12/31/11
Qtr Ended
09/30/11
Qtr Ended
06/30/11
$3.4
$18.0
$(18.4)
$9.4
$34.3
Qtr Ended
06/30/12
Qtr Ended
03/31/12
Qtr Ended
12/31/11
Qtr Ended
09/30/11
Qtr Ended
06/30/11
3
Net Income (Loss)
(in millions)
EBITDA* (in millions)
* See slide 8 for a reconciliation of EBITDA to Net Income (Loss)
for all periods presented. Net Income (Loss) is the GAAP measure
most directly comparable to EBITDA. (unaudited)
(in millions except per share)
06/30/12
03/31/12
12/31/11
09/30/11
6/30/2011
Revenue
690.1
$
606.1
$
574.8
$
835.3
$
792.9
$
Gross profit (1)
68.4
89.1
31.9
77.2
115.6
Income (loss) from operations
14.0
34.8
(21.3)
24.0
60.2
Interest expense and other, net
(8.4)
(7.8)
(8.0)
(8.2)
(8.2)
Income tax (expense) benefit
(2.2)
(9.0)
10.9
(6.4)
(17.7)
Net income (loss)
3.4
18.0
(18.4)
9.4
34.3
Earnings per share
0.21
1.14
(1.18)
0.58
2.12
(1)
Defined herein as Revenue less Cost of Sales as reported in our
consolidated financial statements. Gross profit for the quarters ended 6/30/12
and 9/30/11 include lower-of-cost-or-market
adjustments of $2.8 million and $9.8 million, respectively.
Quarter Ended |
 4
* See slide 8 for a reconciliation of EBITDA to Net Income (Loss)
for all periods presented. Net Income (Loss) is the GAAP measure
most directly comparable to EBITDA. C4 Processing Segment
06/30/12
03/31/12
12/31/11
09/30/11
06/30/11
C4 Processing Segment
Sales volume (pounds)
602.1
504.4
560.2
669.1
691.2
Revenue
575.8
$
500.9
$
478.9
$
713.5
$
659.1
$
Gross profit (1)
47.4
69.4
11.3
58.7
92.8
Gross profit (per pound)
0.08
0.14
0.02
0.09
0.13
EBITDA *
20.8
43.9
(13.0)
33.5
66.9
EBITDA (per pound)
0.03
0.09
(0.02)
0.05
0.10
Performance Products
Segment Performance Products Segment
Sales volume (pounds)
141.7
129.3
117.7
149.1
168.6
Revenue
114.3
$
105.2
$
95.9
$
121.8
$
133.8
$
Gross profit (1)
21.0
19.7
20.6
18.5
22.8
Gross profit (per pound)
0.15
0.15
0.18
0.12
0.14
EBITDA *
10.5
9.5
11.4
8.1
12.0
EBITDA (per pound)
0.07
0.07
0.10
0.05
0.07
Total
Total
Sales volume (pounds)
743.8
633.8
677.9
818.1
859.8
Revenue
690.1
$
606.1
$
574.8
$
835.3
$
792.9
$
Gross profit (1)
68.4
89.1
31.9
77.2
115.6
Gross profit (per pound)
0.09
0.14
0.05
0.09
0.13
EBITDA *
31.3
53.4
(1.6)
41.5
78.9
EBITDA (per pound)
0.04
0.08
(0.00)
0.05
0.09
Defined herein as Revenue less Cost of Sales as
reported in our consolidated financial statements. Gross profit for the quarters ended 6/30/12
and 9/30/11 included lower-of-cost-or-market adjustments of $2.8
million and $9.8 million, respectively. Of the total adjustment for the quarter
ended 6/30/12, $2.2 million related to C4 Processing and $0.6 million related to
Performance Products. Of the total adjustment for the quarter ended
9/30/11, $9.7 million related to C4 Processing and $0.1 million related to Performance Products.
Quarter Ended
Selected Operating Results
(unaudited) (in millions except per pound amounts)
(1) |
 Supplemental Data
5 |
 6
06/30/12
03/31/12
12/31/11
09/30/11
06/30/11
End of quarter butadiene contract price
1.09
1.46
0.98
1.71
1.53
Unleaded
gasoline
quarter
average
-
USGC
2.93
3.02
2.62
2.89
3.07
US ethylene industry capacity utilization (%) (3)
86.7
89.4
91.5
91.9
89.1
US butadiene production (mm lbs) (3)
683
683
739
812
795
(1) Source: HIS (formerly CMAI)
(2) Source: Platts
(3) Source: Hodson
Quarter Ended
Selected Market Data
(unaudited)
($/1b) (1)
($/gal) (2) |
 06/30/12
03/31/12
12/31/11
09/30/11
06/30/11
Sales volume (1)
743.8
633.8
677.9
818.1
859.8
Revenue
690.1
$
606.1
$
574.8
$
835.3
$
792.9
$
Gross profit (2)
68.4
89.1
31.9
77.2
115.6
EBITDA *
C4 Processing
20.8
43.9
(13.0)
33.5
66.9
Performance Products
10.5
9.5
11.4
8.1
12.0
Corporate
(7.0)
(8.2)
(9.4)
(7.2)
(7.9)
24.3
$
45.2
$
(11.0)
$
34.4
$
71.0
$
EBITDA (per pound)
0.03
$
0.07
$
(0.02)
$
0.04
$
0.08
$
Operating segment EBITDA (per pound) (3)
0.04
$
0.08
$
(0.00)
$
0.05
$
0.09
$
Change in butadiene contract price (%)
(26%)
49%
(42%)
12%
47%
Impact of butadiene price change
(13)
$
17
$
(36)
$
5
$
27
$
(1)
Does not include tolling volume.
(2)
(3)
EBITDA for the C4 Processing and Performance Products operating
segments - i.e. total EBITDA less Corporate. Quarter
Ended Defined herein as Revenue less Cost of Sales as reported in
our consolidated financial statements. Gross profit for the quarters ended
6/30/12 and 9/30/11 include
lower-of-cost-or-market adjustments of $2.8 million and $9.8 million , respectively.
7
Selected Financial Data
(unaudited) (in millions except per pound amounts)
* See slide 8 for a reconciliation of EBITDA to Net Income (Loss)
for all periods presented. Net Income (Loss) is the GAAP measure
most directly comparable to EBITDA. |
 8
Reconciliation of EBITDA to Net Income
(unaudited) (in millions)
06/30/12
03/31/12
12/31/11
09/30/11
06/30/11
Net income (loss)
3.4
$
18.0
$
(18.4)
$
9.4
$
34.3
$
Income tax expense (benefit)
2.2
9.0
(10.9)
6.4
17.7
Interest expense, net
8.6
8.0
8.2
8.6
8.6
Depreciation and amortization
10.1
10.2
10.1
10.0
10.4
EBITDA (*)
24.3
$
45.2
$
(11.0)
$
34.4
$
71.0
$
Quarter Ended
(*) EBITDA is presented and discussed herein because management believes it enhances understanding by
investors and lenders of the Company’s financial performance. EBITDA is not a measure
computed in accordance with GAAP. Accordingly it does not represent cash flow from operations, nor is it intended to be
presented herein as a substitute for operating income or net income as indicators of the
Company’s operating performance. EBITDA is the primary performance measurement used
by senior management and our Board of Directors to evaluate operating results of, and to allocate capital resources between, our business
segments. We calculate EBITDA as earnings before interest, taxes, depreciation and amortization.
In certain periods we have reported EBITDA adjusted to remove or add back items that management
believed distorted comparability between periods (Adjusted EBITDA). There were no such adjustments to EBITDA for
any of the periods presented above. Our calculation of EBITDA may be different from calculations used
by other companies; therefore, it may not be comparable to other companies. |