Attached files
| file | filename |
|---|---|
| 8-K - FORM 8-K - SOUTHERN Co GAS | form_8-k.htm |
| EX-99.1 - EXHIBIT 99.1 - SOUTHERN Co GAS | exhibit99_1.htm |

Second Quarter 2012
Earnings Presentation
Earnings Presentation
August 1, 2012

Forward-Looking Statements & Supplemental Information
2
Forward-Looking Statements
Certain expectations and projections regarding our future performance referenced in this presentation, in other reports or statements we file with the SEC or otherwise release to the public, and
on our website, are forward-looking statements within the meaning of the Private Securities Litigation Reform Act of 1995. Senior officers and other employees may also make verbal statements
to analysts, investors, regulators, the media and others that are forward-looking. Forward-looking statements involve matters that are not historical facts, such as statements regarding our future
operations, prospects, strategies, financial condition, economic performance (including growth and earnings), industry conditions and demand for our products and services. Because these
statements involve anticipated events or conditions, forward-looking statements often include words such as "anticipate," "assume," "believe," "can," "could," "estimate," "expect," "forecast,"
"future," "goal," "indicate," "intend," "may," "outlook," "plan," "potential," "predict," "project," "seek," "should," "target," "would," or similar expressions. Forward-looking statements contained in
this presentation include, without limitation, statements regarding our anticipated capital expenditures, anticipated results of our storage rollout schedule, completion schedule of our storage
facilities and our expected capacity at such facilities, the benefits of our shared services model and our expected merger-related synergies in 2012, the timing and approval of our proposed
infrastructure program, the impact of forward natural gas price changes on our storage portfolio, our earnings guidance and the positive trends we anticipate through the remainder of the year
and our priorities for 2012. Our expectations are not guarantees and are based on currently available competitive, financial and economic data along with our operating plans. While we believe
our expectations are reasonable in view of the currently available information, our expectations are subject to future events, risks and uncertainties, and there are several factors - many beyond
our control - that could cause results to differ significantly from our expectations.
Such events, risks and uncertainties include, but are not limited to, changes in price, supply and demand for natural gas and related products; the impact of changes in state and federal
legislation and regulation including changes related to climate change; actions taken by government agencies on rates and other matters; concentration of credit risk; utility and energy industry
consolidation; the impact on cost and timeliness of construction projects by government and other approvals, development project delays, adequacy of supply of diversified vendors, unexpected
change in project costs, including the cost of funds to finance these projects; the impact of acquisitions and divestitures including the Nicor merger; limits on natural gas pipeline capacity; direct
or indirect effects on our business, financial condition or liquidity resulting from a change in our credit ratings or the credit ratings of our counterparties or competitors; interest rate fluctuations;
financial market conditions, including disruptions in the capital markets and lending environment and the current economic uncertainty; general economic conditions; uncertainties about
environmental issues and the related impact of such issues; the impact of changes in weather, including climate change, on the temperature-sensitive portions of our business; the impact of
natural disasters such as hurricanes on the supply and price of natural gas; the outcome of litigation; acts of war or terrorism; and other factors which are provided in detail in our filings with the
Securities and Exchange Commission. Forward-looking statements are only as of the date they are made, and we do not undertake to update these statements to reflect subsequent changes.
Supplemental Information
Company management evaluates segment financial performance based on operating margin and earnings before interest and taxes (EBIT), which include the effects of corporate expense
allocations. EBIT is a non-GAAP (accounting principles generally accepted in the United States of America) financial measure that includes operating income and other income and expenses.
Items that are not included in EBIT are income taxes and financing costs, including debt and interest expense, each of which the company evaluates on a consolidated basis. The company
believes EBIT is a useful measurement of its performance because it provides information that can be used to evaluate the effectiveness of its businesses from an operational perspective,
exclusive of the costs to finance those activities and exclusive of income taxes, neither of which is directly relevant to the efficiency of those operations. Operating margin is a non-GAAP
measure calculated as operating revenues minus cost of goods sold and revenue taxes, excluding operation and maintenance expense, depreciation and amortization, certain taxes other than
income taxes and gains or losses on the sale of assets, if any. These items are included in the company's calculation of operating income. The company believes operating margin is a better
indicator than operating revenues of the contribution resulting from customer growth, since cost of goods sold and revenue taxes are generally passed directly through to customers. In
addition, in this presentation, the company has presented a non-GAAP measure of both its net income and its earnings per share each adjusted to exclude expenses incurred with respect to
the Nicor merger. As the company does not routinely engage in transactions of the magnitude of the Nicor merger, and consequently does not regularly incur transaction related expenses with
correlative size, the company believes presenting net income and EPS excluding Nicor merger expenses provides investors with an additional measure of the company’s core operating
performance. The company also uses a non-GAAP measure when it presents the impact of warmer than normal weather on its diluted EPS. EBIT, operating margin, net income excluding
merger expenses (also referred to as adjusted net income), EPS excluding merger expenses (also referred to as adjusted EPS) and the impact of warmer than normal weather should not be
considered as alternatives to, or more meaningful indicators of, the company's operating performance than operating income, net income attributable to AGL Resources Inc. or EPS as
determined in accordance with GAAP. In addition, the company's EBIT, operating margin, adjusted net income and adjusted EPS may not be comparable to similarly titled measures of another
company. Reconciliations of non-GAAP financial measures referenced in this presentation are available at the end of this presentation and on the company’s Web site at
www.aglresources.com

2Q12 Highlights
• 2Q12 GAAP EPS of $0.28 per
diluted share
diluted share
• Adjusted diluted EPS of $0.30, excluding
approximately $2 million in after-tax costs
related to Nicor merger
approximately $2 million in after-tax costs
related to Nicor merger
• Distribution segment EBIT up 35% 2Q12
vs. 2Q11, primarily due to addition of
Nicor Gas in 1Q12
vs. 2Q11, primarily due to addition of
Nicor Gas in 1Q12
• Retail segment EBIT up $13 million vs.
2Q11, driven by the addition of Nicor’s
retail businesses
2Q11, driven by the addition of Nicor’s
retail businesses
• Wholesale, midstream and cargo
shipping segments remain challenged
due to market fundamentals
shipping segments remain challenged
due to market fundamentals
• Warmer-than-normal (10-year
average) weather at distribution
and retail segments reduced EPS
by approximately $0.02 in 2Q12
average) weather at distribution
and retail segments reduced EPS
by approximately $0.02 in 2Q12
Note: Please review the AGL Resources 10-Q as filed with the SEC on 8/1/12 for detailed information.
Operating Margin, EBIT, Adjusted Net Income and Adjusted EPS are non-GAAP measures. Please see
the appendix to this presentation or visit the investor relations section of www.aglresources.com for a
reconciliation to GAAP.
Operating Margin, EBIT, Adjusted Net Income and Adjusted EPS are non-GAAP measures. Please see
the appendix to this presentation or visit the investor relations section of www.aglresources.com for a
reconciliation to GAAP.
(1) Results for Nicor’s businesses are not included in 2Q11 GAAP results.
(2) Adjusted for Cost of Goods Sold and revenue tax expenses for Nicor Gas which are passed directly
through to customers.
through to customers.
(3) Adjusted net income and adjusted EPS exclude Nicor-related merger costs of approximately $2
million, net of tax, for 2Q12 and $8 million, net of tax, for 2Q11.
million, net of tax, for 2Q12 and $8 million, net of tax, for 2Q11.
3

6-Months 2012 Highlights
• 6-months 2012 GAAP EPS of $1.40 per
diluted share
diluted share
• Adjusted diluted EPS of $1.47, excluding
$8 million in after-tax costs related to Nicor
merger
$8 million in after-tax costs related to Nicor
merger
• Warmer-than-normal (10-year average)
weather at distribution and retail
segments reduced EPS by approximately
$0.13 YTD
weather at distribution and retail
segments reduced EPS by approximately
$0.13 YTD
• Distribution segment EBIT up 37%
through 6/30/12 vs. 6/30/11, primarily due
to addition of Nicor Gas
through 6/30/12 vs. 6/30/11, primarily due
to addition of Nicor Gas
• Retail segment EBIT up 7%
• Wholesale, midstream and cargo
shipping segments remain challenged
due to market fundamentals
shipping segments remain challenged
due to market fundamentals
• Wholesale rollout schedule
strengthened from 3/31/12 to 6/30/12
strengthened from 3/31/12 to 6/30/12
• Modest improvement in seasonal
storage spreads providing some short-
term opportunities for midstream
storage spreads providing some short-
term opportunities for midstream
• Cargo shipping experiencing higher
volumes, offset by lower fees
volumes, offset by lower fees
Note: Please review the AGL Resources 10-Q as filed with the SEC on 8/1/12 for detailed information.
Operating Margin, EBIT, Adjusted Net Income and Adjusted EPS are non-GAAP measures. Please see the
appendix to this presentation or visit the investor relations section of www.aglresources.com for a
reconciliation to GAAP.
Operating Margin, EBIT, Adjusted Net Income and Adjusted EPS are non-GAAP measures. Please see the
appendix to this presentation or visit the investor relations section of www.aglresources.com for a
reconciliation to GAAP.
(1) Results for Nicor’s businesses are not included in 6-months 2011 GAAP results.
(2) Adjusted for Cost of Goods Sold and revenue tax expenses for Nicor Gas which are passed directly
through to customers.
through to customers.
(3) Adjusted net income and adjusted EPS exclude Nicor-related merger costs of approximately $8 million,
net of tax, for the first six-months of 2012 and $11 million, net of tax, for the first six months of 2011.
net of tax, for the first six-months of 2012 and $11 million, net of tax, for the first six months of 2011.
4
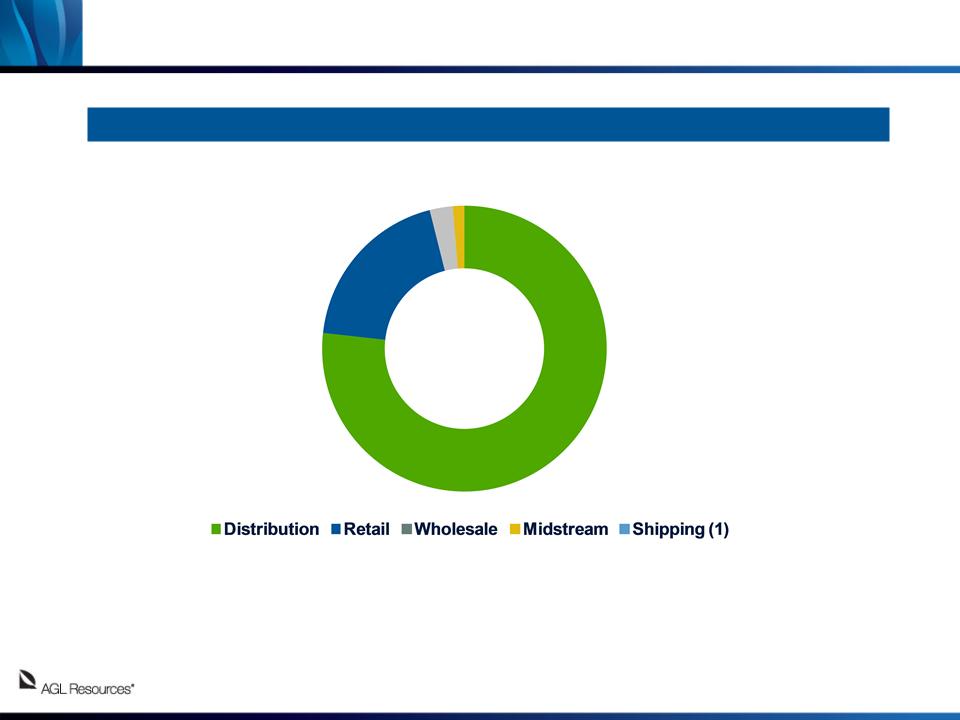
6-Months 2012 Operating EBIT Composition
5
Distribution operations contributed 77% of operating EBIT during the first half of 2012.
(1) There was no EBIT contribution from the Cargo Shipping segment through the first six months of 2012.
Note: Operating EBIT percentages above exclude corporate eliminations.
77%
3%
1%
19%
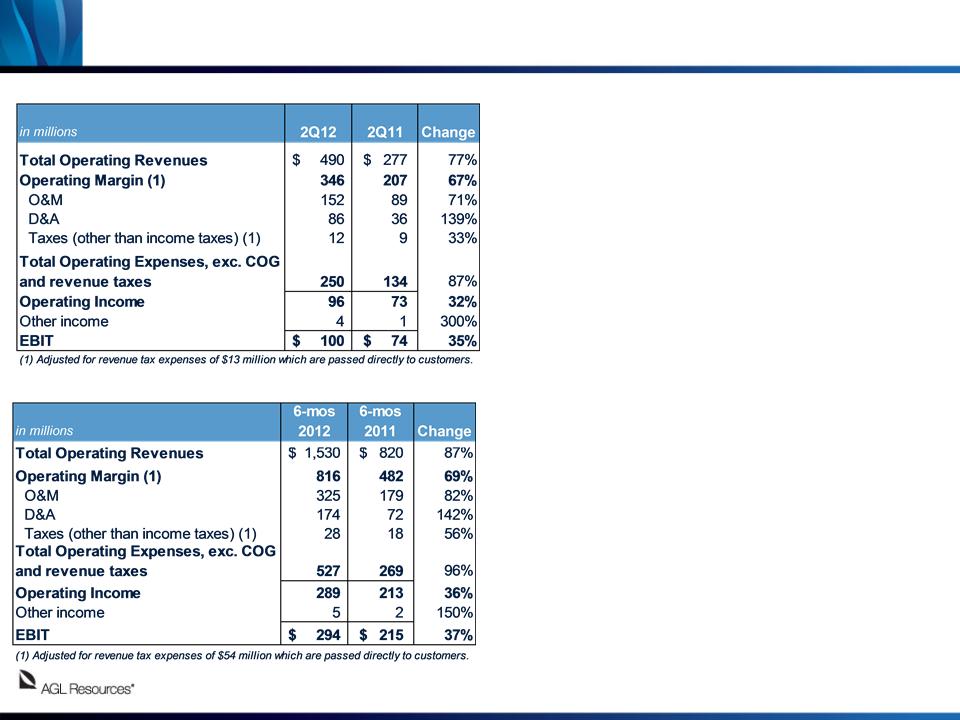
• 2Q12 EBIT increased 35% vs. 2Q11
• Key drivers
• Nicor Gas added EBIT of $20 million
• Warmer-than-normal conditions in
2Q12 negatively impacted EBIT by $4
million vs. normal ($18 million through
6/30/12)
2Q12 negatively impacted EBIT by $4
million vs. normal ($18 million through
6/30/12)
• EBIT at AGLR utilities (excluding Nicor
Gas) favorable by $6 million
Gas) favorable by $6 million
• Expenses increased $116 million vs.
2Q11 due to addition of Nicor Gas
(excluding revenue taxes)
2Q11 due to addition of Nicor Gas
(excluding revenue taxes)
• 6-months 2012 EBIT increased 37%
vs. 2011
vs. 2011
• Customer count stable
• 2.278 million customers in 2Q12 and
2Q11 (avg.) for AGLR utilities
(excluding Nicor Gas)
2Q11 (avg.) for AGLR utilities
(excluding Nicor Gas)
• 2.190 million Nicor Gas customers in
2Q12 (avg.)
2Q12 (avg.)
Distribution Operations
NOTE: COG = Cost of Goods Sold
2Q12 Financial Performance Summary
6-months 2012 Financial Performance Summary
6
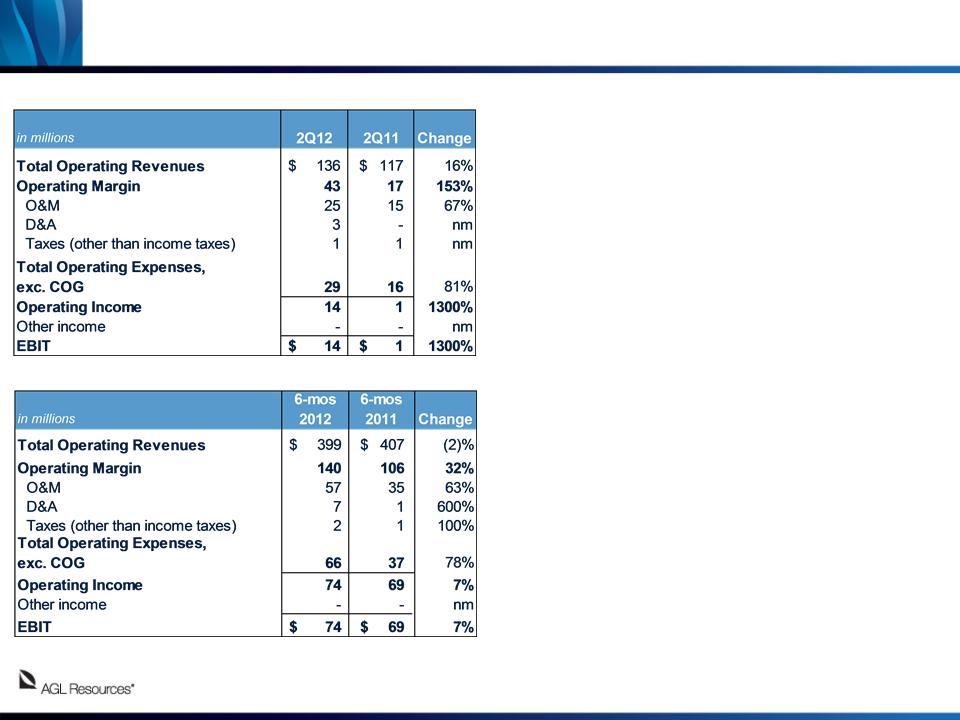
Retail Operations
• 2Q12 EBIT up $13 million vs. 2Q11
• Addition of Nicor’s retail businesses
resulted in a $10 million increase in EBIT
resulted in a $10 million increase in EBIT
• Reduction of transportation and gas costs
vs. 2Q11
vs. 2Q11
• 6-months 2012 EBIT increased 7% vs.
2011
2011
• Market share and customer count
• Georgia market share remains 32% at end
of 2Q12 (equivalent to 2Q11)
of 2Q12 (equivalent to 2Q11)
• Georgia customer count (avg.): 488K at
6/30/12 vs. 492K at 6/30/11
6/30/12 vs. 492K at 6/30/11
• Integration of retail businesses ongoing
2Q12 Financial Performance Summary
6-months 2012 Financial Performance Summary
7
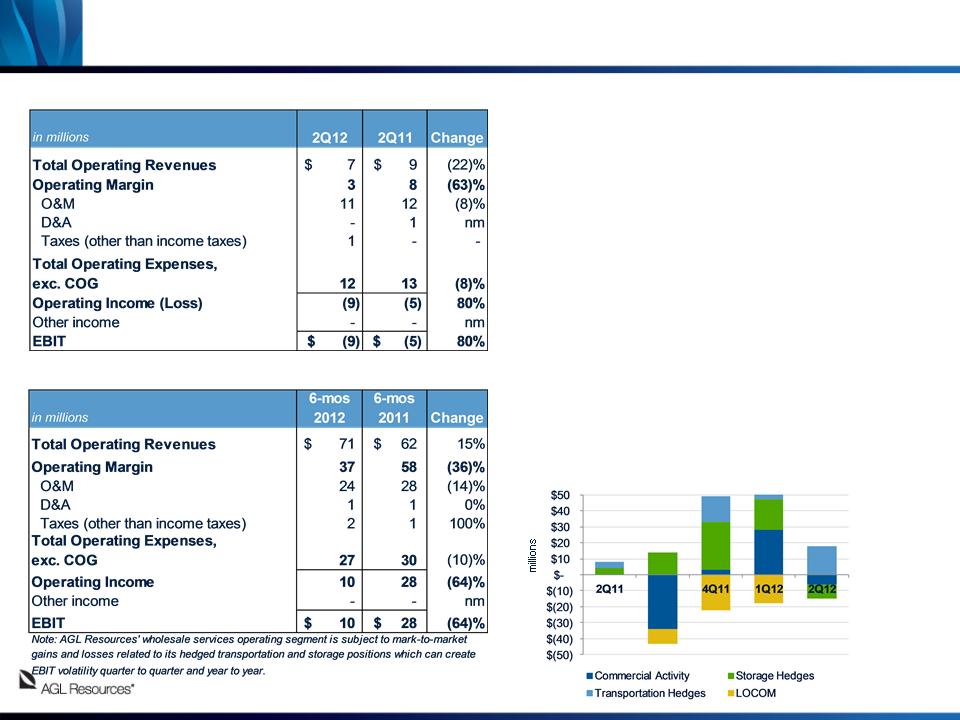
• 2Q12 EBIT down $4 million vs. 2Q11 due
mainly to lower commercial activity
mainly to lower commercial activity
• Commercial activity lower by $6 million y/y
primarily related to reduced optimization margin
and lower transportation spreads in part driven
by natural gas over-supply
primarily related to reduced optimization margin
and lower transportation spreads in part driven
by natural gas over-supply
• $1 million higher MTM year-over-year associated
with storage and transportation hedge movement
with storage and transportation hedge movement
• Improving seasonal storage spreads resulted
in $47 million storage rollout schedule on 55
Bcf of inventory at Sequent at the end of 2Q12
in $47 million storage rollout schedule on 55
Bcf of inventory at Sequent at the end of 2Q12
• At 3/30/12, Sequent had a $19 million storage
rollout schedule on 47 Bcf of inventory
rollout schedule on 47 Bcf of inventory
• At 6/30/11, Sequent had an $11 million rollout
schedule on 29 Bcf of inventory
schedule on 29 Bcf of inventory
2Q12 Financial Performance Summary
Wholesale Services
3Q11
8
Wholesale Operating Margin Components
6-mos 2012 Financial Performance Summary

Midstream Operations
• 2Q12 EBIT of $2 million, flat vs. 2Q11
• Storage values remain depressed due to high
supply of natural gas and reduced demand
supply of natural gas and reduced demand
• Construction update
• Completion of Golden Triangle Storage
Cavern 2 on target for 3Q12
(~7.3 Bcf of working gas capacity)
Cavern 2 on target for 3Q12
(~7.3 Bcf of working gas capacity)
• Construction at Central Valley Gas Storage
largely complete and began serving firm
customers in 2Q12 (~11 Bcf of working gas
capacity)
largely complete and began serving firm
customers in 2Q12 (~11 Bcf of working gas
capacity)
2Q12 Financial Performance Summary
• Contracted Storage Summary (at 6/30/12)
9
(1) Subscribed capacity includes 2 Bcf at Jefferson Island and 2 Bcf at
GTS that are contracted by Sequent.
GTS that are contracted by Sequent.
6-months 2012 Financial Performance Summary

Balance Sheet Highlights
• Solid balance sheet with significant
opportunity to fund capital
requirements
opportunity to fund capital
requirements
• Good access to capital markets
• Company credit metrics support
solid, investment-grade ratings
solid, investment-grade ratings
• $4.3 billion debt outstanding
• Long-term debt $3.3 billion
• Short-term debt of $1.0 billion
• Debt to Cap Ratio: 54%
• 2012 cap ex estimated at $825
million
million
• Approximately $725 million of utility
cap ex expected in 2012 vs. $604
million in 2011 for AGLR utilities +
Nicor Gas
cap ex expected in 2012 vs. $604
million in 2011 for AGLR utilities +
Nicor Gas
• $300 million of 2012 utility cap ex is
rider-based
rider-based
• Approximately $100 million of non-
utility cap ex expected in 2012
utility cap ex expected in 2012
10

2Q12 and 6-months 2012 Weather Impact
11
• First half of 2012 warmest ever
recorded in United States
recorded in United States
• Normal (10-year average) weather at
distribution and retail segments over
2Q12 would have improved EPS by
approximately $0.02, and first six-
months 2012 EPS by approximately
$0.13
distribution and retail segments over
2Q12 would have improved EPS by
approximately $0.02, and first six-
months 2012 EPS by approximately
$0.13
• In aggregate, weather was 20% warmer
-than-normal across all AGLR
jurisdictions for the first half of 2012
-than-normal across all AGLR
jurisdictions for the first half of 2012
• Weather normalization programs in
New Jersey and Virginia largely
insulated Elizabethtown Gas and
Virginia Natural Gas from weather
impacts year-to-date
New Jersey and Virginia largely
insulated Elizabethtown Gas and
Virginia Natural Gas from weather
impacts year-to-date

12
New Jersey Infrastructure Investment Filing
• On July 23, 2012 Elizabethtown Gas filed for approval with the New Jersey Board of Public
Utilities (NJBPU) an Accelerated Infrastructure Replacement (AIR) program
Utilities (NJBPU) an Accelerated Infrastructure Replacement (AIR) program
• Proposal seeks to invest up to $135 million in Elizabethtown’s natural gas infrastructure for
a five-year period (November 2012-August 2017) to enhance the safety, reliability and
integrity of its distribution system
a five-year period (November 2012-August 2017) to enhance the safety, reliability and
integrity of its distribution system
• The cost recovery mechanism proposed is similar to the one already in place for the Utility
Infrastructure Enhancement (UIE) program which is scheduled to expire on October 31,
2012, and seeks to phase in rates over the five-year period
Infrastructure Enhancement (UIE) program which is scheduled to expire on October 31,
2012, and seeks to phase in rates over the five-year period
• The AIR program would replace nearly 150 miles of pipeline, mainly aging cast iron
• Expect the NJBPU to set a hearing and procedural schedule shortly
• Filing is in line with AGLR’s strategy of promoting infrastructure investment programs with
accelerated cost recovery mechanisms, similar to the program in place in Georgia
(STRIDE) and the company’s recently approved SAVE program in Virginia
accelerated cost recovery mechanisms, similar to the program in place in Georgia
(STRIDE) and the company’s recently approved SAVE program in Virginia
13
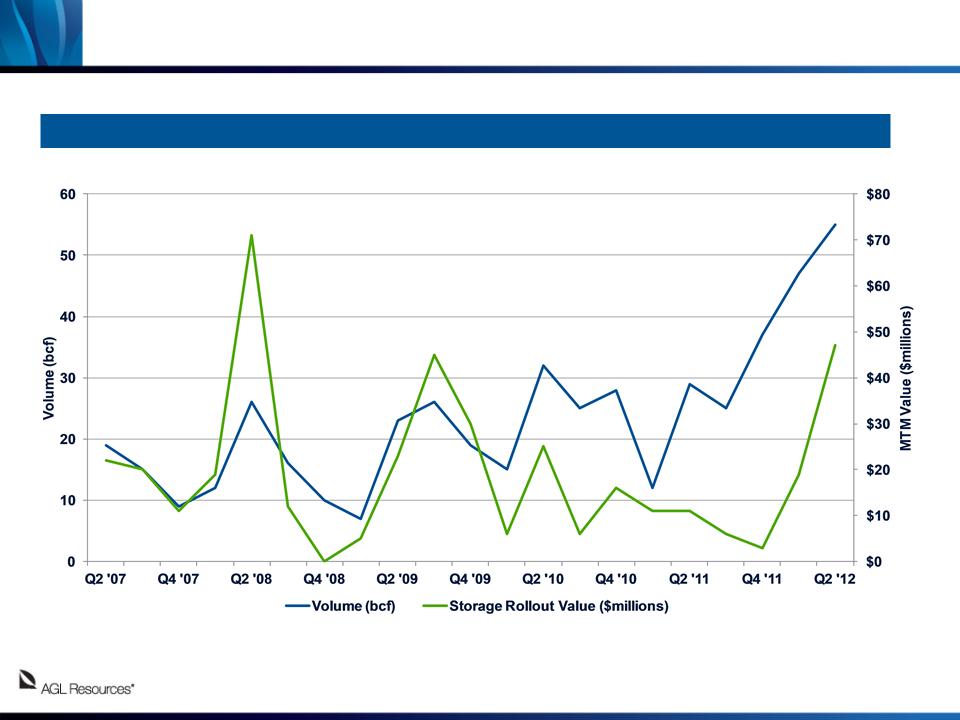
Wholesale Services Storage Rollout
Storage rollout value stands at $47 million on 55 Bcf of natural gas inventory as of 6/30/12
14
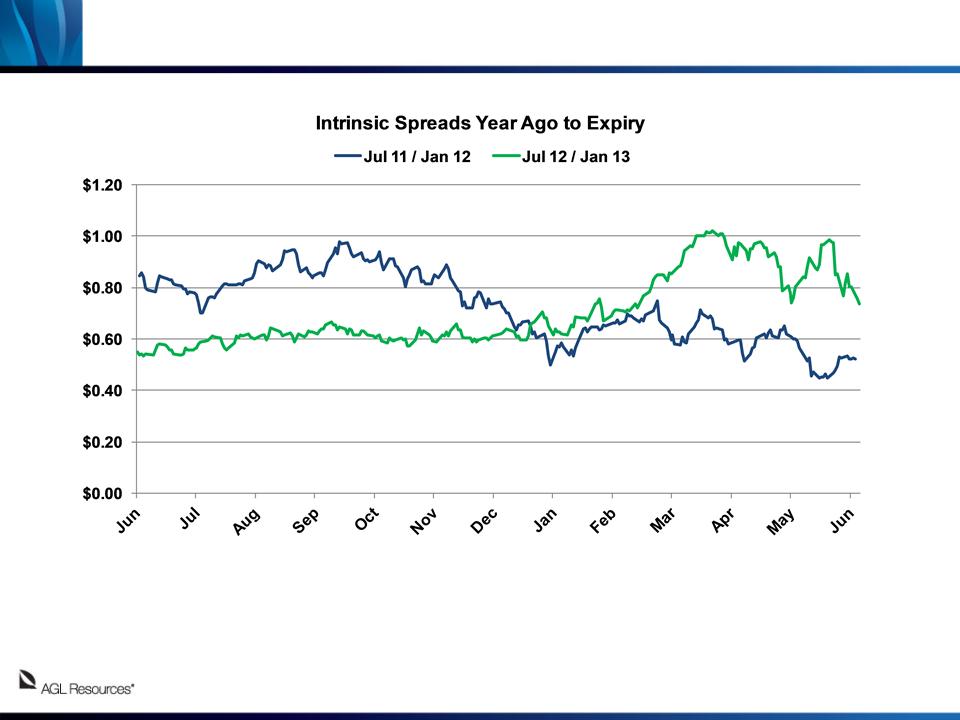
Storage Spreads
June 22, 2011, Jul 11 / Jan 12 spread at $0.523
June 22, 2012, Jul 12 / Jan 13 spread at $0.802

2012 Priorities
• Invest necessary capital to enhance and maintain the safety and reliability of our
distribution systems, while minimizing regulatory lag
distribution systems, while minimizing regulatory lag
• Remain a low-cost leader within the industry
• Maintain margins in Georgia and Illinois while continuing to expand into other
profitable retail markets
profitable retail markets
• Leverage experience across SouthStar and Nicor’s retail businesses
• Renew affiliated and non-affiliated asset management agreements and add new asset
management, gas-fired power generation and producer services contracts
management, gas-fired power generation and producer services contracts
• Continually enhance risk management, credit management and overall controls
Distribution
Retail
Wholesale
Midstream
Cargo Shipping
Expense &
Balance Sheet
Discipline
Balance Sheet
Discipline
• Complete construction of Golden Triangle Cavern 2 and Central Valley Gas
Storage and execute contracts for newly available capacity
Storage and execute contracts for newly available capacity
• Reduce project development costs in response to low volatility environment
• Effectively control expenses and focus on capital discipline in each of our
business segments
business segments
• Maintain strong balance sheet and liquidity profile
• Expand market share in key service areas while providing quality total
transportation and logistics solutions for our customers
transportation and logistics solutions for our customers
• Prudently deploy capital investment and diligently manage operating costs
15
Additional Resources
Company resources
• www.aglresources.com
• Sarah Stashak
Director, Investor Relations
404-584-4577
sstashak@aglresources.com
Industry resources
• www.aga.org
• www.eia.doe.gov
16

Rate Case History
|
Utility
|
Last
Rate Case |
Key Outcomes
|
Agreements
on Rate Case Stay outs |
|
Nicor Gas
|
Mar.
2009 |
• $80 million rate increase
• Bad debt rider approved in February 2010 providing recovery
from (or credit to) customers the difference of actual expense and $63 million benchmark • Rate case reset heating degree days from 5,830 to 5,600
|
Stay out
concludes Dec. 2014 |
|
Atlanta Gas Light
|
Oct.
2010 |
• $26.7 million rate increase approved
• Included ~$10 million in new customer service and safety
programs • Adopted new acquisition synergy sharing policy
|
None
|
|
Virginia Natural Gas
|
Dec.
2011 |
• $11 million rate increase in base rates
• Recovery of $3.1 million in costs previously recovered through
base rates now recovered through PGA • Approval to recover gas portion of bad debts through the PGA
|
None
|
|
Elizabethtown Gas
|
Dec.
2009 |
• $3 million rate increase
• New depreciation rates decreased expense $5 million
• Two-year rate freeze concluded in 2011
|
None
|
|
Florida City Gas
|
Feb.
2004 |
• $7 million rate increase
• Approval in late 2007 to include acquisition adjustment
amortization expense in operating income and acquisition adjustment asset balance in rate base for regulatory surveillance reporting purposes • 2007 approval included a 5-year stay-out provision
|
Stay out
concludes Oct. 2012 |
|
Chattanooga Gas
|
May
2010 |
• Instituted new rate design that encourages customer
conservation • First decoupled rate design for TN utility
• New depreciation rates decreased expense of $2 MM annually
|
None
|
17
Regulatory Recovery Mechanisms
|
Utility
|
Rate
Decoupling |
Weather
Normalization |
Bad Debt
Recovery |
Conservation
Program Recovery |
Infrastructure
Replacement |
|
Nicor Gas
|
|
|
P
|
P
|
|
|
Atlanta Gas Light
|
P
|
|
|
|
P
|
|
Virginia Natural Gas
|
|
P
|
P
|
|
P
|
|
Elizabethtown Gas
|
|
P
|
|
P
|
P
|
|
Florida City Gas
|
|
|
|
P
|
|
|
Chattanooga Gas
|
P
|
P
|
P
|
P
|
|
18

AGL Resources Debt Maturities
19
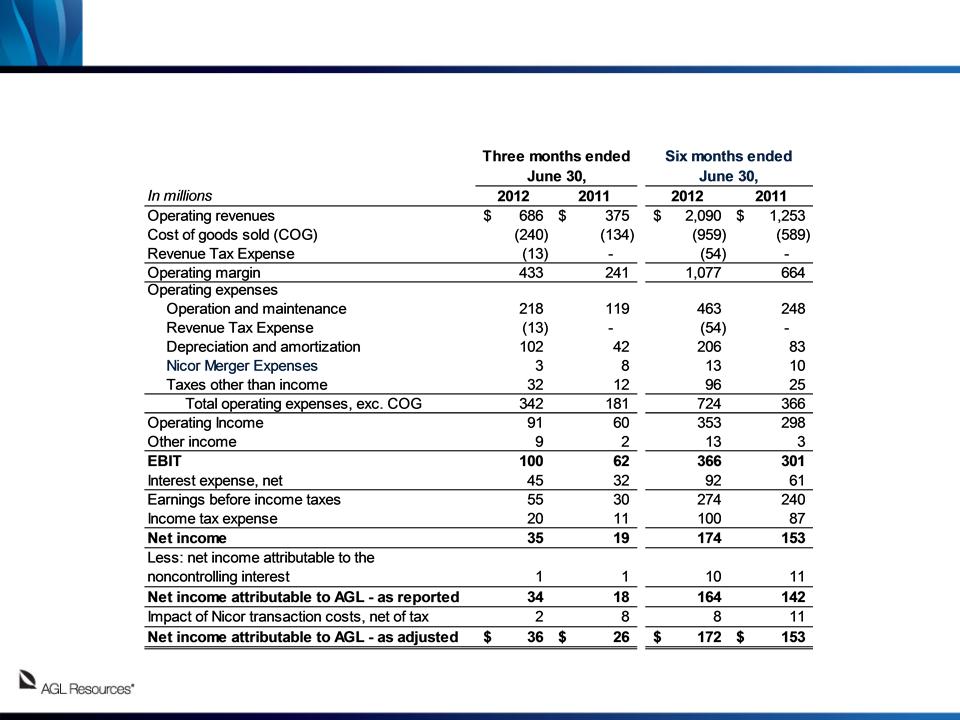
The following table sets forth a reconciliation of AGL Resources’ operating margin to operating income and earnings before interest and taxes (EBIT) to
earnings before income taxes, net income to net income attributable to AGL - as reported and net income attributable to AGL - as adjusted, and net income
attributable to AGL - as adjusted - to diluted EPS - as adjusted for the three and six months ended June 30, 2012 and 2011.
earnings before income taxes, net income to net income attributable to AGL - as reported and net income attributable to AGL - as adjusted, and net income
attributable to AGL - as adjusted - to diluted EPS - as adjusted for the three and six months ended June 30, 2012 and 2011.
GAAP Reconciliation
20
21
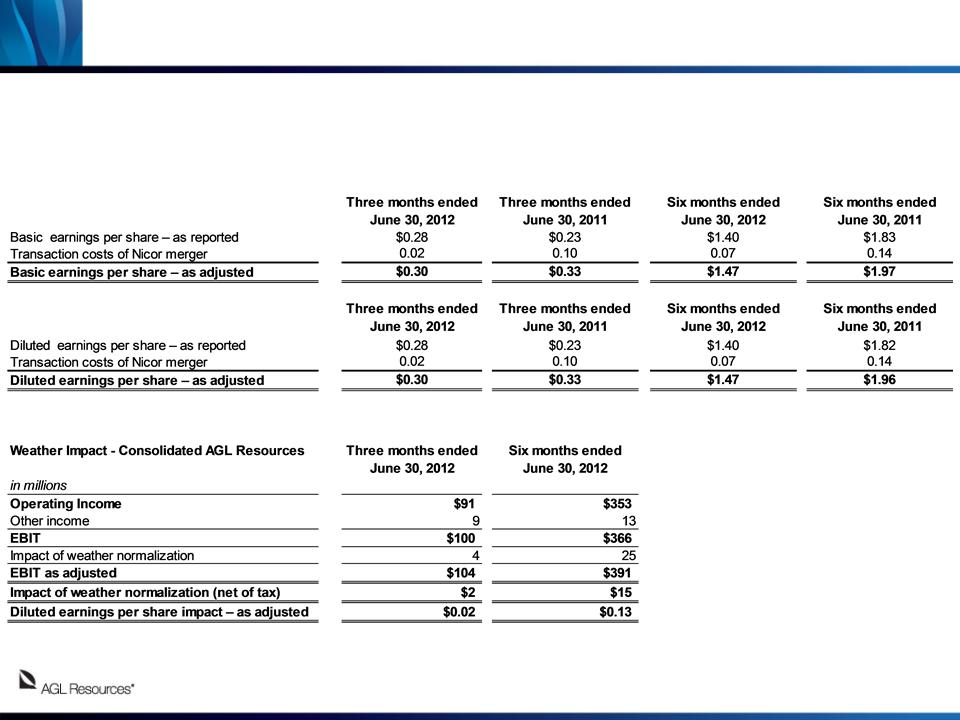
The following tables set forth a reconciliation of AGL Resources’ Basic and Diluted earnings per share - as reported (GAAP) to Basic and Diluted earnings
per share - as adjusted (Non-GAAP; excluding Nicor merger costs), for the three and six months ended June 30, 2012 and 2011.
per share - as adjusted (Non-GAAP; excluding Nicor merger costs), for the three and six months ended June 30, 2012 and 2011.
GAAP Reconciliation
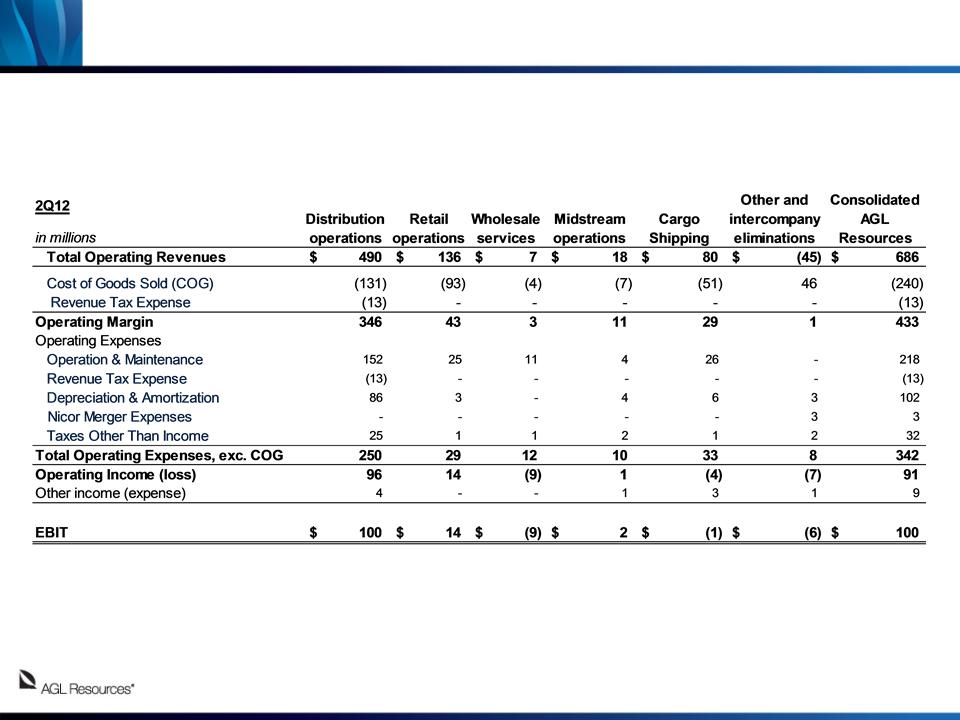
The following tables set forth a reconciliation of AGL Resources’ Statement of Income to earnings before interest and taxes (EBIT) by segment for the
quarter ended June 30, 2012.
quarter ended June 30, 2012.
22
GAAP Reconciliation
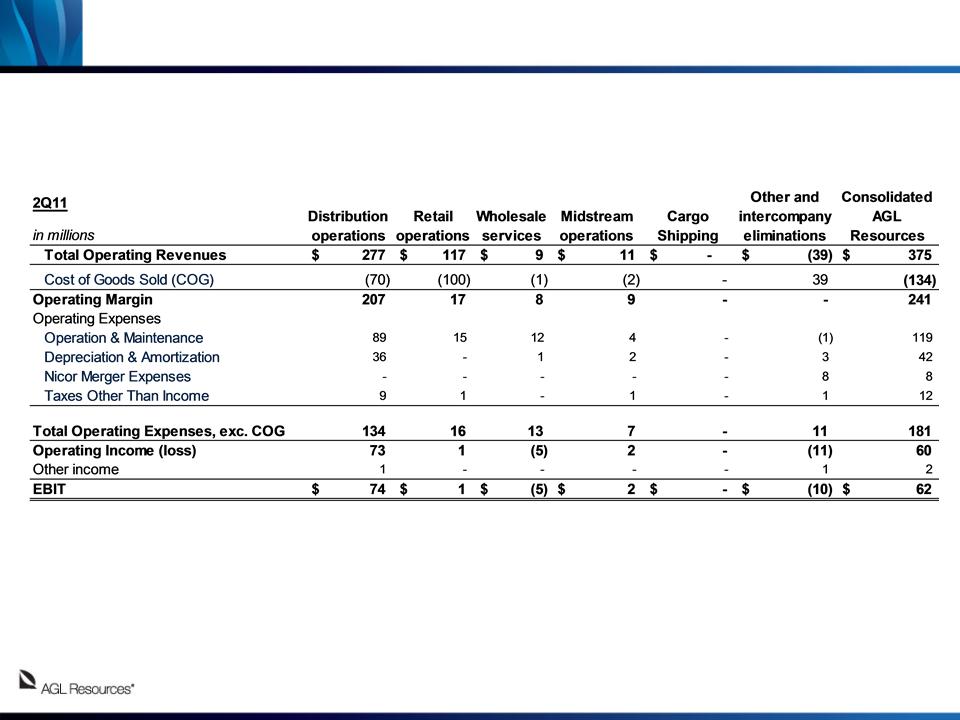
The following tables set forth a reconciliation of AGL Resources’ Statement of Income to earnings before interest and taxes (EBIT) by segment for the
quarter ended June 30, 2011.
quarter ended June 30, 2011.
23
GAAP Reconciliation
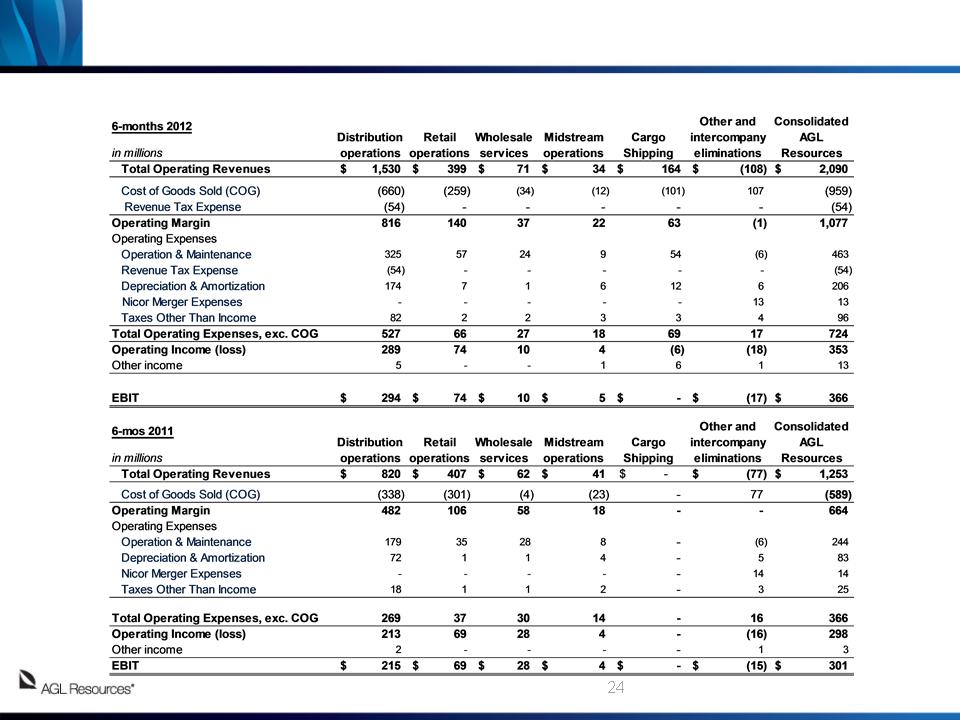
The following tables set forth a reconciliation of AGL Resources’ Statement of Income to earnings before interest and taxes (EBIT) by segment for the six-
months ended June 30, 2012 and 2011.
months ended June 30, 2012 and 2011.
GAAP Reconciliation

Reconciliations of operating margin, EBIT by segment, net income excluding merger expenses and EPS excluding merger expenses are available in our quarterly reports
(Form 10-Q) and annual reports (Form 10-K) filed with the Securities and Exchange Commission and on the Investor Relations section of our website at
www.aglresources.com.
(Form 10-Q) and annual reports (Form 10-K) filed with the Securities and Exchange Commission and on the Investor Relations section of our website at
www.aglresources.com.
Our management evaluates segment financial performance based on operating margin and EBIT, which includes the effects of corporate expense allocations. EBIT is a
non-GAAP (accounting principles generally accepted in the United States of America) financial measure. Items that are not included in EBIT are income taxes and
financing costs, including debt and interest, each of which the company evaluates on a consolidated basis. The company believes EBIT is a useful measurement of its
performance because it provides information that can be used to evaluate the effectiveness of its businesses from an operational perspective, exclusive of the costs to
finance those activities and exclusive of income taxes, neither of which is directly relevant to the efficiency of those operations.
We also use EBIT internally to measure performance against budget and in reports for management and the Board of Directors. Projections of forward-looking EBIT are
used in our internal budgeting process, and those projections are used in providing forward-looking business segment EBIT projections to investors. We are unable to
reconcile our forward-looking EBIT business segment guidance to GAAP net income, because we do not predict the future impact of unusual items and mark-to-market
gains or losses on energy contracts. The impact of these items could be material to our operating results reported in accordance with GAAP.
Operating margin is a non-GAAP measure calculated as revenues minus cost of goods sold and revenue taxes, excluding operation and maintenance expense,
depreciation and amortization, certain taxes other than income taxes and the gain or loss on the sale of assets, if any. These items are included in our calculation of
operating income. We believe operating margin is a better indicator than operating revenues of the contribution resulting from customer growth, since cost of goods sold
and revenue taxes are generally passed directly through to customers.
We present our net income and our EPS excluding expenses incurred with respect to the merger with Nicor. As we do not routinely engage in transactions of the
magnitude of the Nicor merger, and consequently do not regularly incur transaction related expenses of correlative size, we believe presenting our EPS excluding Nicor
merger expenses provides investors with an additional measure of our core operating performance.
magnitude of the Nicor merger, and consequently do not regularly incur transaction related expenses of correlative size, we believe presenting our EPS excluding Nicor
merger expenses provides investors with an additional measure of our core operating performance.
Net income attributable to AGL Resources, as adjusted, and Basic and Diluted earnings per share, as adjusted, are non-GAAP measures and exclude transaction costs
related to the merger with Nicor. Transaction costs include O&M expenses as well as incremental debt issuance costs and interest expense related to financing the cash
portion of the purchase consideration in advance of the merger closing date. The company also uses a non-GAAP measure when it presents the impact of warmer-than-
normal weather on its diluted EPS. EBIT, operating margin, net income excluding merger expenses, EPS excluding merger expenses and the impact of warmer-than-
normal weather should not be considered as alternatives to, or more meaningful indicators of, our operating performance than operating income, net income attributable to
AGL Resources Inc. or EPS as determined in accordance with GAAP. In addition, our EBIT, operating margin, adjusted net income and adjusted EPS may not be
comparable to similarly titled measures of another company.
We believe these financial measures are useful to investors because they provide an alternative method for assessing the Company’s operating results in a manner that is
focused on the performance of the Company’s ongoing operations. The presentation of these financial measures is not meant to be a substitute for financial measures
prepared in accordance with GAAP.
focused on the performance of the Company’s ongoing operations. The presentation of these financial measures is not meant to be a substitute for financial measures
prepared in accordance with GAAP.
25
GAAP Reconciliation

Q&A