Attached files
| file | filename |
|---|---|
| 8-K - FORM 8-K - OCLARO, INC. | d340407d8k.htm |
| EX-99.1 - PRESS RELEASE - OCLARO, INC. | d340407dex991.htm |
 Alain
Couder Chairman & CEO
Jerry Turin
CFO
Shining light on photonic innovation ™
Exhibit 99.2
Q3 Fiscal Year 2012 Summary |
 ©
Oclaro ™
2
Forward Looking Statements
Safe Harbor Statement This
presentation, including the statements made by management, contain statements about management’s future
expectations, plans or prospects of Oclaro, Inc. and its business, and together with
the assumptions underlying these statements, constitute forward-looking
statements for the purposes of the safe harbor provisions of The Private Securities Litigation Reform Act
of 1995. These forward-looking statements include statements concerning (i)
financial targets and expectations, and progress toward our targeted business
model, including financial guidance for the fiscal quarter ending March 31, 2012 regarding revenue,
non-GAAP gross margin and Adjusted EBITDA, (ii) the impact to our operations and
financial condition attributable to the flooding in Thailand, and our recovery
efforts related to the flooding, (iii) sources for improvement of gross margin and operating
expenses, (iv) the progress on our strategic initiatives, including our merger with
Opnext, (v) our cash position and financial resources, and (vi) our position
with respect to our product roadmap and our ability to introduce new products. Such statements
can be identified by the fact that they do not relate strictly to historical or current
facts and may contain words such as “anticipate,”
“estimate,” “expect,” “project,” “intend,” “plan,” “believe,” “will,” “should,” “outlook,” “could,” “target,” and other
words and terms of similar meaning in connection the any discussion of future
operations or financial performance. There are a number of important
factors that could cause actual results or events to differ materially from those indicated by such forward-
looking statements, including (i) the impact to our operations and financial condition
attributable to the flooding in Thailand, (ii) the impact of continued
uncertainty in world financial markets and any resulting reduction in demand for our products, (iii) our
ability to maintain our gross margin, (iv) the effects of fluctuating product mix on
our results, (v) our ability to timely develop and commercialize new products,
(vi) our ability to respond to evolving technologies and customer requirements, (vii) our
dependence on a limited number of customers for a significant percentage of our
revenues, (viii) our ability to effectively compete with companies that have
greater name recognition, broader customer relationships and substantially greater financial,
technical and marketing resources than we do, (ix) the future performance of Oclaro,
Inc. following the closing of acquisitions and mergers, (x) our ability to
efficiently and effectively transition to an outsourced back-end assembly and test model over the
next three years, (xi) the potential inability to realize the expected benefits and
synergies of acquisitions and mergers, (xii) increased costs related to
downsizing and compliance with regulatory compliance in connection with such downsizing,
competition and pricing pressure, (xiii) the potential lack of availability of credit
or opportunity for equity based financing, (xiv) the risks associated with our
international operations, (xv)the outcome of tax audits or similar proceedings, (xvi) the outcome of
pending litigation against the company, (xvii) our ability to increase our cash
reserves and obtain financing on terms acceptable to us, and (xviii) other
factors described in Oclaro's most recent annual report on Form 10-K, most recent quarterly reports on Form
10-Q and other documents we periodically file with the SEC. The
forward-looking statements included in this presentation represent Oclaro's
view as of the date of this announcement. Oclaro anticipates that subsequent events and developments may
cause Oclaro’s views and expectations to change. Oclaro specifically
disclaims any intention or obligation to update any forward-looking
statements as a result of developments occurring after the date of this presentation. |
 ©
Oclaro 2011
3
FY12 Q3 Result |
 ©
Oclaro ™
4
Summary of Q3 FY 2012
•
Revenues of $88.7 million; $4 million negative impact due to short-term work
stoppage in Shenzhen.
•
Non-GAAP gross margins: 16% compared to guidance range of 14% to 19%.
•
Adjusted EBITDA ($9.9M) compared to guidance range of ($13.5M) to ($9M).
•
Cash position at $51.1M on March 31, 2012 (includes additional $6 million
drawn under line of credit) compared to $54.2 million end of December
2011.
•
Progress on strategic initiatives continues for long-term scalability and to
maximize our long term return on invested capital:
Thailand flood recovery largely complete. Final products (WSS,
modulators) to return to full capacity by end June.
Cost reduction and margin improvement progressing, demonstrated
by on-target Q3 2012 non-GAAP gross margin and adjusted EBITDA
results.
Back end assembly and test to be outsourced completely within
three years, through Fabrinet agreement and transition to Venture.
Merger announced with Opnext
to establish new industry leader with
broad product portfolio, technology innovation, engineering
resources, cost structure and strategic customer relationships
expected to expand growth and long-term shareholder value.
Financial Summary
Financial Summary
for March Quarter
for March Quarter
Progress on
Progress on
Strategic Initiatives
Strategic Initiatives |
 ©
Oclaro ™
New Telecom
Product
Momentum
•
Joint
collaboration
with
Huawei
–
Oclaro
optimized
performance of tunable InP laser to deliver ultra-fast switching
capability.
•
New tunable 100G DWDM CFP transceiver that utilizes 4x28G
wavelengths to deliver a 2.5x improvement in spectral
efficiency.
•
New family of intra-node amplifiers offsets losses inside 100G,
400G, and 1T channel ROADM network architectures
•
Oclaro MI8000XM 100G coherent transponder module now
fully integrated with Oclaro components.
•
Industry’s first 1x23 WSS with 10X faster switching speeds.
•
40G and 100G coherent portfolio strengthened:
•
New micro-ITLA delivers 3x reduction in size
•
100G coherent receiver reduces form factor by 50%
•
New 40G and 100G modulators now in volume
production
New Product Momentum
5 |
 ©
Oclaro ™
6
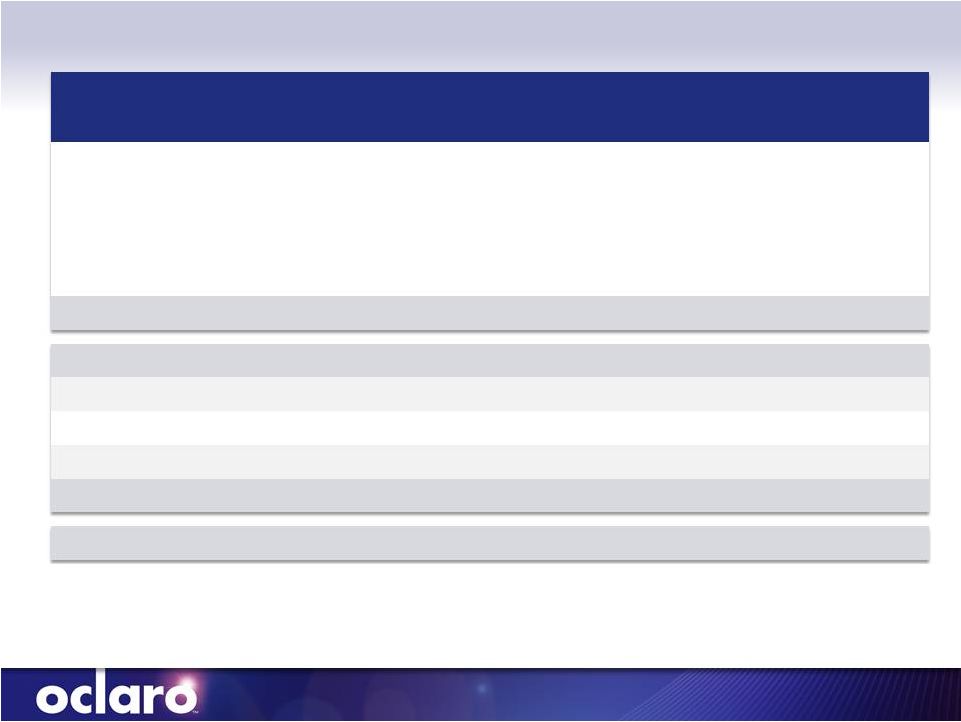
Financial Results
(1)
Telecom Components include lasers, modulators, laser pumps, receivers and integrated
lasers and modulators. (2)
Transmission Modules include 10G and 40G transponders and transceivers.
(3)
Amplification, Filtering & Optical Routing includes amplifiers, micro-optics,
dispersion compensation, wavelength select switching (WSS) modules, and
subsystems and ROADM line cards. (4)
Industrial & Consumer includes high power lasers and VCSELs.
(5)
See tabular reconciliation to comparable GAAP numbers on page 15.
$ millions
FQ2-11
DEC-10
FQ3-11
MAR-11
FQ4-11
JUN-11
FQ1-12
SEP-11
FQ2-12
DEC-11
FQ3-12
Mar-12
Telecom Components
1
$ 35.8
$ 33.9
$ 31.1
$ 24.8
$ 22.3
$ 23.5
Transmission Modules
2
24.9
24.2
22.2
24.0
31.4
28.3
Amplification, Filtering & Optical
Routing
3
47.4
44.2
41.2
40.0
20.6
23.6
Industrial & Consumer
4
12.3
13.4
14.6
17.1
12.2
13.3
Total Revenues
120.3
115.7
109.2
105.8
86.5
88.7
Gross Profit (non-GAAP)
36.1
28.8
25.0
24.3
11.3
14.1
Gross Margin %
30%
25%
23%
23%
13%
16%
R&D (non-GAAP)
5
15.3
16.9
18.5
17.3
16.7
14.7
SG&A (non-GAAP)
5
14.2
15.2
15.8
16.6
13.5
14.0
Non-GAAP Operating Income
$ 6.6
$ (3.3)
$ (9.4)
$ (9.6)
$
(18.9)
$
(14.6)
Adjusted EBITDA
$ 10.1
$ 0.7
$ (4.7)
$ (4.5)
$ (14.3)
$ (9.9) |
 ©
Oclaro ™
7
Q3 FY2012 Financial Summary and Q4 Outlook
(G) –
Guidance Range as of April 26, 2012
Gross Margin %
Revenue ($M)
Adjusted EBITDA ($M)
Outlook FY Q4 2012
Revenue (G)
Gross Margin (G)
(Non-GAAP)
Adj. EBITDA (G)
$100M to 109M
19% to 23%
($6.5M) to ($1M)
(Non-GAAP) |
 ©
Oclaro ™
8
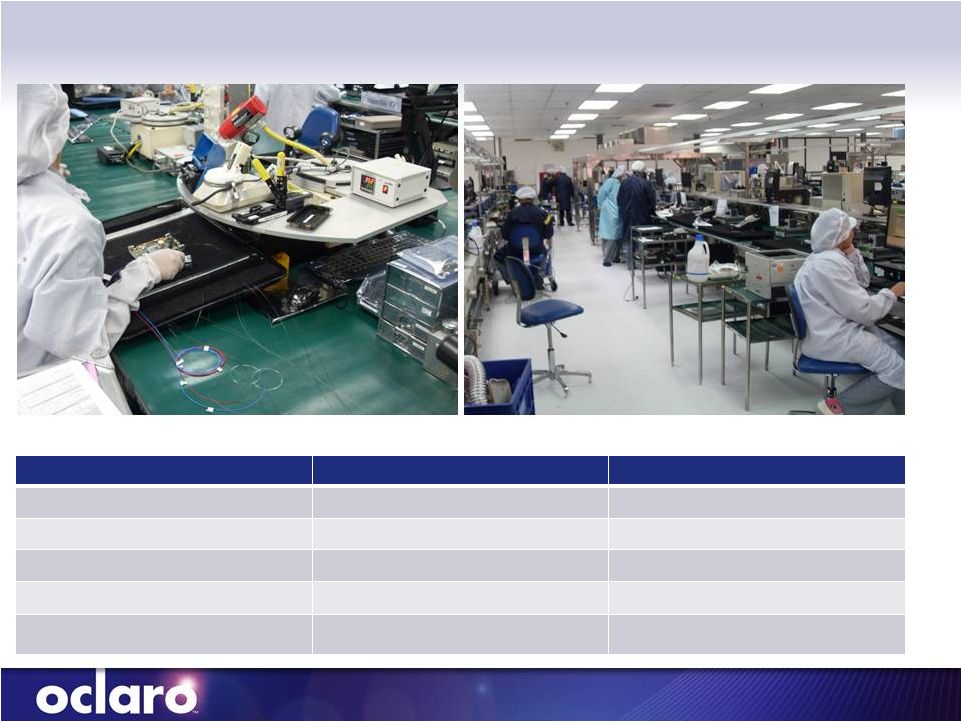
Thailand Flood Recovery Efforts
Fabrinet Pinehurst Restart*
Commercial Shipments
Pre-Flood Production Capacity Expected
High Powered Lasers
November 2011
Achieved
Tunable Dispersion Compensators
End January
February
Amplifiers
December
March
Lithium Niobate External Modulators
January
June
WSS (shipments continue from other Western
sites)
May
June |
 ©
Oclaro ™
Q3 FY2012 Summary
•
Revenue impacted by flood and short-term work stoppage in
Shenzhen
•
Our focus on execution resulted in gross margin and Adjusted
EBITDA within guidance ranges
•
Making progress on strategic initiatives for long-term scalability of
our business and to maximize long-term return on invested
capital:
9
-
Through the Fabrinet agreement and transition to Venture,
back-end assembly and test expected to be outsourced
completely within three years
-
Proposed merger with Opnext expected to put us in the #2
position in the optical components and modules market.
Integration planning progressing with close targeted for July
-
Working to have plans in place to be non-GAAP operating
margin positive in the December 2012 quarter and to realize
$35M to $45M of annualized synergies by the December 2013
quarter |
 ©
Oclaro ™
10
Trended Financial Slides |
 ©
Oclaro ™
11
Non-GAAP Financial Measures
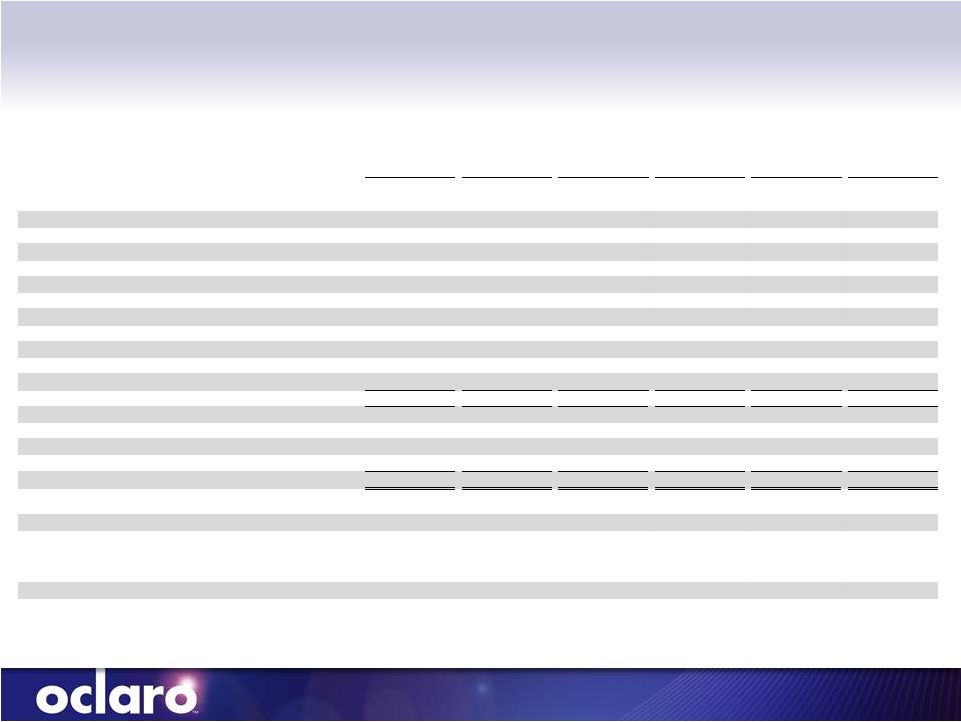
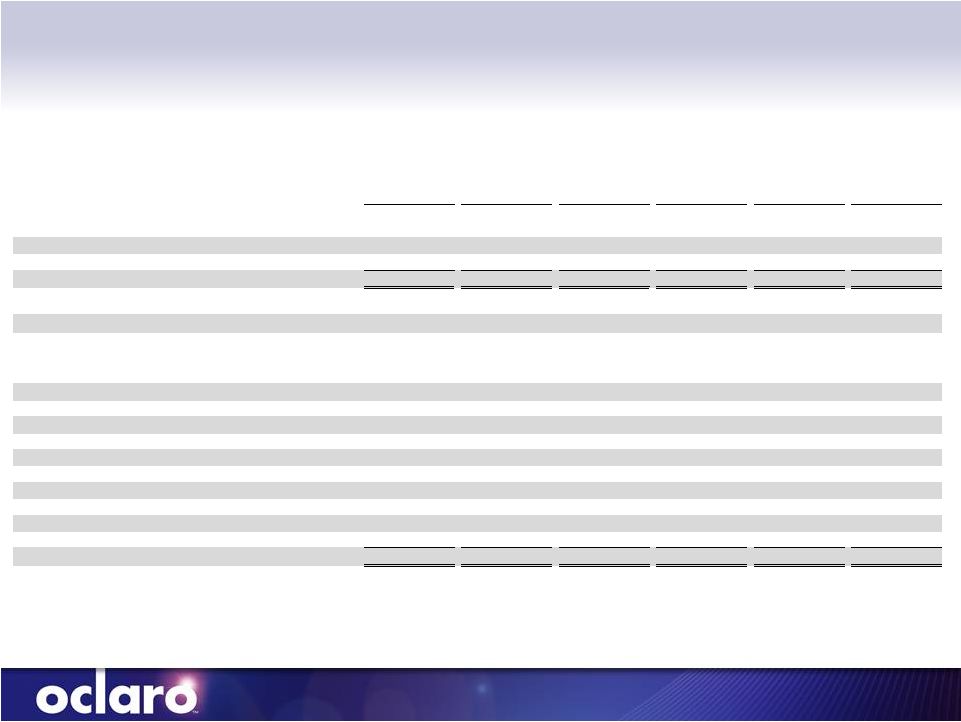
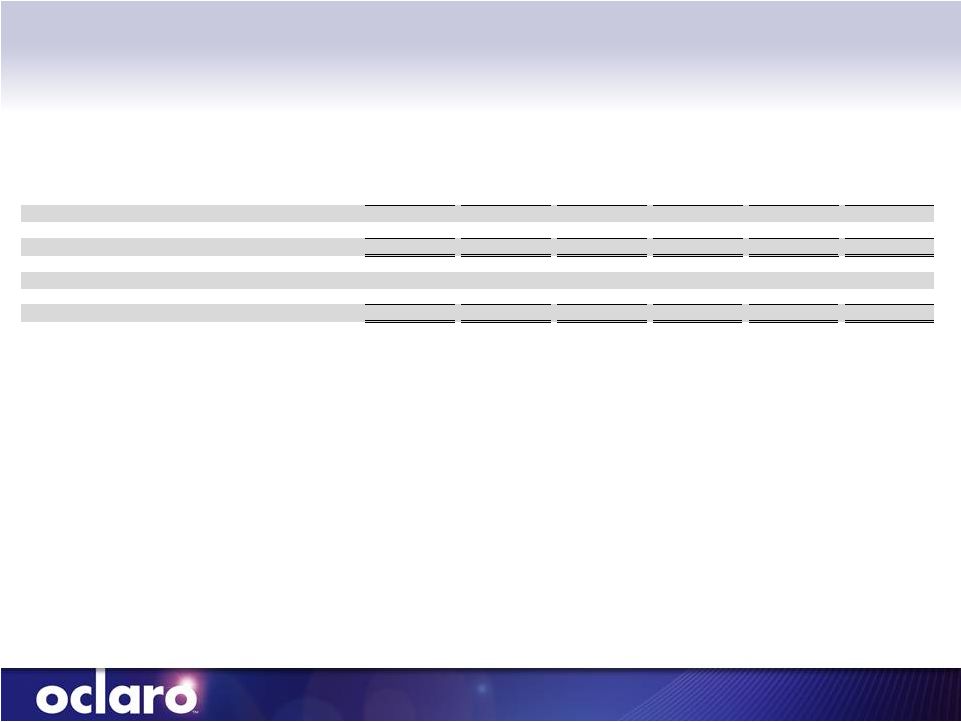
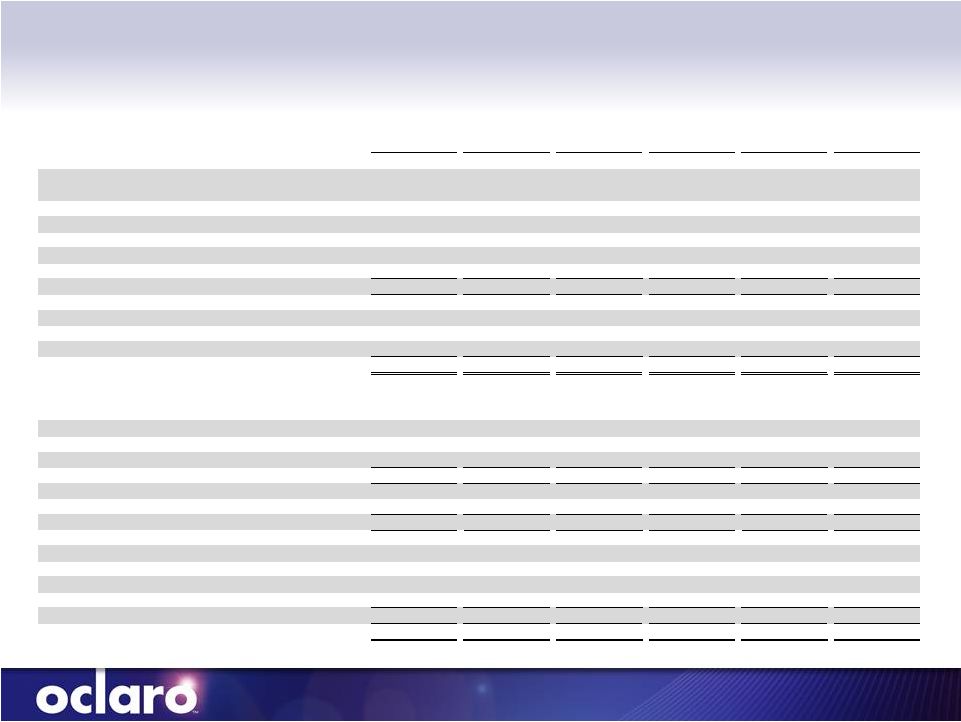
Oclaro provides certain supplemental non-GAAP financial measures to its investors
as a complement to the most comparable GAAP measures. The GAAP measure most
directly comparable to non-GAAP gross margin rate is gross margin rate. The GAAP
measure most directly comparable to non-GAAP operating income/loss is operating
income/loss. The GAAP measure most directly comparable to non-GAAP net
income/loss and Adjusted EBITDA is net income/loss. An explanation and reconciliation
of each of these non-GAAP financial measures to GAAP information is set forth
below.
Oclaro believes that providing these non-GAAP measures to its investors, in
addition to corresponding income statement measures, provides investors the
benefit of viewing Oclaro’s performance using the same financial metrics that the
management team uses in making many key decisions and evaluating how Oclaro’s
“core operating performance” and its results of operations may look in
the future. Oclaro defines “core operating performance” as its on-going performance in the
ordinary course of its operations. Items that are non-recurring or do not
involve cash expenditures, such as impairment charges, income taxes,
restructuring and severance programs, costs relating to specific major projects, such as acquisitions,
non-cash compensation related to stock and options and certain expenses related to
flooding in Thailand, including impairment of fixed assets and inventory, are
not included in Oclaro’s view of “core operating performance.” Management
does not believe these items are reflective of Oclaro’s ongoing core operations
and accordingly excludes those items from non-GAAP gross margin rate,
non-GAAP operating income/loss, non-GAAP net income/loss and Adjusted EBITDA.
Additionally, each non-GAAP measure has historically been presented by Oclaro as a
complement to its most comparable GAAP measure, and Oclaro believes that the
continuation of this practice increases the consistency and comparability of
Oclaro’s earnings releases.
Non-GAAP financial measures are not in accordance with, or an alternative for,
generally accepted accounting principles in the United States of America.
Non-GAAP measures should not be considered in isolation from or as a substitute for financial
information presented in accordance with generally accepted accounting principles, and
may be different from non-GAAP measures used by other companies. |
 ©
Oclaro ™
12
Non-GAAP Financial Measures
Non-GAAP Gross Margin Rate
Non-GAAP gross margin rate is calculated as gross margin rate as determined in
accordance with GAAP (gross profit as a percentage of revenues) excluding
non-cash compensation related to stock and options. Oclaro evaluates its performance using non-GAAP gross
margin rate to assess Oclaro’s historical and prospective operating financial
performance, as well as its operating performance relative to its competitors.
Non-GAAP Operating Income/Loss
Non-GAAP operating income/loss is calculated as operating income/loss as determined
in accordance with GAAP excluding the impact of amortization of intangible
assets, restructuring, acquisition and related costs, non-cash compensation related to stock and options
granted to employees and directors, certain other one-time charges and credits and
excluding any flood related impairment of fixed assets and inventory and related
income (expenses) specifically identified in the non-GAAP reconciliation schedules set forth below.
Oclaro evaluates its performance using, among other things, non-GAAP operating
income/loss in evaluating Oclaro’s historical and prospective operating
financial performance, as well as its operating performance relative to its competitors.
Non-GAAP Net Income/Loss Non-GAAP net
income/loss is calculated as net income/loss excluding the impact of restructuring, acquisition and related costs, Thailand
flood-related expenses, non-cash compensation related to stock and options
granted to employees and directors, net foreign currency translation
gains/losses, the impact of amortization of intangible assets and certain other one-time charges and credits specifically
identified in the non-GAAP reconciliation schedules set forth below. Oclaro uses
non-GAAP net income/loss in evaluating Oclaro’s historical and
prospective operating financial performance, as well as its operating performance relative to its competitors.
Adjusted EBITDA Adjusted EBITDA
is calculated as net income/loss excluding the impact of income taxes, net interest income/expense, depreciation and
amortization, net foreign currency translation gains/losses, as well as restructuring,
acquisition and related costs, non-cash compensation related to stock and
options and certain other one-time charges and credits, including flood related impairment of fixed assets and
inventory and related income (expenses), specifically identified in the non-GAAP
reconciliation schedules set forth below. Oclaro uses Adjusted EBITDA in
evaluating Oclaro’s historical and prospective cash usage, as well as its cash usage relative to its competitors.
Specifically, management uses this non-GAAP measure to further understand and
analyze the cash used in/generated from Oclaro’s core operations. Oclaro
believes that by excluding these non-cash and non-recurring charges, more accurate expectations of its future cash
needs can be assessed in addition to providing a better understanding of the actual
cash used in or generated from core operations for the periods presented.
Oclaro further believes that providing this information allows Oclaro’s investors greater transparency and a better
understanding of Oclaro’s core cash position.
|
 ©
Oclaro ™
13
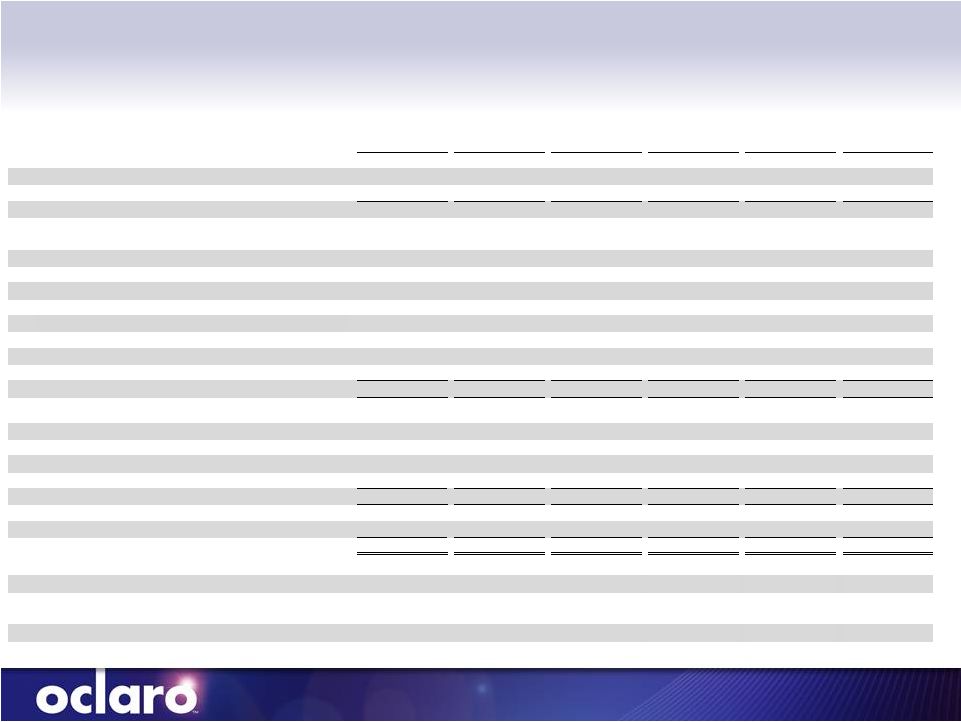
Income Statement (unaudited, in thousands, except per share
amounts) (Millions, except per share amounts)
Q2 FY11
Q3 FY11
Q4 FY11
Q1 FY12
Q2 FY12
Q3 FY12
Dec-10
Mar-11
Jun-11
Sep-11
Dec-11
Mar-12
120.3
$
115.7
$
109.2
$
105.8
$
86.5
$
88.7
$
84.6
87.3
84.5
81.8
75.6
75.0
35.7
28.4
24.7
24.0
10.9
13.7
GAAP gross margin rate
29.7%
24.6%
22.6%
22.7%
12.6%
15.4%
Operating expenses:
Research and development
15.7
17.2
18.9
17.7
17.0
15.0
Selling, general and administrative
15.1
16.1
16.7
17.5
14.4
14.9
Amortization of intangible assets
0.7
0.7
0.7
0.7
0.7
0.8
Restructuring, acquisition and related costs
0.9
1.0
1.9
(1.8)
3.2
2.2
Flood-related income (expense),net
-
-
-
-
9.1
(3.3)
Legal settlements
1.7
-
-
-
-
-
Impairment of goodwill
-
-
20.0
-
-
-
(Gain) loss on sale of property and equipment
(0.0)
0.0
0.1
0.1
0.0
(0.0)
Total operating expenses
34.1
35.1
58.3
34.2
44.5
29.6
Operating income (loss)
1.6
(6.6)
(33.6)
(10.2)
(33.6)
(15.9)
Interest income (expense), net
(0.5)
(0.5)
(0.5)
(0.2)
(0.2)
(0.3)
Gain (loss) on foreign currency translation
(1.1)
(2.0)
(2.4)
1.4
1.3
(0.3)
Other income (expense)
-
-
-
-
2.2
-
(1.6)
(2.5)
(2.9)
1.2
3.3
(0.6)
0.0
(9.2)
(36.5)
(9.0)
(30.4)
(16.5)
0.3
0.7
0.2
5.6
0.5
0.7
Net loss
(0.2)
$
(9.8)
$
(36.7)
$
(14.6)
$
(30.8)
$
(17.2)
$
Net loss per share:
Basic
(0.00)
$
(0.20)
$
(0.75)
$
(0.29)
$
(0.61)
$
(0.34)
$
Diluted
(0.00)
$
(0.20)
$
(0.75)
$
(0.29)
$
(0.61)
$
(0.34)
$
Shares used in computing net loss per share:
Basic
48.3
48.6
48.8
49.4
50.5
50.8 Diluted
48.3
48.6
48.8
49.4
50.5
50.8 OCLARO, INC.
CONDENSED CONSOLIDATED STATEMENTS OF OPERATIONS
Revenues
Cost of revenues
Gross profit
Other income (expense):
Total other income (expense)
Income (loss) before taxes
Income tax provision |
 ©
Oclaro ™
14
RECONCILIATION OF GAAP FINANCIAL MEASURES
TO NON-GAAP FINANCIAL MEASURES
(Millions, except per share amounts)
Q2 FY11
Q3 FY11
Q4 FY11
Q1 FY12
Q2 FY12
Q3 FY12
Dec-10
Mar-11
Jun-11
Sep-11
Dec-11
Mar-12
GAAP net loss
(0.2)
$
(9.8)
$
(36.7)
$
(14.6)
$
(30.8)
$
(17.2)
$
Stock-based compensation included in:
Cost of revenues
0.4
0.4
0.4
0.3
0.4
0.5
Research and development
0.4
0.3
0.4
0.4
0.4
0.3
Selling, general and administrative
0.9
0.9
0.9
0.9
0.9
0.9
Amortization expense
0.7
0.7
0.7
0.7
0.7
0.8
Restructuring, acquisition and related costs
0.9
1.0
1.9
(1.8)
3.2
2.2
Flood-related income (expense), net
-
-
-
-
9.1
(3.3)
Legal Settlements
1.7
-
-
-
-
-
Impairment of goodwill
-
-
20.0
-
-
-
(Gain) loss on foreign currency translation
1.1
2.0
2.4
(1.4)
(1.3)
0.3
5.9
(4.5)
(10.0)
(15.4)
(17.4)
(15.5)
Income tax provision
0.3
0.7
0.2
5.6
0.5
0.7
Depreciation expense
3.5
4.0
4.6
5.1
4.6
4.6
Other (income) expense items, net
-
-
-
-
(2.2)
-
Interest (income) expense, net
0.5
0.5
0.5
0.2
0.2
0.3
Adjusted EBITDA
10.1
$
0.7
$
(4.7)
$
(4.5)
$
(14.3)
$
(9.9)
$
Non-GAAP net income (loss) per share:
Basic
0.12
$
(0.09)
$
(0.21)
$
(0.31)
$
(0.35)
$
(0.31)
$
Diluted
0.12
$
(0.09)
$
(0.21)
$
(0.31)
$
(0.35)
$
(0.31)
$
Basic
48.3
48.6
48.8
49.4
50.5
50.8
Diluted
51.2
48.6
48.8
49.4
50.5
50.8
OCLARO, INC.
RECONCILIATION OF GAAP FINANCIAL MEASURES TO NON-GAAP FINANCIAL MEASURES
Reconciliation of GAAP net loss to
non-GAAP net income (loss) and adjusted EBITDA:
Non-GAAP net income (loss)
Shares used in computing Non-GAAP net income
(loss) per share: |
 ©
Oclaro ™
15
RECONCILIATION OF GAAP FINANCIAL MEASURES
TO NON-GAAP FINANCIAL MEASURES
(Millions, except per share amounts)
Q2 FY11
Q3 FY11
Q4 FY11
Q1 FY12
Q2 FY12
Q3 FY12
Dec-10
Mar-11
Jun-11
Sep-11
Dec-11
Mar-12
GAAP gross profit
35.7
$
28.4
$
24.7
$
24.0
$
10.9
$
13.7
$
Stock-based compensation in cost of revenues
0.4
0.4
0.4
0.3
0.4
0.5
Non-GAAP gross profit
36.1
$
28.8
$
25.0
$
24.3
$
11.3
$
14.1
$
GAAP gross margin rate
29.7%
24.6%
22.6%
22.7%
12.6%
15.4%
Non-GAAP gross margin rate
30.0%
24.9%
22.9%
23.0%
13.0%
15.9%
GAAP operating income (loss)
1.6
$
(6.6)
$
(33.6)
$
(10.2)
$
(33.6)
$
(15.9)
$
Stock-based compensation included in:
Cost of revenues
0.4
0.4
0.4
0.3
0.4
0.5
Research and development
0.4
0.3
0.4
0.4
0.4
0.3
Selling, general and administrative
0.9
0.9
0.9
0.9
0.9
0.9
Amortization of intangible assets
0.7
0.7
0.7
0.7
0.7
0.8
Restructuring, acquisition and related costs
0.9
1.0
1.9
(1.8)
3.2
2.2
Flood-related income (expense), net
-
-
-
-
9.1
(3.3)
Legal Settlements
1.7
-
-
-
-
-
Impairment of goodwill
-
-
20.0
-
-
-
Non-GAAP operating income (loss)
6.6
$
(3.3)
$
(9.4)
$
(9.6)
$
(18.9)
$
(14.6)
$
OCLARO, INC.
Reconciliation of GAAP operating income (loss) to
non-GAAP operating income (loss):
Reconciliation of GAAP gross margin rate to
non-GAAP gross margin rate:
RECONCILIATION OF GAAP FINANCIAL MEASURES TO NON-GAAP FINANCIAL MEASURES
|
 ©
Oclaro ™
16
RECONCILIATION OF GAAP FINANCIAL MEASURES
TO NON-GAAP FINANCIAL MEASURES
(Millions)
Q2 FY11
Q3 FY11
Q4 FY11
Q1 FY12
Q2 FY12
Q3 FY12
Dec-10
Mar-11
Jun-11
Sep-11
Dec-11
Mar-12
GAAP R&D expense
15.7
$
17.2
$
18.9
$
17.7
$
17.0
$
15.0
$
Stock-based compensation in R&D expense
(0.4)
(0.3)
(0.4)
(0.4)
(0.4)
(0.3)
Non-GAAP R&D Expense
15.3
$
16.9
$
18.5
$
17.3
$
16.7
$
14.7
$
GAAP SG&A expense
15.1
$
16.1
$
16.7
$
17.5
$
14.4
$
14.9
$
Stock-based compensation in SG&A expense
(0.9)
(0.9)
(0.9)
(0.9)
(0.9)
(0.9)
Non-GAAP SG&A Expense
14.2
$
15.2
$
15.8
$
16.6
$
13.5
$
14.0
$
OCLARO, INC.
RECONCILIATION OF GAAP FINANCIAL MEASURES TO NON-GAAP FINANCIAL MEASURES
|
 ©
Oclaro ™
17
CONDENSED CONSOLIDATED BALANCE SHEETS
Q2 FY11
Q3 FY11
Q4 FY11
Q1 FY12
Q2 FY12
Q3 FY12
Dec-10
Mar-11
Jun-11
Sep-11
Dec-11
Mar-12
Current assets:
Cash, cash equivalents and short-term
investments
77.3
$
74.9
$
62.8
$
51.1
$
53.6
$
50.5
$
Restricted cash
0.8
0.9
0.6
0.6
0.6
0.6
Accounts receivable, net
105.7
96.4
82.9
81.2
59.7
61.7
Inventories
82.8
87.5
102.2
100.5
83.3
72.7
Prepaid expenses and other current assets
15.9
17.1
16.5
12.2
11.9
11.7
Assets held for sale
-
-
-
-
-
20.3
Total current assets
282.5
276.8
264.9
245.7
209.2
217.5
Property and equipment, net
54.1
64.8
69.4
69.5
63.8
59.5
Other intangible assets, net
21.1
20.4
19.7
18.9
18.2
17.5
Goodwill
30.9
30.9
10.9
10.9
10.9
10.9
Other non-current assets
10.1
10.0
10.3
14.0
12.5
12.5
Total assets
398.7
$
403.0
$
375.2
$
358.9
$
314.6
$
317.9
$
Current liabilities:
Accounts payable
61.8
$
65.0
$
66.2
$
51.3
$
38.7
$
48.7
$
Accrued expenses and other liabilities
45.5
$
47.0
$
60.7
$
50.6
$
48.5
$
48.6
$
Credit line payable
-
-
-
19.5
19.5
25.5
Total current liabilities
107.3
112.0
126.9
121.4
106.7
122.9
Deferred gain on sale-leaseback
12.9
13.2
12.9
12.3
12.0
12.1
Other long-term liabilities
14.6
15.9
6.3
6.2
6.1
6.4
Total liabilities
134.8
141.1
146.1
140.0
124.7
141.3
Stockholders' equity:
Common stock
0.5
0.5
0.5
0.5
0.5
0.5
Additional paid-in capital
1,308.5
1,312.2
1,313.9
1,322.7
1,327.1
1,328.7
Accumulated other comprehensive income
34.3
38.5
40.7
36.4
33.7
36.1
Accumulated deficit
(1,079.5)
(1,089.3)
(1,126.1)
(1,140.7)
(1,171.5)
(1,188.6)
Total stockholders' equity
263.9
261.9
229.1
219.0
189.9
176.6
Total liabilities and stockholders’ equity
398.7
$
403.0
$
375.2
$
358.9
$
314.6
$
317.9
$
LIABILITIES AND STOCKHOLDERS’ EQUITY
ASSETS
OCLARO, INC.
CONDENSED CONSOLIDATED BALANCE SHEETS |
