Attached files
| file | filename |
|---|---|
| 8-K - FORM 8-K - Tower Group International, Ltd. | d317461d8k.htm |
 1.
March 19, 2012
Investor Presentation
NYSSA 16th Annual Insurance Conference
Exhibit 99.1 |
| 1
Forward-Looking Statements
The Private Securities Litigation Reform Act of 1995 provides a "safe
harbor" for forward-looking statements. This press release and
any other written or oral statements made by or on behalf of Tower may
include forward-looking statements that reflect Tower's current views with
respect to future events and financial performance. All statements other
than statements of historical fact included in this press release are
forward-looking statements. Forward-looking statements can generally be identified by the use of
forward-looking terminology such as "may," "will,"
"plan," "expect," "project," "intend," "estimate,”
"anticipate," "believe" and "continue" or their
negative or variations or similar terminology. All forward- looking
statements address matters that involve risks and uncertainties. Accordingly, there are or will be
important factors that could cause the actual results of Tower to differ
materially from those indicated in these statements. Please refer to
Tower's filings with the SEC, including among others Tower's Annual
Report on Form 10-K for the year ended December 31, 2011 for a description
of the important factors that could cause the actual results of Tower to
differ materially from those indicated in these statements.
Forward-looking statements speak only as of the date on which they are
made, and Tower undertakes no obligation to update publicly or revise
any forward-looking statement, whether as a result of new
information, future developments or otherwise.
Notes on Non-GAAP Financial Measures
(1)
Operating income excludes realized gains and losses, acquisition-related
transaction costs and the results of the reciprocal business, net of
tax. Operating income is a common measurement for property and casualty
insurance companies. We believe this presentation enhances the understanding of our results of
operations by highlighting the underlying profitability of our insurance
business. Additionally, these measures are a key internal management
performance standard. Operating earnings per share is operating income
divided by diluted weighted average shares outstanding. Operating return on equity is annualized
operating income divided by average common stockholders' equity.
(2)
Total premiums include gross premiums written through our insurance
subsidiaries and produced as managing general agent on behalf of other
insurance companies. |
| 2
Presentation Outline
I. Overview of Tower
II. Strategy
III. Financial Review
IV. Summary |
 I. Overview of Tower
3 |
 4
Diversified
Property
and
Casualty
Insurance
Company
With
a
Niche
Focus
•
Headquartered in New York City
•
Over 20 year track record of excellent operating performance
•
Top 50 P&C insurance company in U.S., rated “A-" by A.M. Best
with positive outlook •
2011 GPW of $1.8B and over $1B in equity
Broad Product Offering
Expanding National Presence
•
20 offices nationwide
•
Over 1400 employees
Overview of Tower (“TWGP”)
Commercial General
Commercial Specialty
Personal Lines
Home and auto |
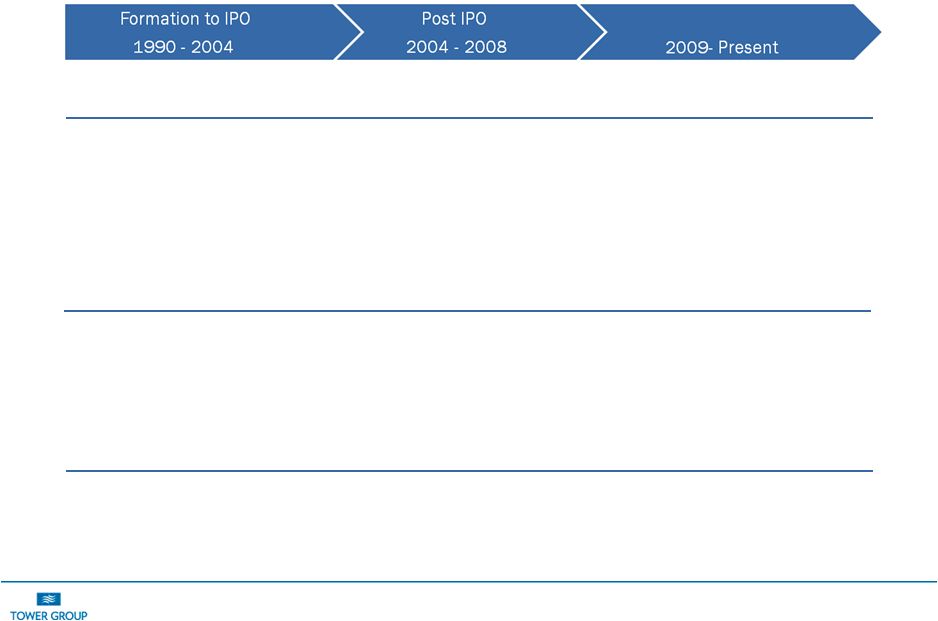 5
Our 20-Year History
Insurance company formation
in 1990/MGA in 1996
IPO in October, 2004;
CastlePoint formation in 2006
CastlePoint merger in 2009
80% of premiums transferred to
reinsurers and other insurance
companies
Approximately 50% of
premiums transferred to
CastlePoint
86% of premiums retained;
Deployed capital from CastlePoint
to make acquisitions; Implemented
organic growth initiative
Commercial lines and
homeowners business
Commercial lines and
homeowners business
Commercial/Specialty/ Personal
New York City
Northeast with limited
expansion nationally
Primarily U.S. with limited
international business
$0 to $230 million in premiums
$805 million in premiums in 2008
$1.8B in premiums in 2011
$2 million to $18 million in capital
$319 million in capital
$1B + in capital
Summary
Product / Geographical Focus
GPW & Managed / Capital |
 II. Strategic Review
6 |
 7
Strategies
Expand products, Geography
and Distribution
Focus on niche markets,
specialize and customize
Expand non-risk-bearing
sources of revenue
Generate organic growth
Acquire insurance companies
or make strategic investments
in distribution sources
Diversification and favorable
ratio of premium volume
opportunity to capital
Significantly outperform
industry results in growth and
profitability
Increase ROE by generating
commission and fee income
Achieve scale and expand into
targeted products and markets
Consolidate and expand into
targeted products and markets
Advantage
Tower’s Strategic Responses to Marketplace Challenges
|
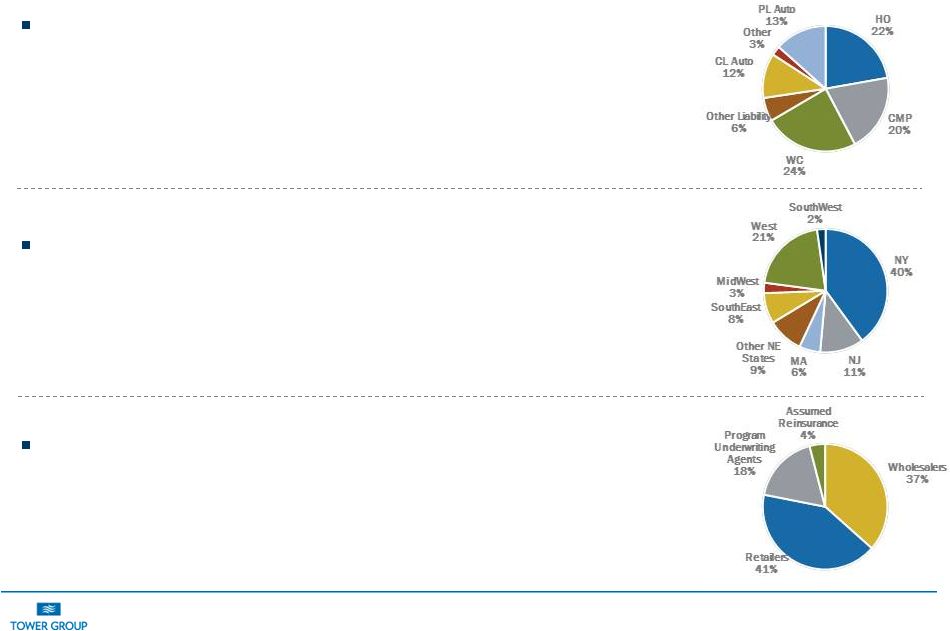 8
Diversification Strategy
FY 2011
Products
•
Strong track record of developing and expanding
product lines
Geography
•
Leverage existing products across the country
Distribution
•
Build different distribution sources to capitalize on
market opportunities |
 9
Business Segment Strategy
Commercial
Customers
Products
Underwriting
Strategy
Personal
General
Specialty
Comprehensive product
offering to small business
owners
Narrowly focused
customized specialty
products
Individual homeowners and
drivers
Apartment buildings, retail
stores, restaurants and
artisan contractors
Garage liability, commercial
construction, specialty
transportation, professional
employers organizations and
Lloyd’s business
Homeowners, auto and
package
Focus on personal package
policies to differentiate from
direct writers
Use reciprocal structures to
provide additional capacity
and generate fee income
Expand specialty classes of
business
Customize products for select
industries and key producers
Partner with specialty
underwriting managers,
including Lloyd’s syndicates
Focus on small segment
Improve scale and
automation
Leverage products across the
country |
 10
Growth in Fee Income
Higher ROE Results From Generating Commission and Fee Income
•
Fully
leveraged
capital
in
our
own
company
after
the
CastlePoint
acquisition
in
2009
•
Began generating fee income by transferring premiums to reinsurers and other
insurance companies after the One Beacon personal lines acquisition in
July 2010 »
Generated
$63.3
million
in
commission
and
fee
income
in
2011,
up
from
$55.8
million in
same period last year. |
 11
Organic Growth Initiative
Expand Products
•
Expand our product lines platform
•
Develop products for target industry and customer groups
•
Leverage existing products across the country
Develop entrepreneurs
•
Transform our existing business units into self-sufficient operating
units •
Create new business units to expand into new producers and markets
•
Acquire underwriting talent to support organic growth
Improve business processes related to organic growth
•
Create
a
new
department
to
research,
identify
and
analyze
growth
opportunities
•
Improve our ability to develop products
•
Improve corporate marketing and communication
•
Redesign business development to improve our ability to understand and deliver
products to meet the needs of our producers
•
Create a separate independent customer service department to ensure delivery
of superior customer service |
 12
Improved Market Conditions and Outlook
Positive market trends emerged in 2011
•
Strong organic growth (10%) from two newly created business units
»
customized solutions and assumed reinsurance generated GPW of $158
million in 2011
•
Favorable pricing trends emerged in 4Q of 2011
»
2.3% renewal rate increase for all businesses excluding program business
and assumed reinsurance
Outlook for 2012
•
Continued implementation of organic growth initiative
»
New lines of business: Surety, inland marine and commercial property
»
Creating new business units and developing several joint ventures with
managing general agencies and Lloyd’s syndicates
»
Developing a growing pipeline of new products and market opportunities
•
Continue to drive meaningful pricing increases in 2012
»
Meaningful rate increases in certain areas, such as California
workers’ compensation and assumed reinsurance businesses
|
 An Opportunistic Acquisition Strategy
Target small insurance and
managing general agencies
Strategic investments in
distribution sources
Seek acquisitions and make
strategic investments to expand
into new products, markets and
accomplish strategic objectives
Successful track record in
creating value through
expense reduction, re-
underwriting and cross selling
VALUE CREATION
PROFILE OF TARGETS
STRATEGY
13 |
 III. Financial Review
14 |
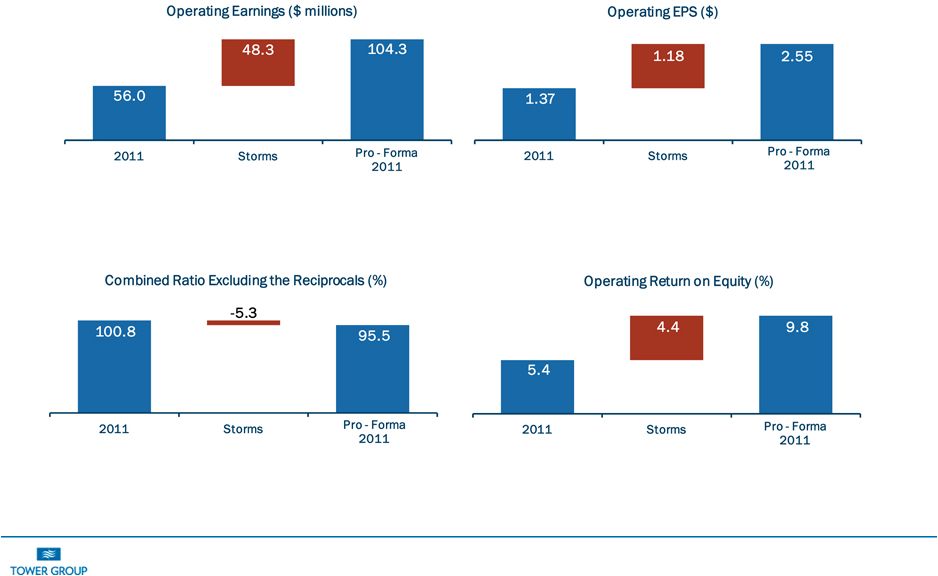 15
2011 Highlights
Excluding the effect of storm losses, operating earnings would have been $104.3
million in 2011 compared to $109.2 million in 2010
Excluding the effect of storm losses, operating EPS would have been $2.55 in
2011 compared to $2.50 in 2010
Excluding the effect of storm losses, operating ROE would have been 9.8%
in 2011 and 10.4% in 2010.
Excluding
the
effect
of
storm
losses
,
Combined
Ratio
Excluding
the
Reciprocals
would have been 95.5% in 2011 and 93.9% in 2010.
|
 16
Hurricane Irene’s Impact on Tower
Losses from Irene represented Tower’s single largest loss event in its
history •
Hurricane Irene was the first Hurricane to make landfall in the tri-state
region (NY, NJ and CT) since Gloria in 1985 and the first to make
landfall in NJ since 1903 •
$45M pre-tax loss from Irene is higher than Tower’s total catastrophe
losses throughout its history
•
Tower
was
ranked
6
with
3.9%
market
share
for
the
lines
of
business
affected
by
Irene
in
NJ,
NY
and
CT,
but
its
reported
loss
was
only
1%
of
the
total
estimated
industry
loss ($4.5B)
Tower’s property business has been historically very profitable and not
prone to catastrophe losses
•
Tower’s homeowners and commercial multiple peril ratio has averaged 50.7%
since 2005,
with
catastrophe
losses
contributing
only
a
minimal
amount
to
this
figure
•
Normal winter storm activity has historically had a minimal impact on
Tower’s earnings Favorable pricing trends and market
opportunity •
Homeowners and commercial property rates are expected to improve
•
Anticipate meaningful growth opportunity in 2012
th |
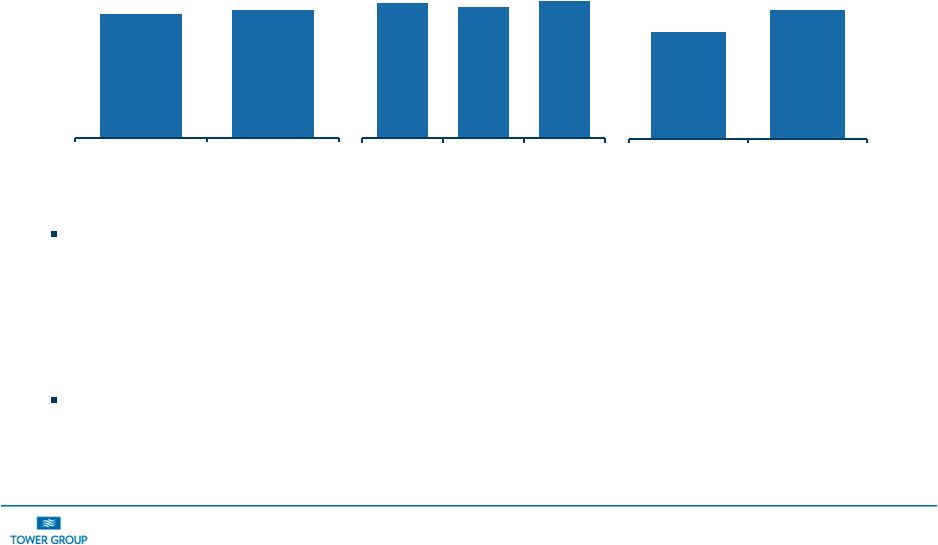
 17
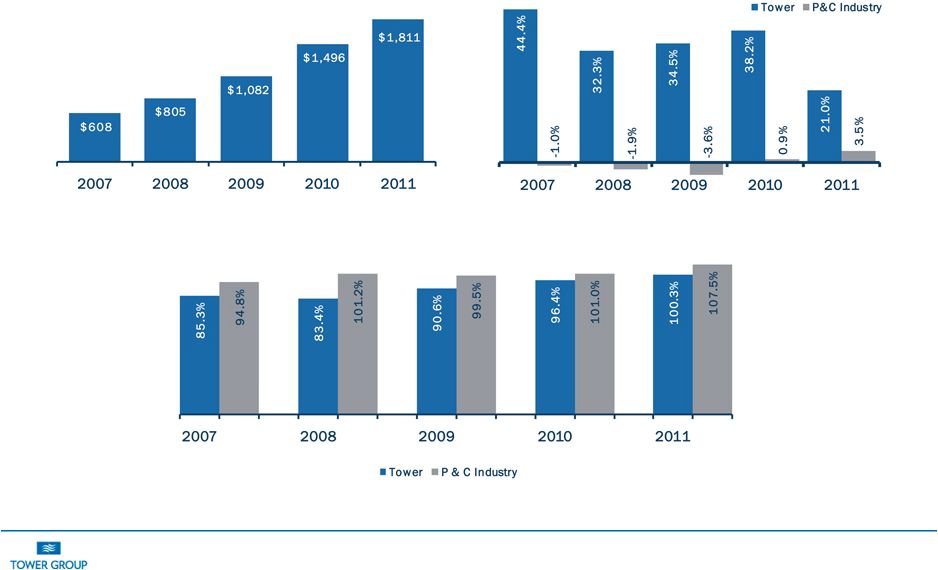
Strong and Consistent Track Record of Profitable Growth
AM Best and Company Data.
Total Premium Growth
Combined Ratio
Gross Premiums Written and Produced |
 18
23.2
23.3
45.0
41.5
39.2
2007
2008
2009
2010
2011
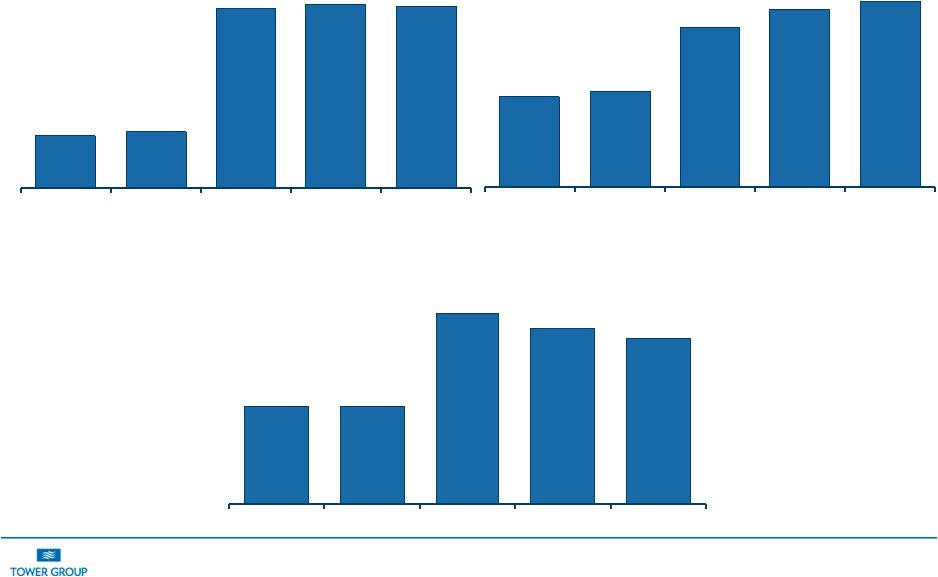
Strong Track Record of Book Value Growth
Book Value Per Share*
*TWGP paid cash dividends of $0.15, $0.20, $0.26, $0.39 and $0.69 per share in
2007, 2008, 2009, 2010 and 2011 respectively.
Shareholders’
Equity
Shares Outstanding
$12.74
$13.67
$22.72
$25.19
$26.37
2007
2008
2009
2010
2011
$295
$319
$1,022
$1,045
$1,034
2007
2008
2009
2010
2011 |
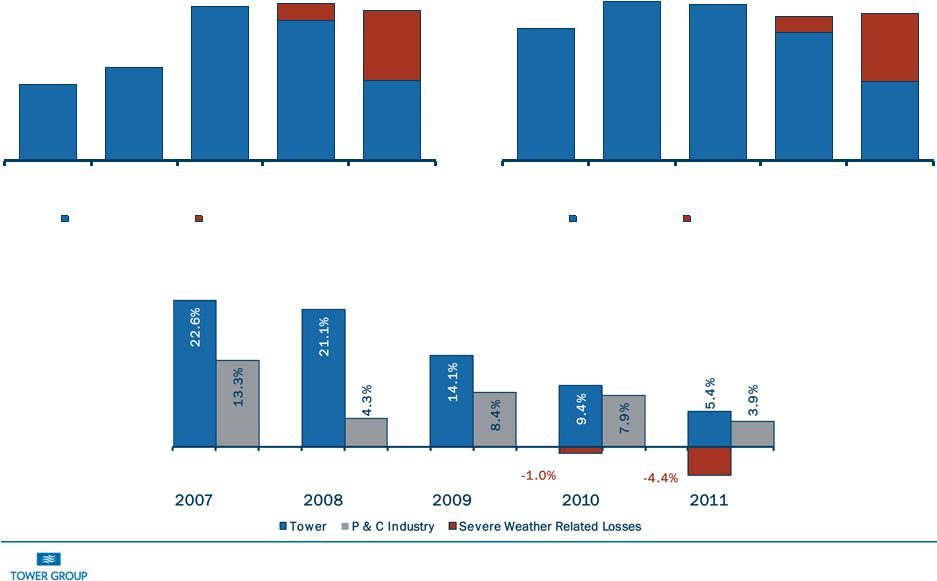 19
$2.29
$2.76
$2.71
$2.23
$1.37
$0.27
$1.18
2007
2008
2009
2010
2011
Operating EPS
Severe Weather Related Losses
$52.9
$64.8
$107.3
$97.2
$56.0
$12.0
$48.3
2007
2008
2009
2010
2011
Operating Income
Severe Weather Related Losses
Strong Track Record of Operating Earnings and ROE
Operating Income
in millions
Operating Earnings Per Share
Operating ROE |
 20
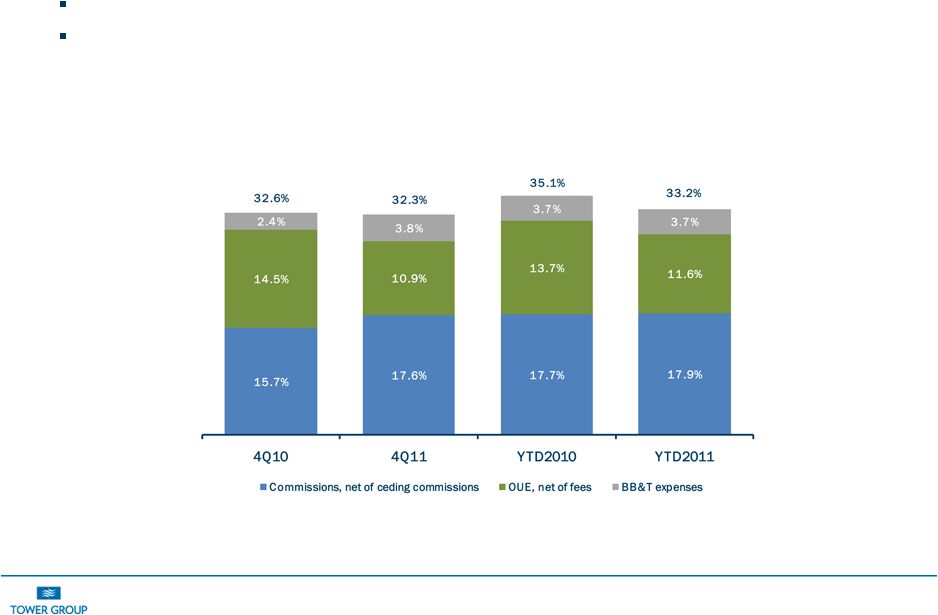
Declining Expense Ratio
Increase in premium volume is creating scale advantages for Tower
As systems initiatives relating to personal lines are completed,
we expect this scale advantage
to increase
Net Expense Ratio Excluding Reciprocals |
 21
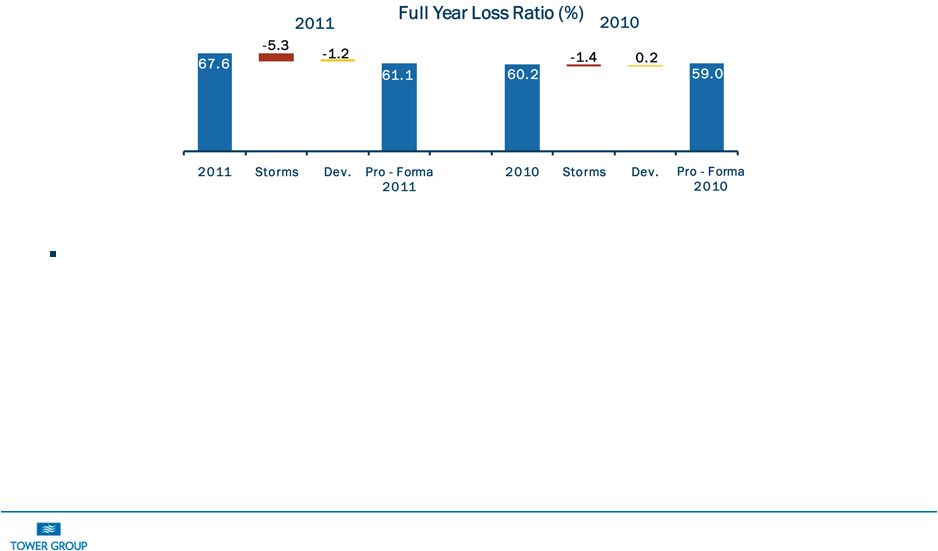
Loss Ratio and Reserves
2011 net adverse development of $17.0 million at Tower stock companies was from
December 2010 winter storm ($7M) and $10 M from discontinued programs
that we ceased underwriting in 2010 and 2011
|
 22
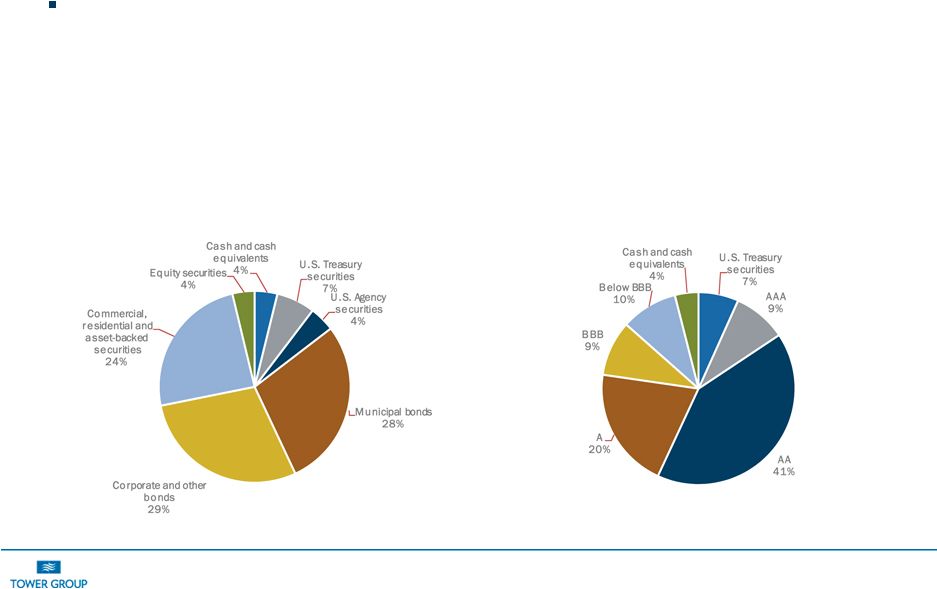
Highly Rated Investments
Our high-quality investment portfolio had net unrealized pre-tax gains
of $115 million at December 31, 2011 attributable to Tower
shareholders •
Fixed income average quality of A+
•
Duration of 4.8 years
•
Tax equivalent book yield of 4.8%
Asset allocation
Asset quality |
 23
Improving Investment Performance and Alternative
Investments Strategy
Strategy
•
Alternative investment commitment remains modest but should provide higher
yield and diversification from interest rate risk inherent in
fixed-income investments, and reduce capital markets
volatility •
Operating cash flows also invested in opportunistic repurchases of Tower
common stock since March 2010
Examples of Alternative Investments
•
Private equity type investments in small real estate projects
•
Minority ownership in distribution partners that have a strategic fit with
Tower $2,615
$2,701
12-31-2010
12-31-2011
Cash and Invested Assets
($millions)
4.7
4.6
4.8
6-30-2011
9-30-2011
12-31-2011
Tax-
Equivalent Fixed Income
Yield (%)
$106
$128
YTD 2010
YTD 2011
Net Investment Income
($millions) |
 24
Capital Management
Strong Capitalization With Limited Need for Additional Capital
•
Significant growth in stockholders equity (from $319 million at December 2008
to $1 billion currently) •
Limited additional capital needed due to strong retained earnings and the use
of hybrid business model Use of Capital Management Tool to Deliver
Immediate Shareholder Value •
Repurchased 6.9 million shares of common stock totaling $153 million through
12/31/11 •
Quarterly dividend increased by 275%; dividend payout target at 25%
•
Share repurchases may slow in 2012 due to organic growth and improved market
conditions |
 25
Guidance and Trends
($ in millions)
2010*
2011*
2012 Target*
Trend
beyond 2012
Annual GPW Growth
38.2%
21.0%
5% -
10%
Organic growth of 5% to 10% excluding growth from acquisitions
Loss Ratio
58.8%
62.3%
62%
-
63%
Loss ratio has stabilized close to 62% to 63% range
Expense Ratio
35.1%
33.2%
33.5%
-
34.5%
Expected decrease due to improved scale, automation and
lower acquisition cost
Combined Ratio
93.9%
95.5%
95.5%
-
97.5%
Future improvement will be driven primarily by expense ratio
savings from improved scale.
Investment Yield
4.7%
4.8%
4.7%
-
5.0%
Continued growth in invested assets with yield stabilization due
to alternative and strategic investments
Operating ROE & 2012
Guidance
10.4%
9.8%
9%
-
10%
$2.60
-
$2.70
Expect to see ROE’s below 10% in first half of 2012, with
improvements to 10%-12% range occurring in second half of
year and continuing beyond year end 2012.
*Excludes reciprocals and impact of Severe Weather Related Losses;
|
 IV. Summary
26 |
 27
Key Investment Considerations
Superior Track Record of Operating Performance
•
Consistently outperformed industry in terms of growth and profitability
•
Created significant value for shareholders since IPO in 2004
Diversified Business Platform With a Niche Market Focus
•
Provides organic growth opportunities
•
Allows allocation of capital to profitable market segments
Responsible Growth in Premiums and Fee Income
•
Premium growth achieved through acquisitions and new organic growth
initiatives •
Increasing commission and fee income
Proactive Capital Management
•
Share repurchase plan in effect
•
275% increase in dividends per share since 2008
Positive pricing trends and Outlook
•
Positive pricing trends and favorable outlook for organic growth
•
Full
deployment
of
capital
to
achieve
10%
-
12%
ROE |
 28
Questions? |