Attached files
| file | filename |
|---|---|
| 8-K - NATIONAL PENN BANCSHARES, INC. FORM 8-K - NATIONAL PENN BANCSHARES INC | npb8k.htm |
Exhibit 99.1

National Penn Bancshares, Inc. (NPBC)
Strong, Clean, Efficient
KBW 2012 Boston Bank Conference
4Q / Year-Ended 12.31.11

1
Safe Harbor Regarding Forward Looking Statements
This presentation contains forward-looking information about National Penn Bancshares, Inc. that is intended to be covered by the safe harbor for forward-looking
statements provided by the Private Securities Litigation Reform Act of 1995. Forward-looking statements are statements that are not historical facts. These
statements can be identified by the use of forward-looking terminology such as “believe,” “expect,” “may,” “will,” “should,’’ “project,” ”could,” “plan,’’ “goal,” “potential,”
“pro forma,” “seek,” “intend,’’ or “anticipate’’ or the negative thereof or comparable terminology, and include discussions of strategy, financial projections, guidance
and estimates (including their underlying assumptions), statements regarding plans, objectives, expectations or consequences of announced transactions, and
statements about the future performance, operations, products and services of National Penn and its subsidiaries. National Penn cautions readers not to place undue
reliance on these statements.
National Penn’s business and operations are subject to a variety of risks, uncertainties and other factors. Consequently, actual results and experience may
materially differ from those contained in any forward-looking statements. Such risks, uncertainties and other factors that could cause actual results and experience to
differ from those projected include, but are not limited to, the following: increased capital requirements and other requirements or actions mandated by National
Penn’s regulators, National Penn’s ability to raise capital and maintain capital levels, variations in interest rates, deterioration in the credit quality of loans, the effect
of credit risk exposure, declines in the value of National Penn’s assets and the effect of any resulting impairment charges, recent and ongoing changes to the state
and federal regulatory schemes under which National Penn and other financial services companies operate (including the Dodd-Frank Act and regulations adopted
or to be adopted to implement that Act), competition from other financial institutions, interruptions or breaches of National Penn’s security systems, and the
development and maintenance of National Penn’s information technology. These risks and others are described in greater detail in National Penn’s Annual Report on
Form 10-K for the fiscal years ended December 31, 2010 and 2011, as well as in National Penn’s Quarterly Reports on Form 10-Q and other documents filed by
National Penn with the SEC after the date thereof. National Penn makes no commitment to revise or update any forward-looking statements in order to reflect events
or circumstances occurring or existing after the date any forward-looking statement is made.
This presentation contains supplemental financial information determined by methods other than in accordance with Accounting Principles Generally Accepted in the
United States of America (“GAAP”). National Penn’s management uses these non-GAAP measures in its analysis of National Penn’s performance. These measures
should not be considered a substitute for GAAP basis measures nor should they be viewed as a substitute for operating results determined in accordance with GAAP.
Management believes the presentation of the following non-GAAP financial measures, which exclude the impact of the specified items, provides useful supplemental
information that is essential to a proper understanding of the financial results of National Penn.
l Tangible common equity excludes goodwill and intangible assets and preferred equity. Banking and financial institution regulators also exclude goodwill
and intangible assets from shareholders’ equity when assessing the capital adequacy of a financial institution. Tangible common equity provides a method
to assess the company’s tangible capital trends.
and intangible assets from shareholders’ equity when assessing the capital adequacy of a financial institution. Tangible common equity provides a method
to assess the company’s tangible capital trends.
l Tangible book value expresses tangible common equity on a per-share basis. Tangible book value provides a method to assess the level of tangible net
assets on a per-share basis.
assets on a per-share basis.
l Adjusted net income and return on assets exclude the effects of certain gains and losses, adjusted for taxes when applicable. Adjusted net income and
returns provide methods to assess earnings performance by excluding items that management believes are not comparable among the periods
presented.
returns provide methods to assess earnings performance by excluding items that management believes are not comparable among the periods
presented.
l Efficiency ratio expresses operating expenses as a percentage of fully-taxable equivalent net interest income plus non-interest income. Operating
expenses exclude items from non-interest expense that management believes are not comparable among the periods presented. Non-interest income is
adjusted to also exclude items that management believes are not comparable among the periods presented. Efficiency ratio is used as a method for
management to assess its operating expense level and to compare to financial institutions of varying sizes.
Management believes the use of non-GAAP measures will help readers compare National Penn’s current results to those of prior periods as presented in the
accompanying Financial Highlights and financial data tables.
accompanying Financial Highlights and financial data tables.
Non-GAAP Financial Measures

National Penn Snapshot
l Founded 1874, headquartered in eastern PA
l NASDAQ ticker: NPBC
l Total assets: $8.5 billion
l Branch offices: 122
l FTE employees: ~1,700
l Market cap*: $1.3 billion
l Average daily trading volume (52 week)*:
~820,000 shares
~820,000 shares
l One month average share price*: $8.89
l TBV multiple*: 148%
Website: www.nationalpennbancshares.com
*Source: SNL as of 2.21.12
2

3

“For National Penn, 2011 was a year of solid
financial performance and accomplishments
despite a still recovering economy.
We executed our strategic initiatives, and as
a result we remain strong, clean, and efficient
and positioned for growth in 2012!”
- Scott V. Fainor, President and CEO
financial performance and accomplishments
despite a still recovering economy.
We executed our strategic initiatives, and as
a result we remain strong, clean, and efficient
and positioned for growth in 2012!”
- Scott V. Fainor, President and CEO
4

5
2011 Strategic Accomplishments
üRestored core earnings power
üRestored strong asset quality
üEnhanced strong capital levels
üEnhanced strong risk management culture
üIncreased common stock cash dividend three
consecutive quarters

6
Concentrated Presence in
Demographically Attractive Markets
Demographically Attractive Markets
5.99%
0.37%
5.08%
13.20%
0.55%
1.84%
8.88%
6.81%
8.90%
22.05%
1.82%
1.36%
1.20%
5.44%
16.52%
|
NPBC Market Median HH
Income* ($000) |
$63.5
|
|
Pennsylvania Median HH
Income* ($000) |
$52.7
|
|
Nationwide Median HH
Income* ($000) |
$54.4
|
|
NPBC Market Projected
Income Growth* |
14.2%
|
|
Pennsylvania Projected
Income Growth* |
13.3%
|
|
Nationwide Projected
Income Growth* |
12.4%
|
Sources: SNL / FDIC. Percent of franchise data as of June 30, 2011.
*Demographic data is the most recent published as of June 30, 2010.
*Demographic data is the most recent published as of June 30, 2010.
Source: SNL Financial / FDIC - pro-forma data as of June 30, 2011.
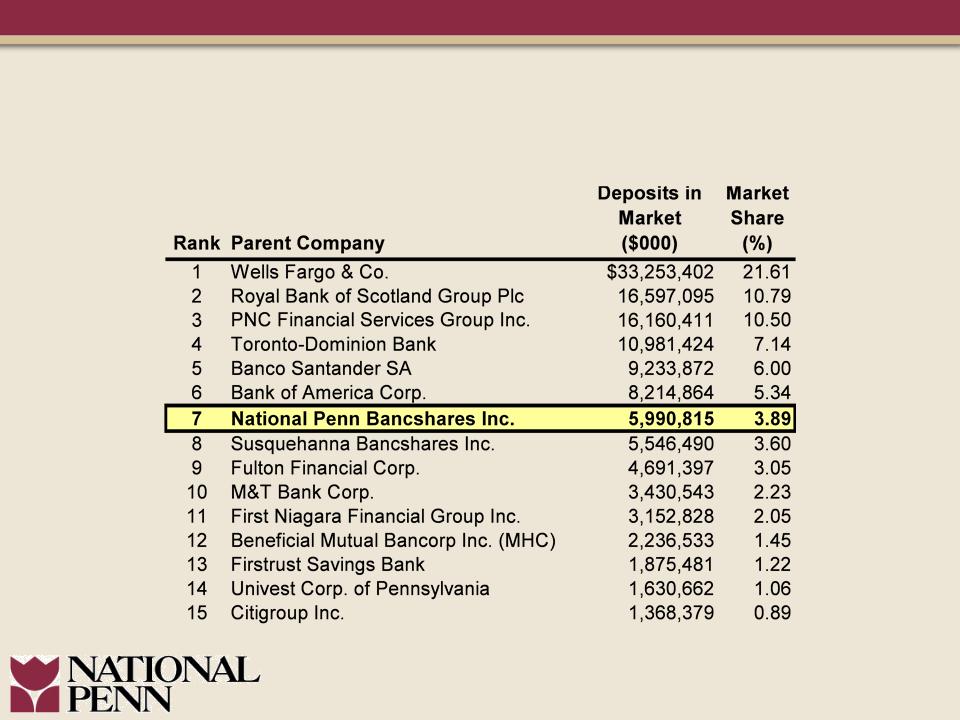
Market Disruption Opportunity
Deposit Market Share Analysis—Total NPBC PA Market Area
(by County)
(by County)
7

8
Regionally Positioned for Growth
Network of 122 Branch Offices
L. Cyr
lCommercial: 23
lRetail: 30
T. Jordan
lCommercial: 13
lRetail: 3
S. Gamble
lCommercial: 26
lRetail: 32
B. Rush
lCommercial: 11
lRetail: 11
P. Gray
lCommercial: 24
lRetail: 52
D. Richards
lCommercial: 6
lRetail: 7
Regional management hired or promoted within the last 15 months.
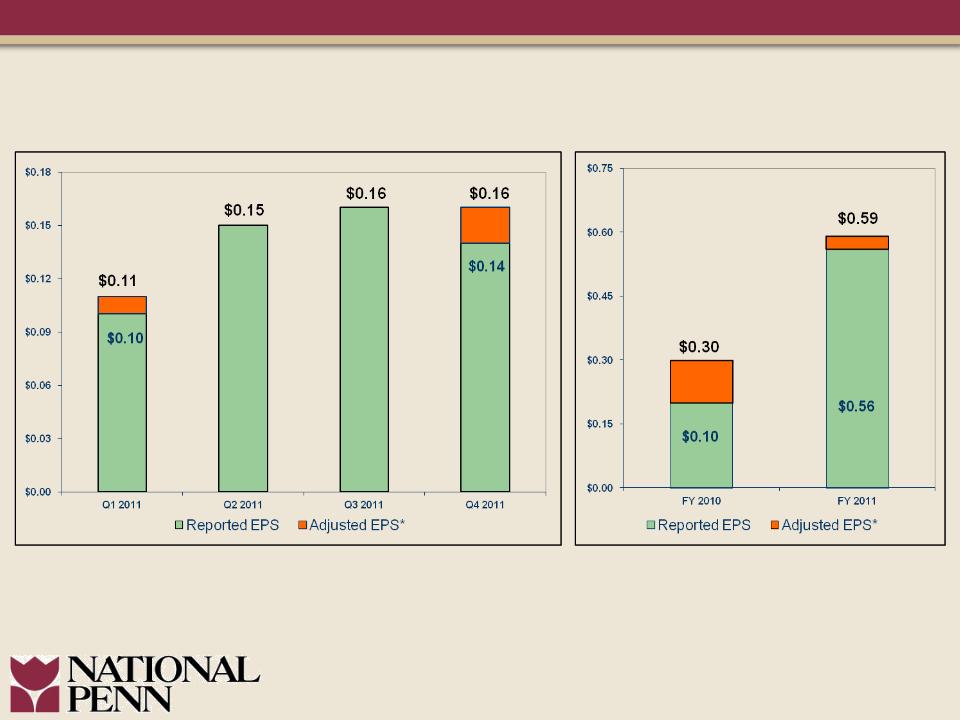
Positive Adjusted Earnings Per Share* Trend
*Refer to Appendix for reconciliation of Non-GAAP measure.
9
Quarterly Trend
Full Year
10
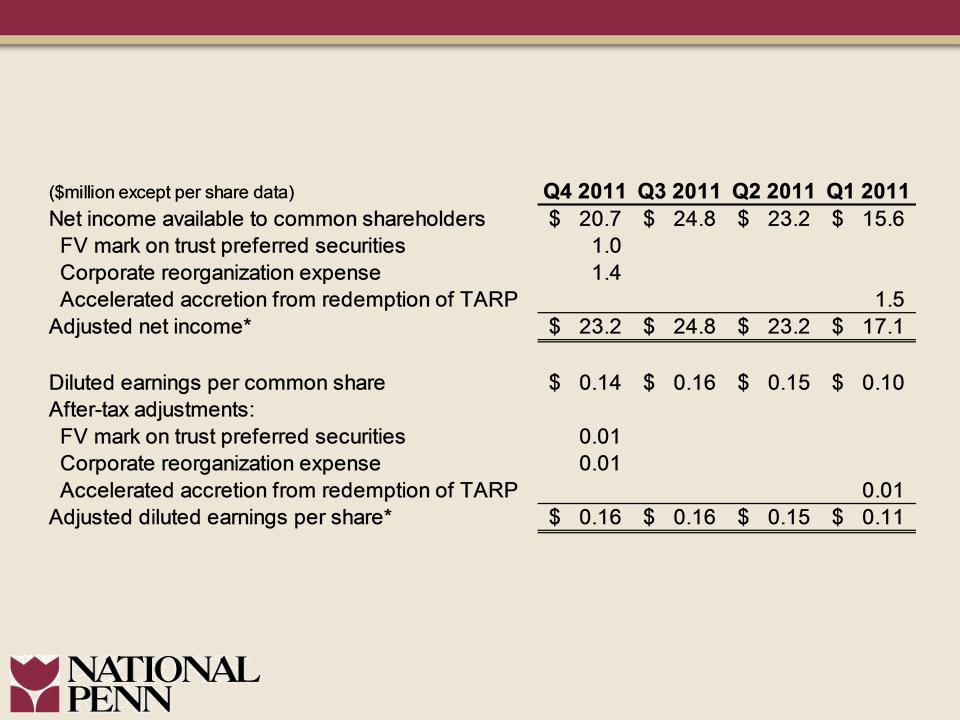
Consistent Quarterly Earnings
*A non-GAAP measure.

11
Improved Full Year Earnings
*A non-GAAP measure.
**Includes adjustments related to BOLI and Christiana Bank & Trust Company divestiture.

12
Improved Return on Assets
Adjusted ROA*
Reported ROA
*Refer to Appendix for reconciliation of Non-GAAP measure.

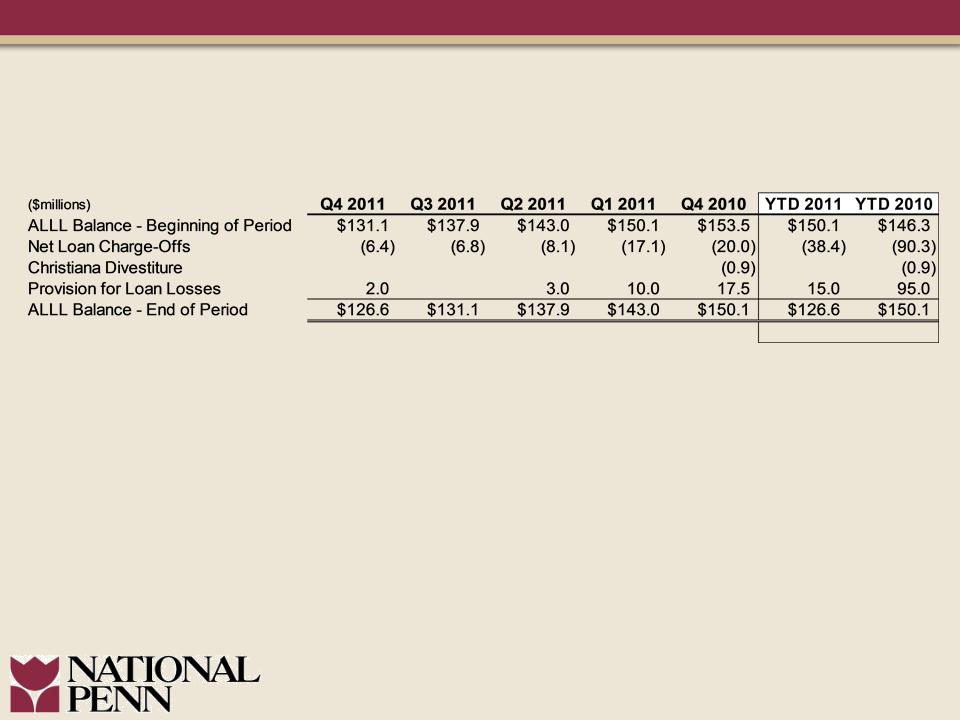
Loan Trends
13
($million)
Excludes loans held for sale.
14
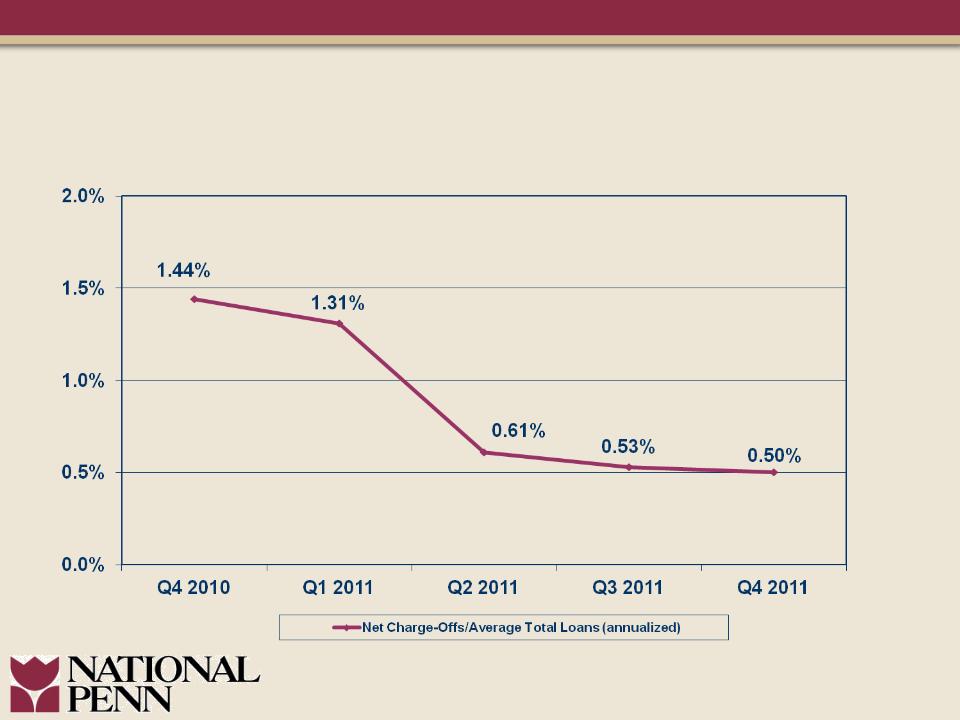
Sustained Asset Quality Improvement
Net Charge-Offs/Average Loans
Net Charge-Offs/Average Loans
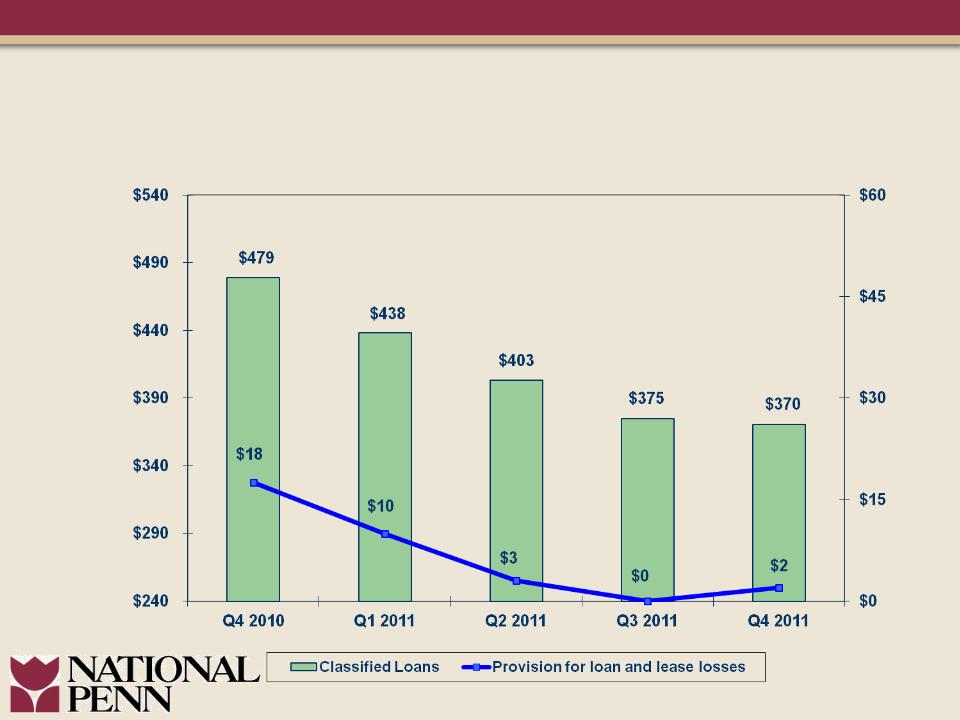
Sustained Asset Quality Improvement
Classified Loans & Provision Trends
Classified Loans & Provision Trends
15
($million)
($million)
16
Asset Quality Overview

-----MRQ Peer Average = 2.46%
NPL’s include non-accrual loans plus renegotiated loans.
Peer data per SNL Financial and company earnings reports as of most recent quarter (MRQ)
available (striped columns represent data as of 9/30/11; all other columns are as of
12/31/11).
available (striped columns represent data as of 9/30/11; all other columns are as of
12/31/11).
Refer to the Appendix within this presentation for 2009 proxy peer listing.
17
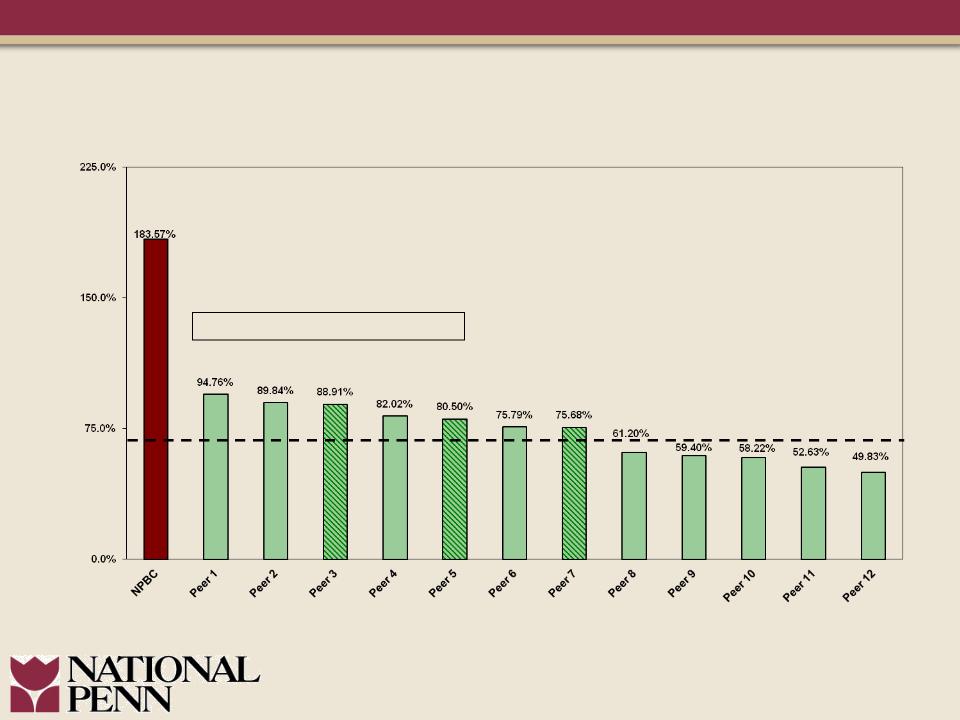
Strong Reserve Coverage
ALLL as a % of Non-Performing Loans
ALLL as a % of Non-Performing Loans
-----MRQ Peer Average = 72.40%
NPL’s include non-accrual loans plus renegotiated loans.
Peer data per SNL Financial and company earnings reports as of most recent quarter
(MRQ) available (striped columns represent data as of 9/30/11; all other columns are as of
12/31/11).
(MRQ) available (striped columns represent data as of 9/30/11; all other columns are as of
12/31/11).
Refer to the Appendix within this presentation for 2009 proxy peer listing.
18

19
-----MRQ Peer Average = 8.2%
Peer data per SNL Financial as of most recent quarter (MRQ) available (striped columns
represent data as of 9/30/11; all other columns are as of 12/31/11).
represent data as of 9/30/11; all other columns are as of 12/31/11).
Refer to the Appendix within this presentation for 2009 proxy peer listing.
20
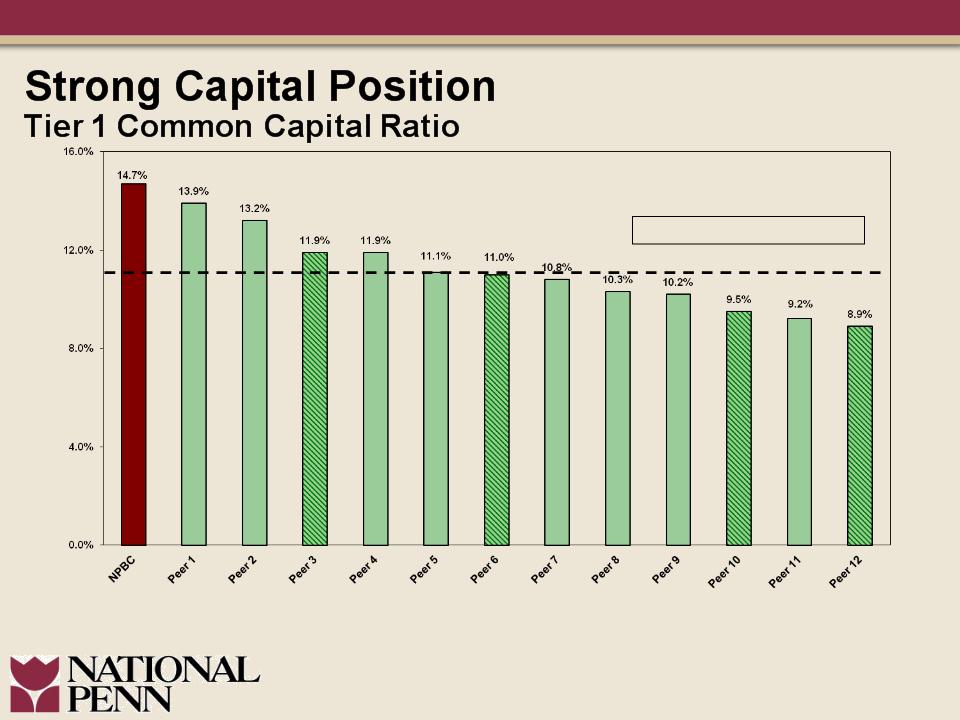
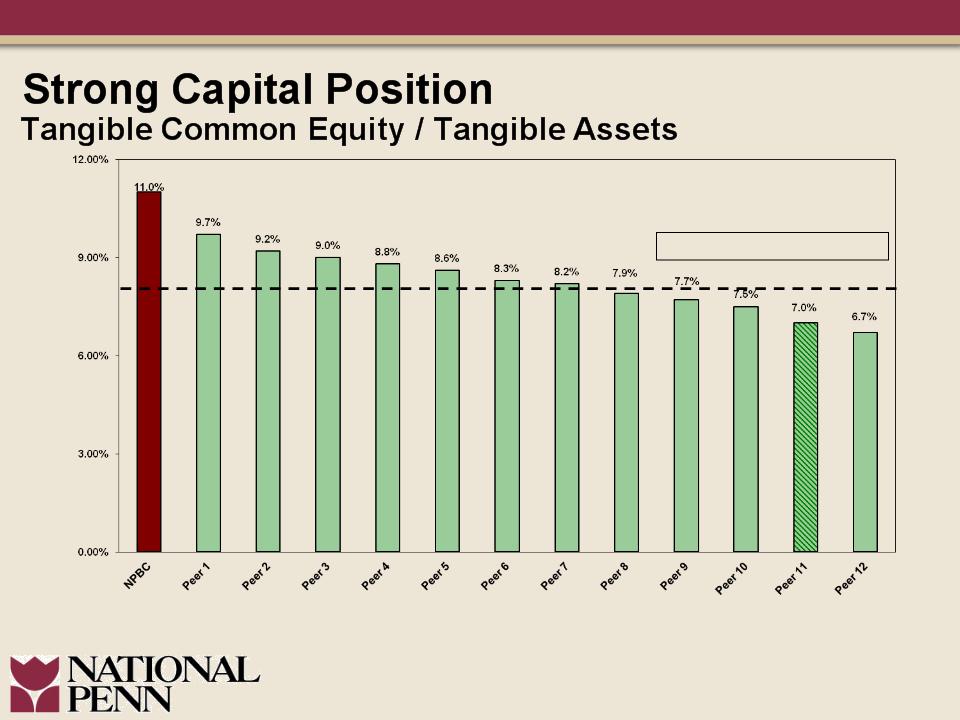
-----MRQ Peer Average = 11.0%
Peer data per SNL Financial as of most recent quarter (MRQ) available (striped columns
represent data as of 9/30/11; all other columns are as of 12/31/11).
represent data as of 9/30/11; all other columns are as of 12/31/11).
Refer to the Appendix within this presentation for 2009 proxy peer listing.
21
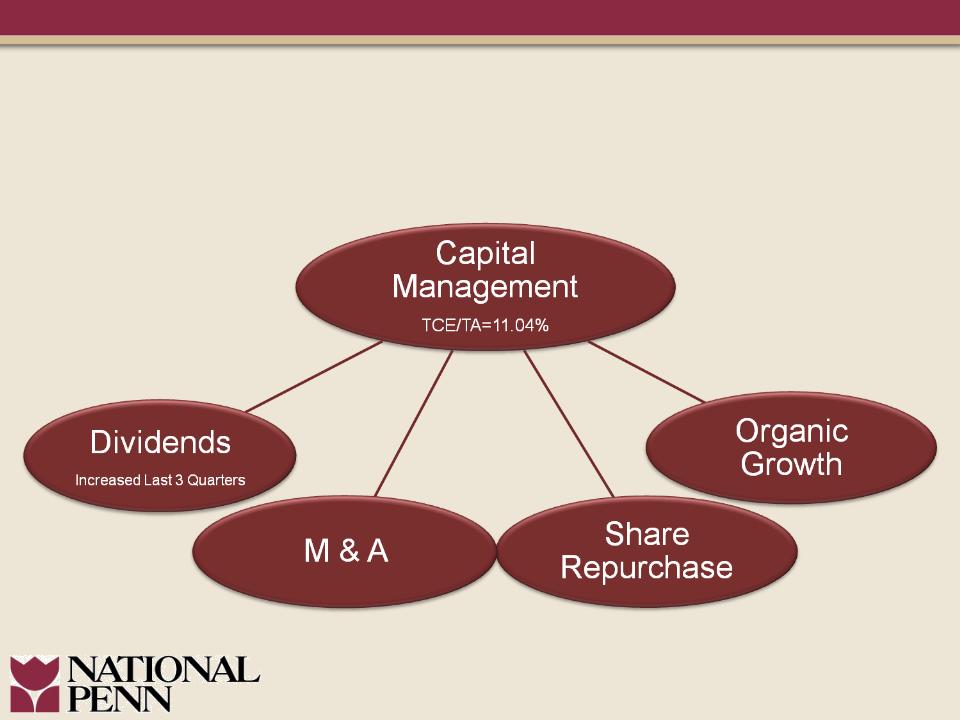
Enhance Shareholder Value Through
Capital Management Opportunities
Capital Management Opportunities
22

23
Strategic Acquisition Considerations
• Relevant size
• Relative risk
• Operating leverage
• Franchise value
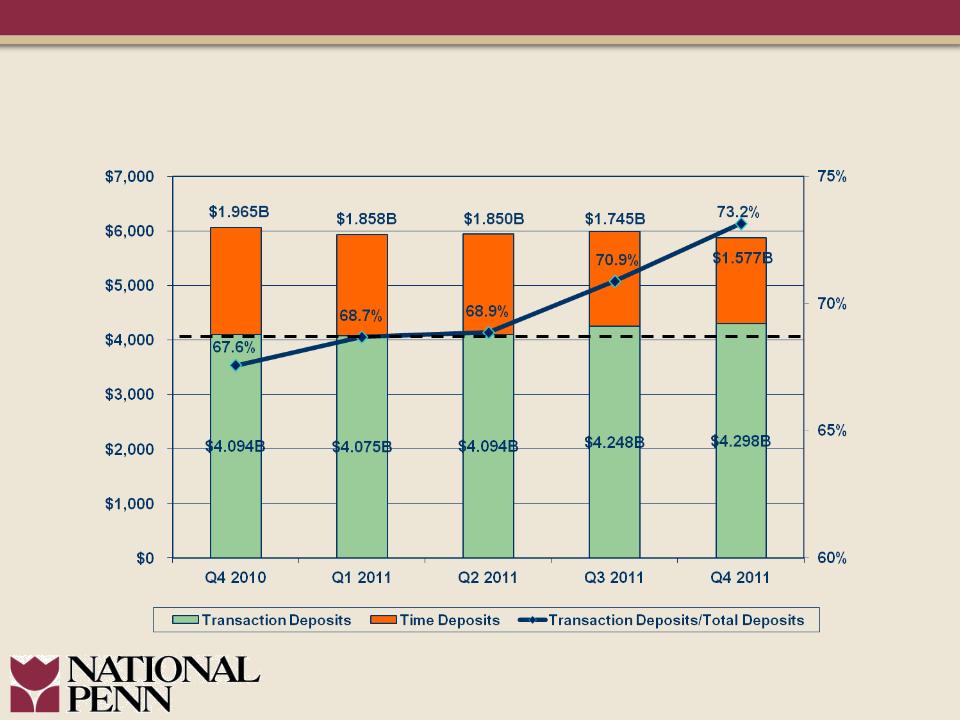
Deposit Trends
24
($million)
25
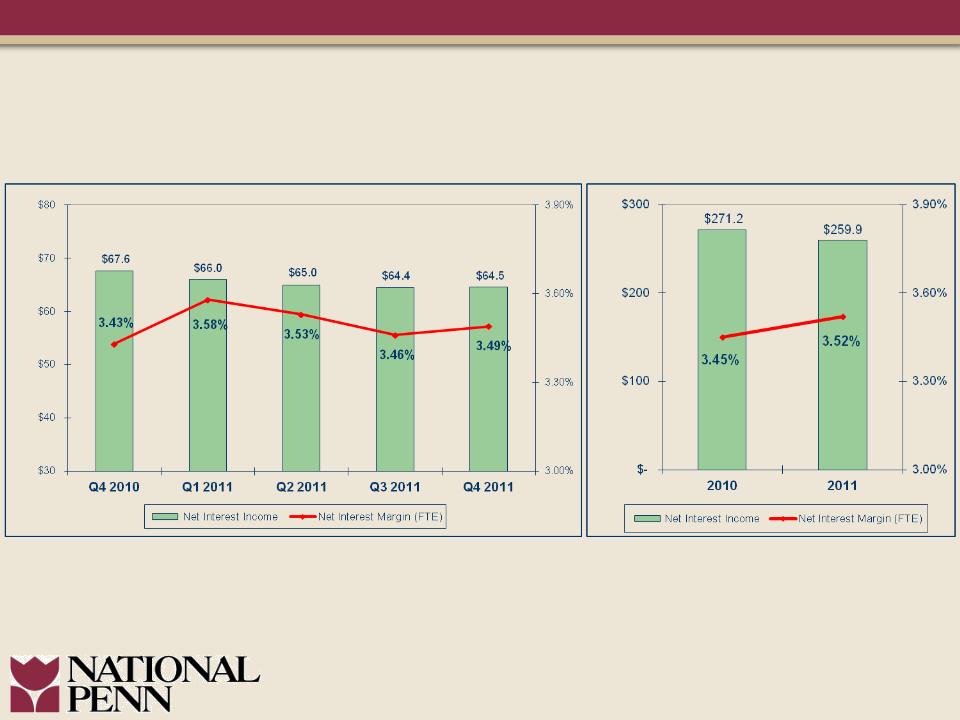
Net Interest Margin
($million)
($million)

26
Net Interest Margin Drivers
•Economic conditions
§Loan growth
•Extended low interest rate environment
§Deposit re-pricing
§Prepayment speeds
§Redeployment rates

27
2011 Core Non-Interest Income* Mix
*Refer to “Non-Interest Income” slide for reconciliation of Non-GAAP measure.
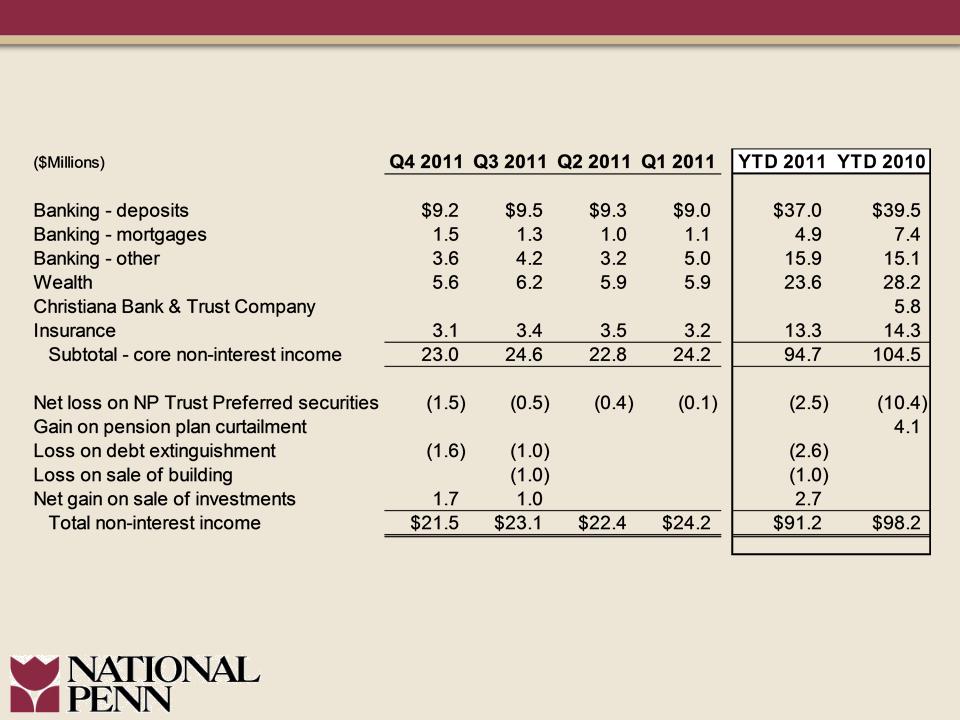
28
Non-Interest Income

29
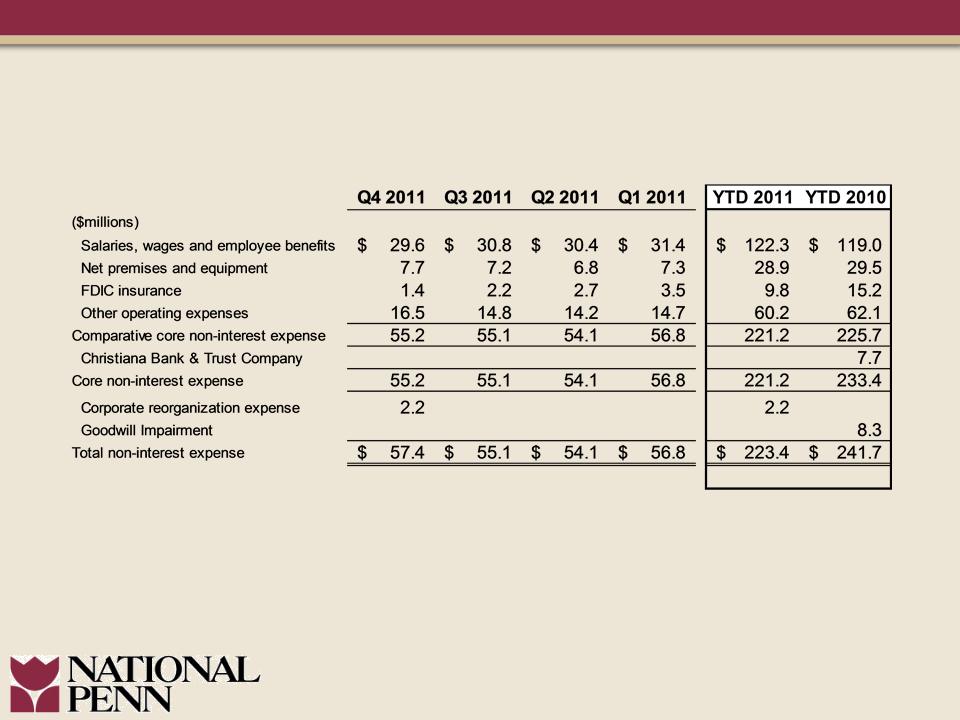
Expense Management Maintained
($million)
*Refer to Appendix for reconciliation of Non-GAAP measure.

30
Delivering on Strategic Objectives
üCompleted Warburg Pincus Investment
§ $150 million investment completed January 7, 2011
§ At market price with no equity enhancements
üRepaid TARP in-full
üRedeemed TARP warrants
üEnhanced strength of the balance sheet
§ De-risked balance sheet
§ Enhanced capital
üAdjusted EPS nearly doubles 2010-2011
üIncreased common stock cash dividend three consecutive quarters

31
• Generate quality loan growth - win market share
• Manage net interest margin during low interest rate
environment
environment
• Continue to focus on efficiencies
• Maintain strong asset quality
• Prudently manage capital
Enhancing Shareholder Value

Investment Considerations
ü Transparency
ü Level of accountability
ü Patient and disciplined approach
ü “Option rich” position for the future
32

33
APPENDIX
34
Non-Interest Expense
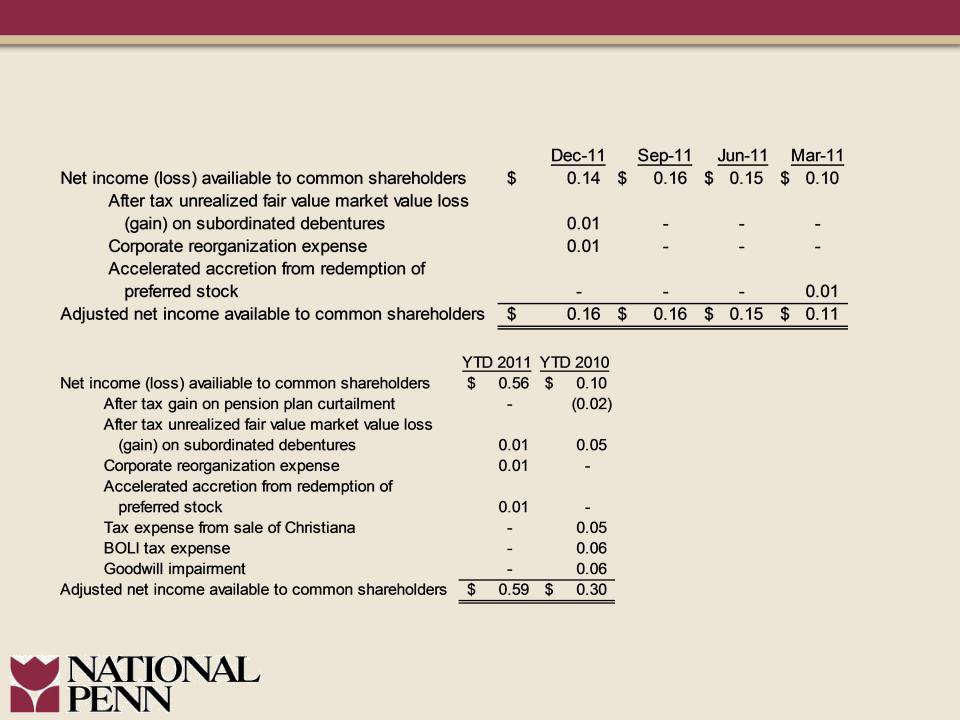
Reconciliation of Non-GAAP Measures
35

Reconciliation of Non-GAAP Measures
36

NPBC Peer Data - 2009 Proxy Statement*
|
Peer |
Ticker |
Assets as of
12/31/11 (billions) |
|
BancorpSouth, Inc.
|
BXS
|
$13.0
|
|
F.N.B Corporation
|
FNB
|
9.8
|
|
First Midwest Bancorp, Inc.
|
FMBI
|
8.0
|
|
First Niagara Financial Group, Inc.
|
FNFG
|
32.8
|
|
FirstMerit Corporation
|
FMER
|
14.4
|
|
Fulton Financial Corporation
|
FULT
|
16.4
|
|
MB Financial, Inc.
|
MBFI
|
9.8
|
|
Old National Bancorp
|
ONB
|
8.6
|
|
Susquehanna Bancshares, Inc.
|
SUSQ
|
15.0
|
|
Trustmark Corporation
|
TRMK
|
9.7
|
|
Valley National Bancorp
|
VLY
|
14.2
|
|
Wintrust Financial Corporation
|
WTFC
|
15.9
|
*Note: Wilmington Trust (WL) excluded from peer data beginning with data for 1Q 2011
due to acquisition by M&T. Whitney Holding Company (WTNY) excluded from peer
data beginning with 2Q2011 due to acquisition by Hancock Holding Co. (HBHC).
due to acquisition by M&T. Whitney Holding Company (WTNY) excluded from peer
data beginning with 2Q2011 due to acquisition by Hancock Holding Co. (HBHC).
37

38