Attached files
| file | filename |
|---|---|
| 8-K - FORM 8-K - WESTAR ENERGY INC /KS | d305853d8k.htm |
| EX-99.1 - PRESS RELEASE DATED FEBRUARY 23, 2012 - WESTAR ENERGY INC /KS | d305853dex991.htm |
| EX-99.3 - 2012 EARNINGS GUIDANCE - WESTAR ENERGY INC /KS | d305853dex993.htm |
Exhibit 99.2
Westar Energy, Inc
Fourth Quarter and Year-end 2011 Earnings
Released February 23, 2012
| Contents | ||||
| Page | ||||
| Consolidated statements of income |
1 | |||
| Consolidated balance sheets |
3 | |||
| Consolidated statements of cash flows |
4 | |||
| Earnings variances |
5 | |||
| Supplemental data |
7 | |||
| Capitalization & Long-term Debt Table |
9 | |||
| GAAP to Non-GAAP reconciliation |
10 | |||
| Supplemental slides |
11 | |||
Bruce Burns
Director Investor Relations
785-575-8227
bruce.burns@WestarEnergy.com
NOTE:
The Notes to the Condensed Consolidated Financial Statements in the company's Annual Report on Form 10-K for the period ended December 31, 2011 should be read in conjunction with this financial information. The enclosed statements have been prepared for the purpose of providing information concerning the Company and not in connection with any sale, offer for sale, or solicitation to buy any securities.
Westar Energy, Inc.
Consolidated Statements of Income
(Unaudited)
| Three Months Ended December 31, | ||||||||||||||||
| 2011 | 2010 | Change | % Change | |||||||||||||
| (In Thousands, Except Per Share Amounts) | ||||||||||||||||
| REVENUES: |
||||||||||||||||
| Residential |
$ | 136,604 | $ | 130,957 | $ | 5,647 | 4.3 | |||||||||
| Commercial |
134,175 | 128,170 | 6,005 | 4.7 | ||||||||||||
| Industrial |
79,379 | 75,637 | 3,742 | 4.9 | ||||||||||||
| Other retail |
(205 | ) | (2,240 | ) | 2,035 | 90.8 | ||||||||||
|
|
|
|
|
|
|
|||||||||||
| Total Retail Revenues |
349,953 | 332,524 | 17,429 | 5.2 | ||||||||||||
| Wholesale |
89,752 | 78,804 | 10,948 | 13.9 | ||||||||||||
| Transmission |
39,158 | 36,016 | 3,142 | 8.7 | ||||||||||||
| Other |
7,365 | 9,379 | (2,014 | ) | (21.5 | ) | ||||||||||
|
|
|
|
|
|
|
|||||||||||
| Total Revenues |
486,228 | 456,723 | 29,505 | 6.5 | ||||||||||||
|
|
|
|
|
|
|
|||||||||||
| OPERATING EXPENSES: |
||||||||||||||||
| Fuel and purchased power |
144,096 | 124,568 | 19,528 | 15.7 | ||||||||||||
| Operating and maintenance |
145,323 | 150,825 | (5,502 | ) | (3.6 | ) | ||||||||||
| Depreciation and amortization |
71,771 | 69,982 | 1,789 | 2.6 | ||||||||||||
| Selling, general and administrative |
52,463 | 63,108 | (10,645 | ) | (16.9 | ) | ||||||||||
|
|
|
|
|
|
|
|||||||||||
| Total Operating Expenses |
413,653 | 408,483 | 5,170 | 1.3 | ||||||||||||
|
|
|
|
|
|
|
|||||||||||
| INCOME FROM OPERATIONS |
72,575 | 48,240 | 24,335 | 50.4 | ||||||||||||
|
|
|
|
|
|
|
|||||||||||
| OTHER INCOME (EXPENSE): |
||||||||||||||||
| Investment income |
3,046 | 2,676 | 370 | 13.8 | ||||||||||||
| Other income |
441 | 1,577 | (1,136 | ) | (72.0 | ) | ||||||||||
| Other expense |
(4,445 | ) | (4,611 | ) | 166 | 3.6 | ||||||||||
|
|
|
|
|
|
|
|||||||||||
| Total Other Expense |
(958 | ) | (358 | ) | (600 | ) | (167.6 | ) | ||||||||
|
|
|
|
|
|
|
|||||||||||
| Interest expense |
41,779 | 43,080 | (1,301 | ) | (3.0 | ) | ||||||||||
|
|
|
|
|
|
|
|||||||||||
| INCOME BEFORE INCOME TAXES |
29,838 | 4,802 | 25,036 | 521.4 | ||||||||||||
| Income tax expense (benefit) |
8,532 | (1,748 | ) | 10,280 | 588.1 | |||||||||||
|
|
|
|
|
|
|
|||||||||||
| NET INCOME |
21,306 | 6,550 | 14,756 | 225.3 | ||||||||||||
| Less: Net income attributable to noncontrolling interests |
1,729 | 1,389 | 340 | 24.5 | ||||||||||||
|
|
|
|
|
|
|
|||||||||||
| NET INCOME ATTRIBUTABLE TO WESTAR ENERGY |
19,577 | 5,161 | 14,416 | 279.3 | ||||||||||||
| Preferred dividends |
242 | 242 | — | — | ||||||||||||
|
|
|
|
|
|
|
|||||||||||
| NET INCOME ATTRIBUTABLE TO COMMON STOCK |
$ | 19,335 | $ | 4,919 | $ | 14,416 | 293.1 | |||||||||
|
|
|
|
|
|
|
|||||||||||
| Earnings per common share, basic |
$ | 0.16 | $ | 0.04 | $ | 0.12 | 300.0 | |||||||||
|
|
|
|
|
|
|
|||||||||||
| Average equivalent common shares outstanding (in thousands) |
121,880 | 112,348 | 9,532 | 8.5 | ||||||||||||
| DIVIDENDS DECLARED PER COMMON SHARE |
$ | 0.32 | $ | 0.31 | $ | 0.01 | 3.2 | |||||||||
| Effective income tax rate |
28.59 | % | -36.40 | % | ||||||||||||
The Notes to the Condensed Consolidated Financial Statements in the company’s Annual Report on Form 10-K
for the period ended December 31, 2011 should be read in conjunction with this financial information.
Westar Energy, Inc.
Consolidated Statements of Income
(Unaudited)
| Twelve Months Ended December 31, | ||||||||||||||||
| 2011 | 2010 | Change | %Change | |||||||||||||
| (In Thousands, Except Per Share Amounts) | ||||||||||||||||
| REVENUES: |
||||||||||||||||
| Residential |
$ | 693,388 | $ | 661,177 | $ | 32,211 | 4.9 | |||||||||
| Commercial |
604,626 | 572,062 | 32,564 | 5.7 | ||||||||||||
| Industrial |
347,881 | 318,249 | 29,632 | 9.3 | ||||||||||||
| Other retail |
(8,964 | ) | (12,703 | ) | 3,739 | 29.4 | ||||||||||
|
|
|
|
|
|
|
|||||||||||
| Total Retail Revenues |
1,636,931 | 1,538,785 | 98,146 | 6.4 | ||||||||||||
| Wholesale |
346,948 | 334,669 | 12,279 | 3.7 | ||||||||||||
| Transmission |
154,569 | 144,513 | 10,056 | 7.0 | ||||||||||||
| Other |
32,543 | 38,204 | (5,661 | ) | (14.8 | ) | ||||||||||
|
|
|
|
|
|
|
|||||||||||
| Total Revenues |
2,170,991 | 2,056,171 | 114,820 | 5.6 | ||||||||||||
|
|
|
|
|
|
|
|||||||||||
| OPERATING EXPENSES: |
||||||||||||||||
| Fuel and purchased power |
630,793 | 583,361 | 47,432 | 8.1 | ||||||||||||
| Operating and maintenance |
557,752 | 520,409 | 37,343 | 7.2 | ||||||||||||
| Depreciation and amortization |
285,322 | 271,937 | 13,385 | 4.9 | ||||||||||||
| Selling, general and administrative |
184,695 | 207,607 | (22,912 | ) | (11.0 | ) | ||||||||||
|
|
|
|
|
|
|
|||||||||||
| Total Operating Expenses |
1,658,562 | 1,583,314 | 75,248 | 4.8 | ||||||||||||
|
|
|
|
|
|
|
|||||||||||
| INCOME FROM OPERATIONS |
512,429 | 472,857 | 39,572 | 8.4 | ||||||||||||
|
|
|
|
|
|
|
|||||||||||
| OTHER INCOME (EXPENSE): |
||||||||||||||||
| Investment income |
9,301 | 7,026 | 2,275 | 32.4 | ||||||||||||
| Other income |
8,652 | 5,369 | 3,283 | 61.1 | ||||||||||||
| Other expense |
(18,398 | ) | (16,655 | ) | (1,743 | ) | (10.5 | ) | ||||||||
|
|
|
|
|
|
|
|||||||||||
| Total Other Expense |
(445 | ) | (4,260 | ) | 3,815 | 89.6 | ||||||||||
|
|
|
|
|
|
|
|||||||||||
| Interest expense |
172,460 | 174,941 | (2,481 | ) | (1.4 | ) | ||||||||||
|
|
|
|
|
|
|
|||||||||||
| INCOME BEFORE INCOME TAXES |
339,524 | 293,656 | 45,868 | 15.6 | ||||||||||||
| Income tax expense |
103,344 | 85,032 | 18,312 | 21.5 | ||||||||||||
|
|
|
|
|
|
|
|||||||||||
| NET INCOME |
236,180 | 208,624 | 27,556 | 13.2 | ||||||||||||
| Less: Net income attributable to nonontrolling interests |
5,941 | 4,728 | 1,213 | 25.7 | ||||||||||||
|
|
|
|
|
|
|
|||||||||||
| NET INCOME ATTRIBUTABLE TO WESTAR ENERGY |
230,239 | 203,896 | 26,343 | 12.9 | ||||||||||||
| Preferred dividends |
970 | 970 | — | — | ||||||||||||
|
|
|
|
|
|
|
|||||||||||
| NET INCOME ATTRIBUTABLE TO COMMON STOCK |
$ | 229,269 | $ | 202,926 | $ | 26,343 | 13.0 | |||||||||
|
|
|
|
|
|
|
|||||||||||
| Earnings per common share, basic |
$ | 1.95 | $ | 1.81 | $ | 0.14 | 7.7 | |||||||||
|
|
|
|
|
|
|
|||||||||||
| Average equivalent common shares outstanding (in thousands) |
116,891 | 111,629 | 5,262 | 4.7 | ||||||||||||
| DIVIDENDS DECLARED PER COMMON SHARE |
$ | 1.28 | $ | 1.24 | $ | 0.04 | 3.2 | |||||||||
| Effective income tax rate |
30.44 | % | 28.96 | % | ||||||||||||
The Notes to the Condensed Consolidated Financial Statements in the company’s Annual Report on Form 10-K
for the period ended December 31, 2011 should be read in conjunction with this financial information.
Westar Energy, Inc.
Consolidated Balance Sheets
(Dollars in Thousands, except par values)
(Unaudited)
| December 31, 2011 |
December 31, 2010 |
|||||||
| ASSETS | ||||||||
| CURRENT ASSETS: |
||||||||
| Cash and cash equivalents |
$ | 3,539 | $ | 928 | ||||
| Accounts receivable, net |
226,428 | 227,700 | ||||||
| Fuel inventory and supplies |
229,118 | 206,867 | ||||||
| Energy marketing contracts |
8,180 | 13,005 | ||||||
| Taxes receivable |
5,334 | 16,679 | ||||||
| Deferred tax assets |
394 | 30,248 | ||||||
| Prepaid expenses |
13,078 | 12,413 | ||||||
| Regulatory assets |
123,818 | 73,480 | ||||||
| Other |
23,696 | 20,289 | ||||||
|
|
|
|
|
|||||
| Total Current Assets |
633,585 | 601,609 | ||||||
|
|
|
|
|
|||||
| PROPERTY, PLANT AND EQUIPMENT, NET |
6,411,922 | 5,964,439 | ||||||
|
|
|
|
|
|||||
| PROPERTY, PLANT AND EQUIPMENT OF VARIABLE INTEREST ENTITIES, NET |
333,494 | 345,037 | ||||||
|
|
|
|
|
|||||
| OTHER ASSETS: |
||||||||
| Regulatory assets |
922,272 | 787,585 | ||||||
| Nuclear decommissioning trust |
130,270 | 126,990 | ||||||
| Other |
251,308 | 253,978 | ||||||
|
|
|
|
|
|||||
| Total Other Assets |
1,303,850 | 1,168,553 | ||||||
|
|
|
|
|
|||||
| TOTAL ASSETS |
$ | 8,682,851 | $ | 8,079,638 | ||||
| LIABILITIES AND EQUITY | ||||||||
| CURRENT LIABILITIES: |
||||||||
| Current maturities of long-term debt |
$ | — | $ | 61 | ||||
| Current maturities of long-term debt of variable interest entities |
28,114 | 30,155 | ||||||
| Short-term debt |
286,300 | 226,700 | ||||||
| Accounts payable |
187,428 | 187,954 | ||||||
| Accrued taxes |
52,451 | 45,534 | ||||||
| Energy marketing contracts |
6,353 | 9,670 | ||||||
| Accrued interest |
77,437 | 77,771 | ||||||
| Regulatory liabilities |
40,857 | 33,779 | ||||||
| Other |
148,347 | 171,222 | ||||||
|
|
|
|
|
|||||
| Total Current Liabilities |
827,287 | 782,846 | ||||||
|
|
|
|
|
|||||
| LONG-TERM LIABILITIES: |
||||||||
| Long-term debt, net |
2,491,109 | 2,490,871 | ||||||
| Long-term debt of variable interest entities, net |
249,283 | 278,162 | ||||||
| Deferred income taxes |
1,110,463 | 1,102,625 | ||||||
| Unamortized investment tax credits |
164,175 | 101,345 | ||||||
| Regulatory liabilities |
230,530 | 233,295 | ||||||
| Accrued employee benefits |
592,617 | 483,769 | ||||||
| Asset retirement obligations |
142,508 | 125,999 | ||||||
| Other |
74,138 | 66,888 | ||||||
|
|
|
|
|
|||||
| Total Long-Term Liabilities |
5,054,823 | 4,882,954 | ||||||
|
|
|
|
|
|||||
| COMMITMENTS AND CONTINGENCIES (See Notes 13 & 15 in Form 10-K) TEMPORARY EQUITY |
— | 3,465 | ||||||
|
|
|
|
|
|||||
| EQUITY: |
||||||||
| Westar Energy Shareholders' Equity: |
||||||||
| Cumulative preferred stock, par value $100 per share; authorized 600,000 shares; issued and outstanding 214,363 shares |
21,436 | 21,436 | ||||||
| Common stock, par value $5 per share; authorized 275,000,000 and 150,000,000 shares, respectively; issued and outstanding 125,698,396 and 112,128,068 shares, respectively |
628,492 | 560,640 | ||||||
| Paid-in capital |
1,639,503 | 1,398,580 | ||||||
| Retained earnings |
501,216 | 423,647 | ||||||
|
|
|
|
|
|||||
| Total Westar Energy Shareholders' Equity |
2,790,647 | 2,404,303 | ||||||
|
|
|
|
|
|||||
| Noncontrolling Interests |
10,094 | 6,070 | ||||||
|
|
|
|
|
|||||
| Total Equity |
2,800,741 | 2,410,373 | ||||||
|
|
|
|
|
|||||
| TOTAL LIABILITIES AND EQUITY |
$ | 8,682,851 | $ | 8,079,638 | ||||
The Notes to the Condensed Consolidated Financial Statements in the company’s Annual Report on Form 10-K
for the period ended December 31, 2011 should be read in conjunction with this financial information.
Westar Energy, Inc.
Consolidated Statements of Cash Flows
(Dollars in Thousands)
(Unaudited)
| Twelve Months Ended December 31, |
||||||||
| 2011 | 2010 | |||||||
| CASH FLOWS FROM (USED IN) OPERATING ACTIVITIES: |
||||||||
| Net income |
$ | 236,180 | $ | 208,624 | ||||
| Adjustments to reconcile net income to net cash provided by operating activities: |
||||||||
| Depreciation and amortization |
285,322 | 271,937 | ||||||
| Amortization of nuclear fuel |
21,151 | 25,089 | ||||||
| Amortization of deferred regulatory gain from sale-leaseback |
(5,495 | ) | (5,495 | ) | ||||
| Amortization of corporate-owned life insurance |
25,650 | 20,650 | ||||||
| Non-cash compensation |
8,422 | 11,373 | ||||||
| Net changes in energy marketing assets and liabilities |
926 | (1,284 | ) | |||||
| Net deferred income taxes and credits |
111,723 | 120,169 | ||||||
| Stock based compensation excess tax benefits |
(1,180 | ) | (641 | ) | ||||
| Allowance for equity funds used during construction |
(5,550 | ) | (3,104 | ) | ||||
| Gain on sale of non-utility investment |
(7,246 | ) | — | |||||
| Gain on settlement of contractual obligations with former officers |
(22,039 | ) | — | |||||
| Changes in working capital items: |
||||||||
| Accounts receivable |
(1,638 | ) | (11,434 | ) | ||||
| Fuel inventory and supplies |
(21,485 | ) | (12,266 | ) | ||||
| Prepaid expenses and other |
(50,138 | ) | 8,475 | |||||
| Accounts payable |
3,008 | 30,330 | ||||||
| Accrued taxes |
18,633 | 27,565 | ||||||
| Other current liabilities |
(107,012 | ) | (80,660 | ) | ||||
| Changes in other assets |
(10,167 | ) | (42,544 | ) | ||||
| Changes in other liabilities |
(16,369 | ) | 40,918 | |||||
|
|
|
|
|
|||||
| Cash flows from operating activities |
462,696 | 607,702 | ||||||
|
|
|
|
|
|||||
| CASH FLOWS FROM (USED IN) INVESTING ACTIVITIES: |
||||||||
| Additions to property, plant and equipment |
(697,451 | ) | (540,076 | ) | ||||
| Purchase of securities within trusts |
(49,737 | ) | (192,350 | ) | ||||
| Sale of securities within trusts |
47,534 | 191,603 | ||||||
| Investment in corporate-owned life insurance |
(19,214 | ) | (19,162 | ) | ||||
| Proceeds from investment in corporate-owned life insurance |
1,295 | 2,204 | ||||||
| Proceeds from federal grant |
8,561 | 3,180 | ||||||
| Investment in affiliated company |
(1,943 | ) | (280 | ) | ||||
| Proceeds from sale of non-utility investment |
9,246 | — | ||||||
| Investment in non-utitlity investments |
(3,656 | ) | — | |||||
| Other investing activities |
3,849 | (1,164 | ) | |||||
|
|
|
|
|
|||||
| Cash flows used in investing activities |
(701,516 | ) | (556,045 | ) | ||||
|
|
|
|
|
|||||
| CASH FLOWS FROM (USED IN) FINANCING ACTIVITIES: |
||||||||
| Short-term debt, net |
54,081 | (16,060 | ) | |||||
| Retirements of long-term debt |
(371 | ) | (1,695 | ) | ||||
| Retirements of long-term debt of variable interest entities |
(30,159 | ) | (28,610 | ) | ||||
| Repayment of capital leases |
(2,233 | ) | (2,981 | ) | ||||
| Borrowings against cash surrender value of corporate-owned life insurance |
67,562 | 74,134 | ||||||
| Repayment of borrowings against cash surrender value of corporate-owned life insurance |
(3,421 | ) | (3,430 | ) | ||||
| Stock based compensation excess tax benefits |
1,180 | 641 | ||||||
| Issuance of common stock |
294,942 | 54,651 | ||||||
| Distributions to shareholders of noncontrolling interests |
(1,917 | ) | (2,093 | ) | ||||
| Cash dividends paid |
(138,233 | ) | (129,146 | ) | ||||
|
|
|
|
|
|||||
| Cash flows from (used in) financing activities |
241,431 | (54,589 | ) | |||||
|
|
|
|
|
|||||
| NET INCREASE (DECREASE) IN CASH AND CASH EQUIVALENTS |
2,611 | (2,932 | ) | |||||
| CASH AND CASH EQUIVALENTS: |
||||||||
| Beginning of period |
928 | 3,860 | ||||||
|
|
|
|
|
|||||
| End of period |
$ | 3,539 | $ | 928 | ||||
|
|
|
|
|
|||||
The Notes to the Condensed Consolidated Financial Statements in the company’s Annual Report on Form 10-K
for the period ended December 31, 2011 should be read in conjunction with this financial information.
Westar Energy, Inc.
4th Quarter 2011 vs. 2010
Earnings Variances
| Change | ||||||||||||
| ($ per share) | (Dollars in thousands) | |||||||||||
| 2010 earnings attributable to common stock |
$ | 0.04 | $ | 4,919 | ||||||||
| Favorable / (Unfavorable) | ||||||||||||
| Retail |
17,429 | A | ||||||||||
| Wholesale |
10,948 | B | ||||||||||
| Transmission |
3,142 | |||||||||||
| Other revenues |
(2,014 | ) | ||||||||||
| Fuel and purchased power |
(19,528 | ) | C | |||||||||
| SPP network transmission costs |
(3,838 | ) | ||||||||||
|
|
|
|||||||||||
| Gross Margin |
6,139 | |||||||||||
| Operating and maintenance w/o SPP NITS |
9,340 | D | ||||||||||
| Depreciation and amortization |
(1,789 | ) | E | |||||||||
| Selling, general and administrative |
10,645 | F | ||||||||||
| Other income (expense) |
(600 | ) | ||||||||||
| Interest expense |
1,301 | |||||||||||
| Income tax expense |
(10,280 | ) | ||||||||||
| Net income attributable to noncontrolling interests |
(340 | ) | ||||||||||
| Change in shares outstanding |
(0.01 | ) | ||||||||||
| 2011 earnings attributable to common stock |
$ | 0.16 | $ | 19,335 | ||||||||
Major factors influencing the period to period change in EPS – Favorable/(Unfavorable)
| A | Due principally to price increases; MWh increased 0.4 percent (see page 7 for changes by customer class) |
| B | Due to increase in demand; MWh increased 26 percent (see page 7 for changes by customer class) |
| C | Increased electricity generated at higher average unit cost for fuel and purchased power |
| D | Due principally to: reduced maintenance expense for distribution system, primarily tree trimming — $5.2M; reduced maintenance expense and outages at power plants — $5.2M |
| E | Higher plant balances associated with additions at power plants, including air quality controls equipment |
| F | Decrease due principally to: reduced variable compensation related to performance against operational and financial targets - $6.4M; reduced legal costs — $2.3M |
The Notes to the Condensed Consolidated Financial Statements in the company’s Annual Report on Form 10-K
for the period ended December 31, 2011 should be read in conjunction with this financial information.
Westar Energy, Inc.
YTD December 2011 vs. 2010
Earnings Variances
| Change | ||||||||||||
| ($ per share) | (Dollars in thousands) | |||||||||||
| 2010 earnings attributable to common stock |
$ | 1.81 | $ | 202,926 | ||||||||
| Favorable / (Unfavorable) | ||||||||||||
| Retail |
98,146 | A | ||||||||||
| Wholesale |
12,279 | B | ||||||||||
| Transmission |
10,056 | |||||||||||
| Other revenues |
(5,661 | ) | ||||||||||
| Fuel and purchased power |
(47,432 | ) | C | |||||||||
| SPP network transmission costs |
(15,715 | ) | ||||||||||
|
|
|
|||||||||||
| Gross Margin |
51,673 | |||||||||||
| Operating and maintenance w/o SPP NITS |
(21,628 | ) | D | |||||||||
| Depreciation and amortization |
(13,385 | ) | E | |||||||||
| Selling, general and administrative |
22,912 | F | ||||||||||
| Other income (expense) |
3,815 | G | ||||||||||
| Interest expense |
2,481 | |||||||||||
| Income tax expense |
(18,312 | ) | ||||||||||
| Net income attributable to noncontrolling interests |
(1,213 | ) | ||||||||||
| Change in shares outstanding |
(0.10 | ) | ||||||||||
| 2011 earnings attributable to common stock |
$ | 1.95 | $ | 229,269 | ||||||||
Major factors influencing the period to period change in EPS – Favorable/(Unfavorable)
| A | Due principally to price increases; MWh increased 1 percent (see page 8 for changes by customer class) |
| B | Due principally to higher average market prices; MWh decreased 6 percent reflecting less availability of generation for wholesale sales (see page 8 for changes by customer class) |
| C | Increase due principally to higher average unit cost of generation which more than offset a decrease in electricity generated |
| D | Increase due principally to: increase in property tax expense ( which is largely offset in revenues via property tax surcharge) — ($7M); increased amortization of Wolf Creek refuel and maintenance outage cost — ($8M); higher regulatory compliance costs at Wolf Creek — ($5M); recording in 2010 a reduction in liability for cost associated with sale of assets many years ago — ($5M); increased maintenance of distribution system, primarily tree trimming — ($1.4M); and a decrease in expenses for completed storm amortizations — $8M |
| E | Higher plant balances associated with additions of transmission facilities and at power plants, including air quality controls equipment |
| F | Decrease due principally to: reversal of accrued liabilities related to legal settlements — $22M; reduced variable compensation related to performance against operational and financial targets — $7.1M; increased amortization of deferred energy efficiency expenses (which is largely offset with retail revenue increase) — ($3.6M); and higher legal expenses related to the legal settlements — ($3.2M) |
| G | Increase is due primarily to: recording a gain on sale of non—utility investment — $7.2M; increase in equity AFUDC — $2.4M; recording a gain on sale of No. 6 fuel oil — $1.2M; and recording a smaller mark-to-market gain on investments in a trust to fund retirement benefits — ($4M) |
The Notes to the Condensed Consolidated Financial statements in the company’s Annual report on Form 10-K
for the period ended December 31, 2011 should be read in conjunction with this financial information.
Westar Energy, Inc
Revenue, Sales and Energy Supply
Supplemental Data
| Three Months Ended December 31, | ||||||||||||||||
| 2011 | 2010 | Change | % Change | |||||||||||||
| (Dollars In Thousands) | ||||||||||||||||
| Revenues |
||||||||||||||||
| Residential |
$ | 136,604 | $ | 130,957 | $ | 5,647 | 4.3 | |||||||||
| Commercial |
134,175 | 128,170 | 6,005 | 4.7 | ||||||||||||
| Industrial |
79,379 | 75,637 | 3,742 | 4.9 | ||||||||||||
| Other retail |
3,046 | 2,985 | 61 | 2.0 | ||||||||||||
| Provision for rate refunds |
(3,251 | ) | (5,225 | ) | 1,974 | 37.8 | ||||||||||
|
|
|
|
|
|
|
|||||||||||
| Total Retail Revenues |
349,953 | 332,524 | 17,429 | 5.2 | ||||||||||||
| Tariff-based wholesale |
60,218 | 62,260 | (2,042 | ) | (3.3 | ) | ||||||||||
| Market-based wholesale |
29,534 | 16,544 | 12,990 | 78.5 | ||||||||||||
| Transmission |
39,158 | 36,016 | 3,142 | 8.7 | ||||||||||||
| Other |
7,365 | 9,379 | (2,014 | ) | (21.5 | ) | ||||||||||
|
|
|
|
|
|
|
|||||||||||
| Total Revenues |
$ | 486,228 | $ | 456,723 | $ | 29,505 | 6.5 | |||||||||
|
|
|
|
|
|
|
|||||||||||
| (Thousands of MWh) | ||||||||||||||||
| Electricity Sales |
||||||||||||||||
| Residential |
1,407 | 1,394 | 13 | 0.9 | ||||||||||||
| Commercial |
1,748 | 1,726 | 22 | 1.3 | ||||||||||||
| Industrial |
1,285 | 1,303 | (18 | ) | (1.4 | ) | ||||||||||
| Other retail |
22 | 22 | — | — | ||||||||||||
|
|
|
|
|
|
|
|||||||||||
| Total Retail |
4,462 | 4,445 | 17 | 0.4 | ||||||||||||
|
|
|
|
|
|
|
|||||||||||
| Tariff-based wholesale |
1,393 | 1,346 | 47 | 3.5 | ||||||||||||
| Market-based wholesale |
1,015 | 563 | 452 | 80.3 | ||||||||||||
|
|
|
|
|
|
|
|||||||||||
| Total wholesale |
2,408 | 1,909 | 499 | 26.1 | ||||||||||||
|
|
|
|
|
|
|
|||||||||||
| Total Electricity Sales |
6,870 | 6,354 | 516 | 8.1 | ||||||||||||
|
|
|
|
|
|
|
|||||||||||
| (Dollars per MWh) | ||||||||||||||||
| Total retail |
$ | 78.43 | $ | 74.81 | $ | 3.62 | 4.8 | |||||||||
| Tariff-based wholesale |
$ | 43.23 | $ | 46.26 | $ | (3.03 | ) | (6.5 | ) | |||||||
| Market-based wholesale |
$ | 29.10 | $ | 29.39 | $ | (0.29 | ) | (1.0 | ) | |||||||
| (Dollars In Thousands) | ||||||||||||||||
| Fuel and Purchased Power |
||||||||||||||||
| Fuel used for generation |
$ | 119,413 | $ | 103,614 | $ | 15,799 | 15.2 | |||||||||
| Purchased power |
18,566 | 19,694 | (1,128 | ) | (5.7 | ) | ||||||||||
|
|
|
|
|
|
|
|||||||||||
| Subtotal |
137,979 | 123,308 | 14,671 | 11.9 | ||||||||||||
| RECA recovery and other |
6,117 | 1,260 | 4,857 | 385.5 | ||||||||||||
|
|
|
|
|
|
|
|||||||||||
| Total fuel and purchased power expense |
$ | 144,096 | $ | 124,568 | $ | 19,528 | 15.7 | |||||||||
|
|
|
|
|
|
|
|||||||||||
| (Thousands of MWh) | ||||||||||||||||
| Electricity Supply |
||||||||||||||||
| Generated - Gas/oil |
82 | 240 | (158 | ) | (65.8 | ) | ||||||||||
| Coal |
5,198 | 4,800 | 398 | 8.3 | ||||||||||||
| Nuclear |
1,248 | 966 | 282 | 29.2 | ||||||||||||
| Wind |
128 | 117 | 11 | 9.4 | ||||||||||||
|
|
|
|
|
|
|
|||||||||||
| Subtotal electricity generated |
6,656 | 6,123 | 533 | 8.7 | ||||||||||||
| Purchased |
565 | 616 | (51 | ) | (8.3 | ) | ||||||||||
|
|
|
|
|
|
|
|||||||||||
| Total Electricity Supply |
7,221 | 6,739 | 482 | 7.2 | ||||||||||||
|
|
|
|
|
|
|
|||||||||||
| (Dollars per MWh) | ||||||||||||||||
| Average cost of fuel used for generation |
$ | 17.94 | $ | 16.92 | $ | 1.02 | 6.0 | |||||||||
| Average cost of purchased power |
$ | 32.86 | $ | 31.97 | $ | 0.89 | 2.8 | |||||||||
| Average cost of fuel and purchased power |
$ | 19.11 | $ | 18.30 | $ | 0.81 | 4.4 | |||||||||
| Degree Days | ||||||||||||||||
| 2011 | 2010 / 20 yr Avg |
Change | % Change | |||||||||||||
| Cooling |
||||||||||||||||
| Actual compared to last year |
52 | 27 | 25 | 92.6 | ||||||||||||
| Actual compared to 20 year average |
52 | 39 | 13 | 33.3 | ||||||||||||
| Heating |
||||||||||||||||
| Actual compared to last year |
1,692 | 1,715 | (23 | ) | (1.3 | ) | ||||||||||
| Actual compared to 20 year average |
1,692 | 1,808 | (116 | ) | (6.4 | ) | ||||||||||
Westar Energy, Inc
Revenue, Sales and Energy Supply
Supplemental Data
| Twelve Months Ended December 31, | ||||||||||||||||
| 2011 | 2010 | Change | % Change | |||||||||||||
| (Dollars In Thousands) | ||||||||||||||||
| Revenues |
||||||||||||||||
| Residential |
$ | 693,388 | $ | 661,177 | $ | 32,211 | 4.9 | |||||||||
| Commercial |
604,626 | 572,062 | 32,564 | 5.7 | ||||||||||||
| Industrial |
347,881 | 318,249 | 29,632 | 9.3 | ||||||||||||
| Other retail |
12,252 | 11,961 | 291 | 2.4 | ||||||||||||
| Provision for rate refunds |
(21,216 | ) | (24,664 | ) | 3,448 | 14.0 | ||||||||||
|
|
|
|
|
|
|
|||||||||||
| Total Retail Revenues |
1,636,931 | 1,538,785 | 98,146 | 6.4 | ||||||||||||
| Tariff-based wholesale |
265,360 | 246,195 | 19,165 | 7.8 | ||||||||||||
| Market-based wholesale |
81,588 | 88,474 | (6,886 | ) | (7.8 | ) | ||||||||||
| Transmission |
154,569 | 144,513 | 10,056 | 7.0 | ||||||||||||
| Other |
32,543 | 38,204 | (5,661 | ) | (14.8 | ) | ||||||||||
|
|
|
|
|
|
|
|||||||||||
| Total Revenues |
$ | 2,170,991 | $ | 2,056,171 | $ | 114,820 | 5.6 | |||||||||
|
|
|
|
|
|
|
|||||||||||
| (Thousands of MWh) | ||||||||||||||||
| Electricity Sales |
||||||||||||||||
| Residential |
6,986 | 6,957 | 29 | 0.4 | ||||||||||||
| Commercial |
7,573 | 7,519 | 54 | 0.7 | ||||||||||||
| Industrial |
5,589 | 5,468 | 121 | 2.2 | ||||||||||||
| Other retail |
88 | 89 | (1 | ) | (1.1 | ) | ||||||||||
|
|
|
|
|
|
|
|||||||||||
| Total Retail |
20,236 | 20,033 | 203 | 1.0 | ||||||||||||
|
|
|
|
|
|
|
|||||||||||
| Tariff-based wholesale |
5,883 | 6,074 | (191 | ) | (3.1 | ) | ||||||||||
| Market-based wholesale |
2,332 | 2,638 | (306 | ) | (11.6 | ) | ||||||||||
|
|
|
|
|
|
|
|||||||||||
| Total wholesale |
8,215 | 8,712 | (497 | ) | (5.7 | ) | ||||||||||
|
|
|
|
|
|
|
|||||||||||
| Total Electricity Sales |
28,451 | 28,745 | (294 | ) | (1.0 | ) | ||||||||||
|
|
|
|
|
|
|
|||||||||||
| (Dollars per MWh) | ||||||||||||||||
| Total retail |
$ | 80.89 | $ | 76.81 | $ | 4.08 | 5.3 | |||||||||
| Tariff-based wholesale |
$ | 45.11 | $ | 40.53 | $ | 4.58 | 11.3 | |||||||||
| Market-based wholesale |
$ | 34.99 | $ | 33.54 | $ | 1.45 | 4.3 | |||||||||
| (Dollars In Thousands) | ||||||||||||||||
| Fuel and Purchased Power |
||||||||||||||||
| Fuel used for generation |
$ | 556,771 | $ | 513,710 | $ | 43,061 | 8.4 | |||||||||
| Purchased power |
91,851 | 79,492 | 12,359 | 15.5 | ||||||||||||
|
|
|
|
|
|
|
|||||||||||
| Subtotal |
648,622 | 593,202 | 55,420 | 9.3 | ||||||||||||
| RECA recovery and other |
(17,829 | ) | (9,841 | ) | (7,988 | ) | (81.2 | ) | ||||||||
|
|
|
|
|
|
|
|||||||||||
| Total fuel and purchased power expense |
$ | 630,793 | $ | 583,361 | $ | 47,432 | 8.1 | |||||||||
|
|
|
|
|
|
|
|||||||||||
| (Thousands of MWh) | ||||||||||||||||
| Electricity Supply |
||||||||||||||||
| Generated - Gas/oil |
2,305 | 1,922 | 383 | 19.9 | ||||||||||||
| Coal |
21,184 | 21,440 | (256 | ) | (1.2 | ) | ||||||||||
| Nuclear |
3,440 | 4,491 | (1,051 | ) | (23.4 | ) | ||||||||||
| Wind |
454 | 453 | 1 | 0.2 | ||||||||||||
|
|
|
|
|
|
|
|||||||||||
| Subtotal electricity generated |
27,383 | 28,306 | (923 | ) | (3.3 | ) | ||||||||||
| Purchased |
2,680 | 2,194 | 486 | 22.2 | ||||||||||||
|
|
|
|
|
|
|
|||||||||||
| Total Electricity Supply |
30,063 | 30,500 | (437 | ) | (1.4 | ) | ||||||||||
|
|
|
|
|
|
|
|||||||||||
| (Dollars per MWh) | ||||||||||||||||
| Average cost of fuel used for generation |
$ | 20.33 | $ | 18.15 | $ | 2.18 | 12.0 | |||||||||
| Average cost of purchased power |
$ | 34.27 | $ | 36.23 | $ | (1.96 | ) | (5.4 | ) | |||||||
| Average cost of fuel and purchased power |
$ | 21.58 | $ | 19.45 | $ | 2.13 | 11.0 | |||||||||
| Degree Days | ||||||||||||||||
| 2011 | 2010 / 20 yr Avg |
Change | % Change | |||||||||||||
| Cooling |
||||||||||||||||
| Actual compared to last year |
2,119 | 1,975 | 144 | 7.3 | ||||||||||||
| Actual compared to 20 year average |
2,119 | 1,624 | 495 | 30.5 | ||||||||||||
| Heating |
||||||||||||||||
| Actual compared to last year |
4,800 | 4,712 | 88 | 1.9 | ||||||||||||
| Actual compared to 20 year average |
4,800 | 4,668 | 132 | 2.8 | ||||||||||||
Westar Energy, Inc.
Capitalization
| December 31, 2011 |
December 31, 2010 |
|||||||||||||||
| (Dollars in Thousands) | ||||||||||||||||
| Current maturities of long-term debt |
$ | — | $ | 61 | ||||||||||||
| Current maturities of long-term debt of VIEs |
28,114 | 30,155 | ||||||||||||||
| Long-term debt, net |
2,491,109 | 2,490,871 | ||||||||||||||
| Long-term debt of variable interest entities, net |
249,283 | 278,162 | ||||||||||||||
|
|
|
|
|
|||||||||||||
| Total debt |
2,768,506 | 49.7 | % | 2,799,249 | 53.7 | % | ||||||||||
| Preferred |
21,436 | 0.4 | % | 21,436 | 0.4 | % | ||||||||||
| Common equity |
2,769,211 | 49.7 | % | 2,382,867 | 45.8 | % | ||||||||||
| Noncontrolling interests |
10,094 | 0.2 | % | 6,070 | 0.1 | % | ||||||||||
|
|
|
|
|
|
|
|
|
|||||||||
| Total capitalization |
$ | 5,569,247 | 100.0 | % | $ | 5,209,622 | 100.0 | % | ||||||||
|
|
|
|
|
|||||||||||||
| GAAP Book value per share |
$ | 22.03 | $ | 21.25 | ||||||||||||
| Period end shares outstanding (in thousands) |
125,698 | 112,128 | ||||||||||||||
Outstanding long-term debt table
| CUSIP | December 31, 2011 |
December 31, 2010 |
||||||||||
| (Dollars in Thousands) | ||||||||||||
| Westar Energy: |
||||||||||||
| First Mortgage Bond series: |
||||||||||||
| 6.00% Series due July 2014 |
95709TAA8 | $ | 250,000 | $ | 250,000 | |||||||
| 5.15% Series due January 2017 |
95709TAB6 | 125,000 | 125,000 | |||||||||
| 5.95% Series due January 2035 |
95709TAC4 | 125,000 | 125,000 | |||||||||
| 5.10% Series due July 2020 |
95709TAD2 | 250,000 | 250,000 | |||||||||
| 5.875% Series due July 2036 |
95709TAE0 | 150,000 | 150,000 | |||||||||
| 6.10% Series due May 2047 |
95709T704 | 150,000 | 150,000 | |||||||||
| 8.625% Series due December 2018 |
95709TAG5 | 300,000 | 300,000 | |||||||||
|
|
|
|
|
|||||||||
| 1,350,000 | 1,350,000 | |||||||||||
| Pollution control bond series: |
||||||||||||
| Variable series due April 2032 (Wamego) |
933623BN9 | 30,500 | 30,500 | |||||||||
| Variable series due April 2032 (St Marys) |
792609AF6 | 45,000 | 45,000 | |||||||||
| 5.0% Series due February 2033 (Wamego) |
933623BQ2 | 57,245 | 57,530 | |||||||||
|
|
|
|
|
|||||||||
| 132,745 | 133,030 | |||||||||||
| Other long-term debt: |
||||||||||||
| 4.36% Equipment financing loan due 2011 |
— | 61 | ||||||||||
|
|
|
|
|
|||||||||
| — | 61 | |||||||||||
|
|
|
|
|
|||||||||
| Total Westar Energy |
1,482,745 | 1,483,091 | ||||||||||
| KGE |
||||||||||||
| First mortgage bond series: |
||||||||||||
| 6.53% Series due December 2037 |
485260BJ1 | 175,000 | 175,000 | |||||||||
| 6.15% Series due May 2023 |
485260B@1 | 50,000 | 50,000 | |||||||||
| 6.64%Series due May 2038 |
485260B | #9 | 100,000 | 100,000 | ||||||||
| 6.70%Series due June 2019 |
U24448AB5 | 300,000 | 300,000 | |||||||||
|
|
|
|
|
|||||||||
| 625,000 | 625,000 | |||||||||||
| Pollution control bond series: |
||||||||||||
| 5.3% Series due June 2031 |
121825BW2 | 108,600 | 108,600 | |||||||||
| 5.3% Series due June 2031 |
933623BR0 | 18,900 | 18,900 | |||||||||
| 4.85% Series due June 2031 |
121825CB7 | 50,000 | 50,000 | |||||||||
| 5.10% Series due March 2023 |
502828AH9 | 13,318 | 13,343 | |||||||||
| Variable rate series due April 2027 (LaCygne) |
502828AJ5 | 21,940 | 21,940 | |||||||||
| Variable rate series due April 2032 (St Marys) |
792609AE9 | 14,500 | 14,500 | |||||||||
| Variable rate series due April 2032 (Wamego) |
933623BM1 | 10,000 | 10,000 | |||||||||
| 5.6% Series due June 2031 |
121825CD3 | 50,000 | 50,000 | |||||||||
| 6.0% Series due June 2031 |
121825CE1 | 50,000 | 50,000 | |||||||||
| 5.0% Series due June 2031 |
121825CF8 | 50,000 | 50,000 | |||||||||
|
|
|
|
|
|||||||||
| 387,258 | 387,283 | |||||||||||
|
|
|
|
|
|||||||||
| Total KGE |
1,012,258 | 1,012,283 | ||||||||||
| Total long-term debt |
2,495,003 | 2,495,374 | ||||||||||
|
|
|
|
|
|||||||||
| Unamortized debt discount |
(3,894 | ) | (4,442 | ) | ||||||||
| Long-term debt due within one year |
— | (61 | ) | |||||||||
|
|
|
|
|
|||||||||
| Total long-term debt, net |
$ | 2,491,109 | $ | 2,490,871 | ||||||||
|
|
|
|
|
|||||||||
Westar Energy, Inc.
GAAP to Non-GAAP Reconciliation
Fuel and purchased power costs fluctuate with electricity sales and unit costs. As permitted by regulators, prices are adjusted to reflect changes in fuel and purchased power costs, and accordingly changes to these costs have a minimal impact on net income. For this reason, Westar management believes that gross margin is a useful measure for understanding changes in operating performance from one period to the next. Gross margin is calculated as total revenues less the sum of fuel and purchased power costs and SPP network transmission costs. SPP network transmission costs are included as a component of gross margin because these costs reflect the costs of providing network transmission service, and a significant component of transmission revenue is recognized when providing this service.
Operating and maintenance expense includes SPP network transmission costs (SPP NITS). The SPP network transmission costs are included in gross margin for the reasons shown above, and are therefore excluded from operating and maintenance expense w/o SPP NITS used to reconcile earnings from the comparable prior year period to the earnings for the current period. Westar management believes this measurement is useful for understanding changes in operating performance from one period to the next. Operating and maintenance expense w/o SPP NITS is calculated by subtracting the SPP network transmission costs from operating and maintenance expense.
The calculations of gross margin and operating and maintenance expense w/o SPP NITS for the three and twelve months ended December 31, 2011 and 2010 are shown in the table below. The table also includes a reconciliation of gross margin to income from operations for both periods. Income from operations is the GAAP financial measure most directly comparable to gross margin. Operating and maintenance expense is the GAAP financial measure most directly comparable to operating and maintenance expense w/o SPP NITS.
| Three Months Ended December 31, | Twelve Months Ended December 31, | |||||||||||||||||||||||
| 2011 | 2010 | Change | 2011 | 2010 | Change | |||||||||||||||||||
| (Dollars In Thousands) | (Dollars In Thousands) | |||||||||||||||||||||||
| Revenues |
||||||||||||||||||||||||
| Residential |
$ | 136,604 | $ | 130,957 | $ | 5,647 | $ | 693,388 | $ | 661,177 | $ | 32,211 | ||||||||||||
| Commercial |
134,175 | 128,170 | 6,005 | 604,626 | 572,062 | 32,564 | ||||||||||||||||||
| Industrial |
79,379 | 75,637 | 3,742 | 347,881 | 318,249 | 29,632 | ||||||||||||||||||
| Other retail |
(205 | ) | (2,240 | ) | 2,035 | (8,964 | ) | (12,703 | ) | 3,739 | ||||||||||||||
|
|
|
|
|
|
|
|
|
|
|
|
|
|||||||||||||
| Total Retail Revenues |
349,953 | 332,524 | 17,429 | 1,636,931 | 1,538,785 | 98,146 | ||||||||||||||||||
| Wholesale |
89,752 | 78,804 | 10,948 | 346,948 | 334,669 | 12,279 | ||||||||||||||||||
| Transmission |
39,158 | 36,016 | 3,142 | 154,569 | 144,513 | 10,056 | ||||||||||||||||||
| Other |
7,365 | 9,379 | (2,014 | ) | 32,543 | 38,204 | (5,661 | ) | ||||||||||||||||
|
|
|
|
|
|
|
|
|
|
|
|
|
|||||||||||||
| Total Revenues |
486,228 | 456,723 | 29,505 | 2,170,991 | 2,056,171 | 114,820 | ||||||||||||||||||
| Less: Fuel and purchased power expense |
144,096 | 124,568 | 19,528 | 630,793 | 583,361 | 47,432 | ||||||||||||||||||
| SPP network transmission costs |
33,541 | 29,703 | 3,838 | 132,164 | 116,449 | 15,715 | ||||||||||||||||||
|
|
|
|
|
|
|
|
|
|
|
|
|
|||||||||||||
| Gross Margin |
$ | 308,591 | $ | 302,452 | $ | 6,139 | $ | 1,408,034 | $ | 1,356,361 | $ | 51,673 | ||||||||||||
|
|
|
|
|
|
|
|
|
|
|
|
|
|||||||||||||
| Gross margin |
$ | 308,591 | $ | 302,452 | $ | 6,139 | $ | 1,408,034 | $ | 1,356,361 | $ | 51,673 | ||||||||||||
| Add: SPP network transmission costs |
33,541 | 29,703 | 3,838 | 132,164 | 116,449 | 15,715 | ||||||||||||||||||
| Less: Operating and maintenance expense |
145,323 | 150,825 | (5,502 | ) | 557,752 | 520,409 | 37,343 | |||||||||||||||||
| Depreciation and amortization expense |
71,771 | 69,982 | 1,789 | 285,322 | 271,937 | 13,385 | ||||||||||||||||||
| Selling, general and administrative expense |
52,463 | 63,108 | (10,645 | ) | 184,695 | 207,607 | (22,912 | ) | ||||||||||||||||
|
|
|
|
|
|
|
|
|
|
|
|
|
|||||||||||||
| Income from operations |
$ | 72,575 | $ | 48,240 | $ | 24,335 | $ | 512,429 | $ | 472,857 | $ | 39,572 | ||||||||||||
|
|
|
|
|
|
|
|
|
|
|
|
|
|||||||||||||
| Operating and maintenance expense |
$ | 145,323 | $ | 150,825 | $ | (5,502 | ) | $ | 557,752 | $ | 520,409 | $ | 37,343 | |||||||||||
| Less: SPP Network transmission costs |
33,541 | 29,703 | 3,838 | 132,164 | 116,449 | 15,715 | ||||||||||||||||||
|
|
|
|
|
|
|
|
|
|
|
|
|
|||||||||||||
| Operating and maintenance expense w/o SPP NITS |
$ | 111,782 | $ | 121,122 | $ | (9,340 | ) | $ | 425,588 | $ | 403,960 | $ | 21,628 | |||||||||||
|
|
|
|
|
|
|
|
|
|
|
|
|
|||||||||||||
| % change O&M w/o SPP NITS |
-7.7 | % | 5.4 | % | ||||||||||||||||||||
| Operating and maintenance expense w/o SPP NITS |
$ | 111,782 | $ | 121,122 | $ | (9,340 | ) | $ | 425,588 | $ | 403,960 | $ | 21,628 | |||||||||||
| Selling, general and administrative expense |
52,463 | 63,108 | (10,645 | ) | 184,695 | 207,607 | (22,912 | ) | ||||||||||||||||
|
|
|
|
|
|
|
|
|
|
|
|
|
|||||||||||||
| O&M and SGA w/o SPP NITS |
164,245 | 184,230 | $ | (19,985 | ) | 610,283 | 611,567 | $ | (1,284 | ) | ||||||||||||||
| -10.8 | % | -0.2 | % | |||||||||||||||||||||
| Reversal of accrual as result of legal settlements |
$ | — | $ | — | $ | (22,039 | ) | $ | — | $ | (22,039 | ) | ||||||||||||
| Legal expenses related to settlements |
— | — | 7,812 | 7,812 | ||||||||||||||||||||
|
|
|
|
|
|
|
|
|
|
|
|
|
|||||||||||||
| Settlement reversal and exclude legal expense |
— | — | — | (14,227 | ) | — | (14,227 | ) | ||||||||||||||||
|
|
|
|
|
|
|
|
|
|
|
|
|
|||||||||||||
| Adjusted O&M & SGA |
$ | 164,245 | $ | 184,230 | $ | (19,985 | ) | $ | 624,510 | $ | 611,567 | $ | 12,943 | |||||||||||
|
|
|
|
|
|
|
|
|
|
|
|
|
|||||||||||||
| -10.8 | % | 2.1 | % | |||||||||||||||||||||
 1
Capital
Expenditure
Forecast
2012
-
2014
Actual
Forecast
Forecast
Forecast
Forecast
Method of
Cost
2011
2012
2013
2014
2012 - 2014
Recovery
Generation replacements and other
132.8
$
159.8
$
172.3
$
164.6
$
496.7
$
GRC
Westar environmental
153.4
219.3
121.7
107.4
448.4
ECRR
La Cygne environmental
66.5
215.9
208.9
123.7
548.5
GRC
Nuclear Fuel
18.5
21.9
44.2
20.6
86.7
RECA
Transmission
188.8
136.5
200.7
197.4
534.6
FERC / TDC
Distribution
New customers, replacements & other
95.9
92.8
106.7
88.1
287.6
GRC
Smart grid (a)
17.9
3.7
3.7
GRC
Other
23.6
21.5
23.6
12.1
57.2
GRC
Total
697.4
$
871.4
$
878.1
$
713.9
$
2,463.4
$
(a) net of DOE matching grant
Prairie Wind Transmission joint venture
2.0
$
2.1
$
28.0
$
2.6
$
32.7
$
Not included in the table are Westar's planned investment in Prairie Wind
Transmission joint venture |
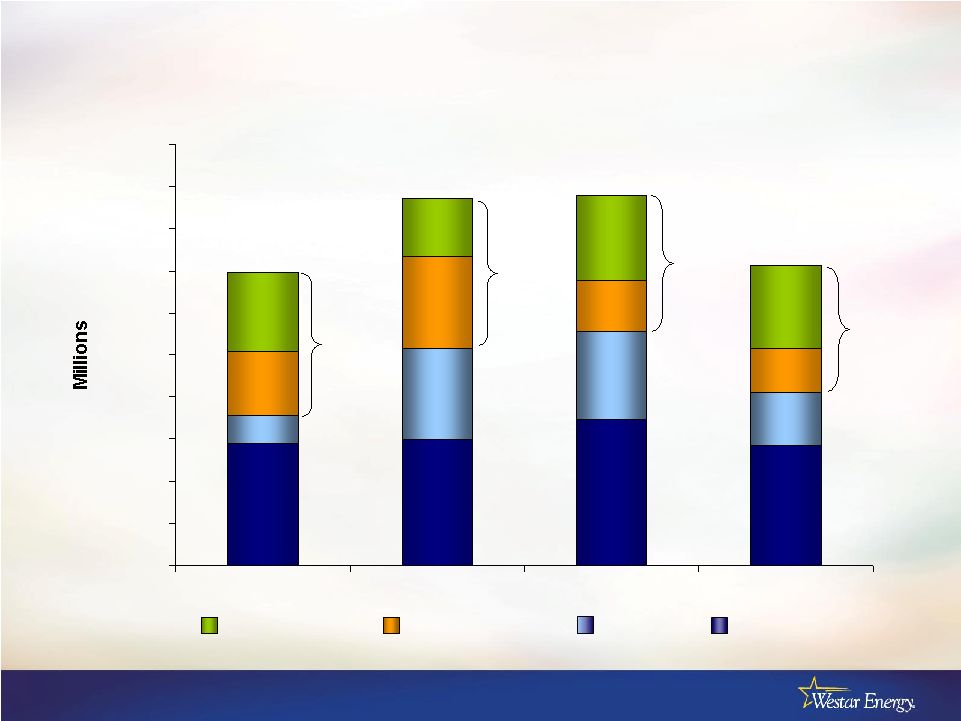 2
Capital
Expenditure
Forecast
2012
-
2014
$0
$100
$200
$300
$400
$500
$600
$700
$800
$900
$1,000
2011
2012
2013
2014
$697
$871
$878
$714
Air Quality
Other
Transmission
43%
37%
41%
49%
La Cygne |