Attached files
| file | filename |
|---|---|
| 8-K - FORM 8-K - NATIONAL FINANCIAL PARTNERS CORP | d296210d8k.htm |
 FOURTH QUARTER 2011 EARNINGS CALL PRESENTATION
FEBRUARY 8, 2012
Exhibit 99.1 |
 2
Related to Forward-Looking Statements
Certain items in this presentation and in today’s discussion, including matters relating to
revenue, net income, Adjusted EBITDA, cash earnings, cash earnings per diluted share and
percentages or calculations using these measures, acquisitions, capital structure or growth
rates and other financial measurements and non-financial statements in future periods,
constitute forward-looking statements as that term is defined in the Private Securities Litigation Reform Act of
1995. These forward-looking statements are based on management's current views with respect
to future results and are subject to risks and uncertainties. These statements are not
guarantees of future performance. Actual results may differ materially from those
contemplated by forward-looking statements. National Financial Partners Corp. (“NFP” or the
“Company”) refers you to its filings with the SEC, including its Annual Report on Form
10-K for the year ended December 31, 2010, filed on February 10, 2011, for additional
discussion of these risks and uncertainties as well as a cautionary statement regarding
forward-looking statements. Forward-looking statements made during this presentation speak only
as of today's date. NFP expressly disclaims any obligation to update or revise any
forward-looking statements, whether as a result of new information, future events or
otherwise. |
 3
Related to Non-GAAP Financial Information
The Company analyzes its performance using historical and forward-looking non-GAAP financial
measures called cash earnings, cash earnings per diluted share, Adjusted EBITDA, and
percentages or calculations using these measures. The Company believes these non-GAAP
financial measures provide additional meaningful methods of evaluating certain aspects of the Company’s
operating performance from period to period on a basis that may not be otherwise apparent under GAAP.
Cash earnings is defined as net income excluding amortization of intangibles, depreciation, the
after-tax impact of the impairment of goodwill and intangible assets, the after-tax
impact of non-cash interest, the after-tax impact of change in estimated acquisition earn-out payables recorded
in accordance with purchase accounting that have been subsequently adjusted and recorded in the
consolidated statements of operations, the after-tax impact of management contract buyouts
and the after-tax impact of certain non-recurring items. Cash earnings per diluted
share is calculated by dividing cash earnings by the number of weighted average diluted shares outstanding for
the period indicated. Cash earnings and cash earnings per diluted
share should not be viewed as substitutes for net income and net income per diluted share,
respectively. Adjusted EBITDA is defined as net income excluding income tax expense, interest income,
interest expense, gain on early extinguishment of debt, other, net, amortization of intangibles,
depreciation, impairment of goodwill and intangible assets, (gain) loss on sale of businesses,
net, the accelerated vesting of certain RSUs, any change in estimated acquisition earn-out
payables recorded in accordance with purchase accounting that have been subsequently adjusted and recorded
in the consolidated statements of operations and the expense related to management contract buyouts.
Adjusted EBITDA should not be viewed as a substitute for net income. A reconciliation of these
non-GAAP financial measures to their GAAP counterparts for the periods presented herein is
provided in the Company’s quarterly financial supplement for the period ended December 31, 2011,
which is available on the Investor Relations section of the
Company’s Web site at www.nfp.com. |
 4
Reconciliation: Net Income to Cash Earnings
(1)
Cash earnings is a non-GAAP financial measure, which the Company defines as net
income excluding amortization of intangibles, depreciation, the after-tax impact of the impairment of goodwill and intangible
assets, the after-tax impact of non-cash interest, the after-tax
impact of change in estimated acquisition earn-out payables recorded in accordance with purchase accounting that have been subsequently adjusted
and recorded in the consolidated statements of operations, the after-tax impact
of management contract buyouts and the after-tax impact of certain non-recurring items.
(2)
The
sum
of
the
per-share
components
of
cash
earnings
per
share
-
diluted
may
not
agree
to
cash
earnings
per
share
-
diluted
due
to
rounding.
Q4 2011
Q4 2010
2011
2010
GAAP net income
$11,245
$ 15,269
$ 36,932
$ 42,558
Amortization of intangibles
8,271
8,211
32,478
33,013
Depreciation
3,313
3,095
12,553
12,123
Impairment of goodwill and intangible assets
8,319
-
11,705
2,901
Tax benefit of impairment of goodwill and intangible assets
(3,390)
(15)
(4,729)
(1,147)
Non-cash interest, net of tax
670
802
2,602
5,094
Accelerated vesting of certain RSUs, net of tax
-
-
-
8,174
Gain on early extinguishment of debt, net of tax
-
-
-
(5,914)
Change in estimated acquisition earn-out payables, net of tax
(731)
-
(699)
-
Cash earnings (1)
$27,697
$ 27,362
$ 90,842
$ 96,802
GAAP
net
income
per
share
-
diluted
$ 0.27
$ 0.34
$ 0.84
$ 0.96
Amortization of intangibles
0.20
0.18
0.74
0.75
Depreciation
0.08
0.07
0.29
0.27
Impairment of goodwill and intangible assets
0.20
-
0.27
0.07
Tax benefit of impairment of goodwill and intangible assets
(0.08)
-
(0.11)
(0.03)
Non-cash interest, net of tax
0.02
0.02
0.06
0.12
Accelerated vesting of certain RSUs, net of tax
-
-
-
0.19
Gain on early extinguishment of debt, net of tax
-
-
-
(0.13)
Change in estimated acquisition earn-out payables, net of tax
(0.02)
-
(0.02)
-
Cash
earnings
per
share
-
diluted
(2)
$ 0.65
$ 0.60
$ 2.07
$ 2.19 |
 5
Reconciliation: Net Income to
Adjusted EBITDA
For a reconciliation of Adjusted EBITDA per reportable segment for the three months
ended March 31, 2011, June 30, 2011, September 30, 2011 and December 31, 2011, please
see the Company’s quarterly financial supplement for the period ended December
31, 2011 which is available on the Investor Relations section of the Company’s Web site at
www.nfp.com.
Corporate
Individual
Advisor
(in thousands)
Client Group
Client Group
Services Group
Consolidated
For the twelve months ended December 31, 2011
GAAP net income
36,932
$
Income tax expense
28,387
Interest income
(3,333)
Interest expense
15,733
Gain on early extinguishment of debt
-
Other, net
(6,386)
Income from operations
48,169
$
14,167
$
8,997
$
71,333
$
Amortization of intangibles
21,553
10,925
-
32,478
Depreciation
6,107
4,275
2,171
12,553
Impairment of goodwill and intangible assets
1,246
10,459
-
11,705
(Gain) loss on sale of businesses, net
(103)
(1,135)
-
(1,238)
Accelerated vesting of certain RSUs
-
-
-
-
Change in estimated acquisition
earn-out payables (414)
-
-
(414)
Adjusted EBITDA
(1)
76,558
$
38,691
$
11,168
$
126,417
$
For the twelve months ended December 31, 2010
GAAP net income
42,558
$
Income tax expense
26,481
Interest income
(3,854)
Interest expense
18,533
Gain on early extinguishment of debt
(9,711)
Other, net
(8,303)
Income from operations
43,046
$
15,202
$
7,456
$
65,704
$
Amortization of intangibles
21,398
11,615
-
33,013
Depreciation
6,298
4,458
1,367
12,123
Impairment of goodwill and intangible assets
1,931
970
-
2,901
(Gain) loss on sale of businesses, net
(8,058)
(2,237)
-
(10,295)
Accelerated vesting of certain RSUs
7,394
6,001
-
13,395
Change in estimated acquisition earn-out payables
-
-
-
-
Adjusted EBITDA
(1)
72,009
$
36,009
$
8,823
$
116,841
$
Adjusted EBITDA is a non-GAAP financial measure, which the Company defines as net income excluding
income tax expense, interest income, interest expense, gain on early extinguishment of debt,
other, net, amortization of intangibles, depreciation, impairment of goodwill and intangible assets, (gain) loss on sale of businesses, net, the
accelerated vesting of certain RSUs, any change in estimated acquisition earn-out payables
recorded in accordance with purchase accounting that have been subsequently adjusted and
recorded in the consolidated statements of operations and the expense related to management contract buyouts.
The reconciliation of Adjusted EBITDA per reportable segment does not include the following items,
which are not allocated to any of the Company’s reportable segments: income tax expense,
interest income, interest expense, gain on early extinguishment of debt and other, net. These items are included in the reconciliation of Adjusted
EBITDA to net income on a consolidated basis.
(1) |
 JESSICA BIBLIOWICZ
Chairman, President & Chief Executive Officer |
 7
2011 Highlights
Revenue over $1 billion driven by
Revenue growth +3.2%
Organic revenue growth +2.3%
–
Corporate Client Group +3.6%
–
Advisor Services Group +16.1%
Acquisitions
Adjusted EBITDA grew 8%; margin expansion
Executed on balanced capital allocation strategy in 2011
$50 million, approximately, for strategic acquisitions and
sub-acquisitions $50 million stock repurchase plan
–
Completed program in February 2012
Reinvestment in existing businesses |
 8
2012 Balanced Capital Allocation Strategy
Strategic acquisitions of $80 million
Includes approximately $20 million for management contract buyouts
Recurring revenue businesses
AGS acquisition completed in 1Q12
NFP Dreyfuss & Birke management contract buyout completed in 1Q12
New
share
repurchase
authorization
-
$50
million
Intend to commence in May 2012, due to restrictions in our credit facility and
subject to market and other conditions
Reinvestment in existing businesses
Enhance leadership position in benefits, insurance and wealth management
|
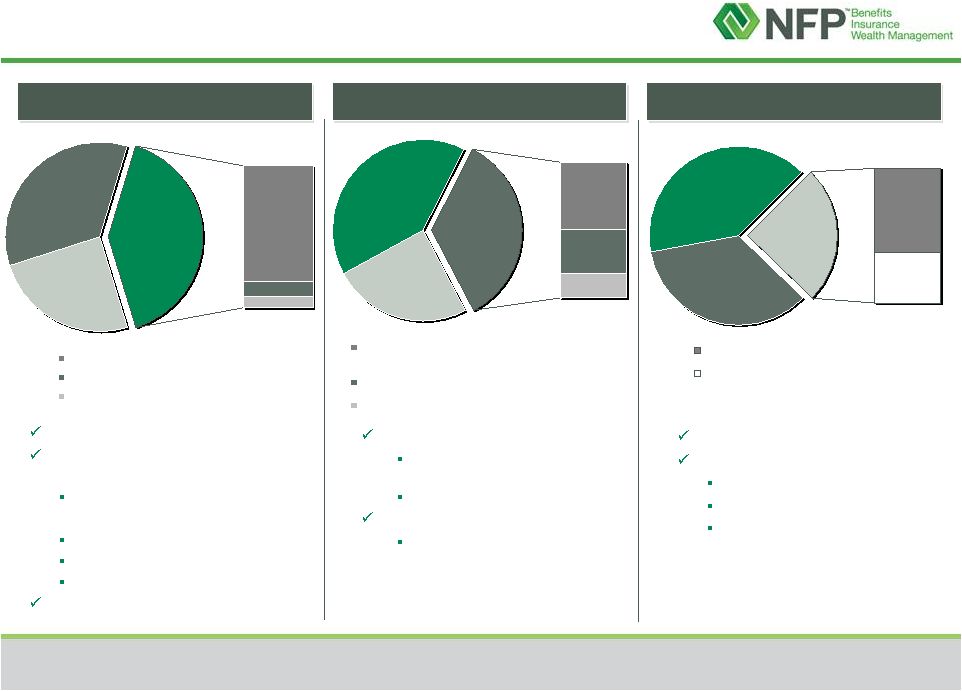
 9
Business Segments
$351.4
34.7%
$249.8
24.6%
$412.2
40.7%
Advisor Services Group
Individual Client Group
Corporate
Client Group
FY 2011 organic revenue growth +3.6%
FY 2012 expectations for CCG
3% -
4% organic growth
Adjusted EBITDA margins
Growth from acquisitions
FY 2011 organic revenue decline -6.9%
Strong performance in wealth management
FY 2012 expectations for life insurance
Volatility and uncertainty remains in the
market
Could cause further declines
–
Anticipate 1Q12 weaker than
1Q11
FY 2011 organic revenue growth +16.1%
FY 2012 expectations for ASG (depending on
performance of financial markets)
4% -
5% organic growth
Investments in recruiting and marketing
Adjusted EBITDA margins approximately 4.5%-5%
($ in millions)
Corporate Client Group
Individual Client Group
Advisor Services Group
FY11 Revenue $1,013.4 million
–
19%-20% in second half of 2012
–
Approximately 18.5% in each of
1Q12 and 2Q12 |
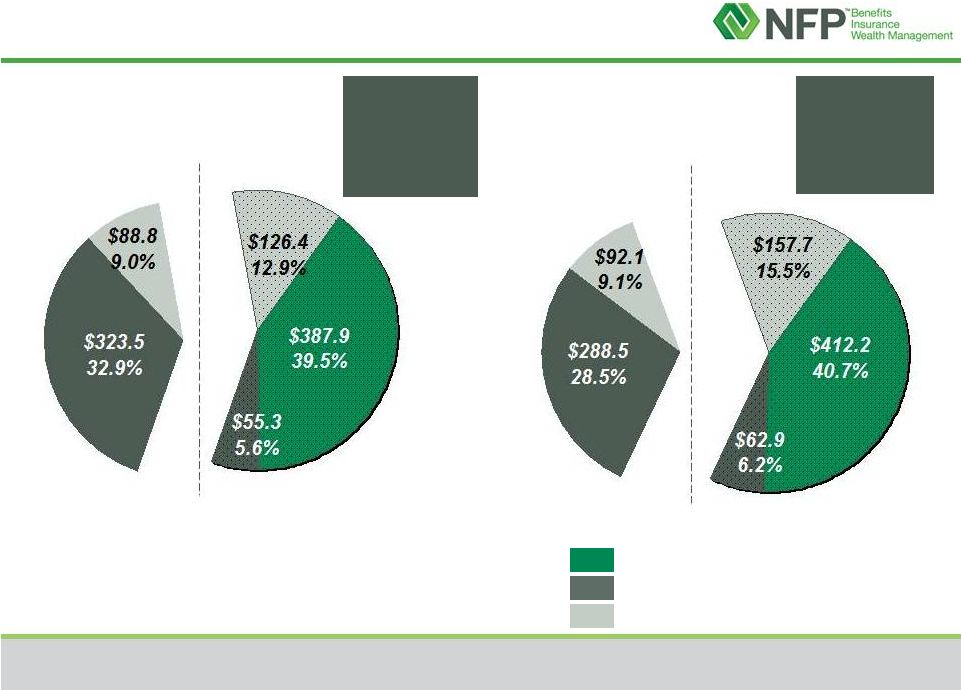 10
FY10
Recurring
revenue
58.0%²
($ in millions)
FY11
Recurring
revenue
62.4%
FY10 Revenue $981.9 million
FY11 Revenue $1,013.4 million
Individual Client Group
Corporate Client Group
Advisor Services Group
FY Recurring Revenue by Business Segment
1
Recurring revenue includes revenue from corporate and executive benefits, property & casualty,
wealth management and asset-based fees and trails.
Previously reported as 57.0%; updated due to re-categorization of certain asset-based fees and
trails. 1
2 |
 DOUG HAMMOND
Chief Operating Officer |
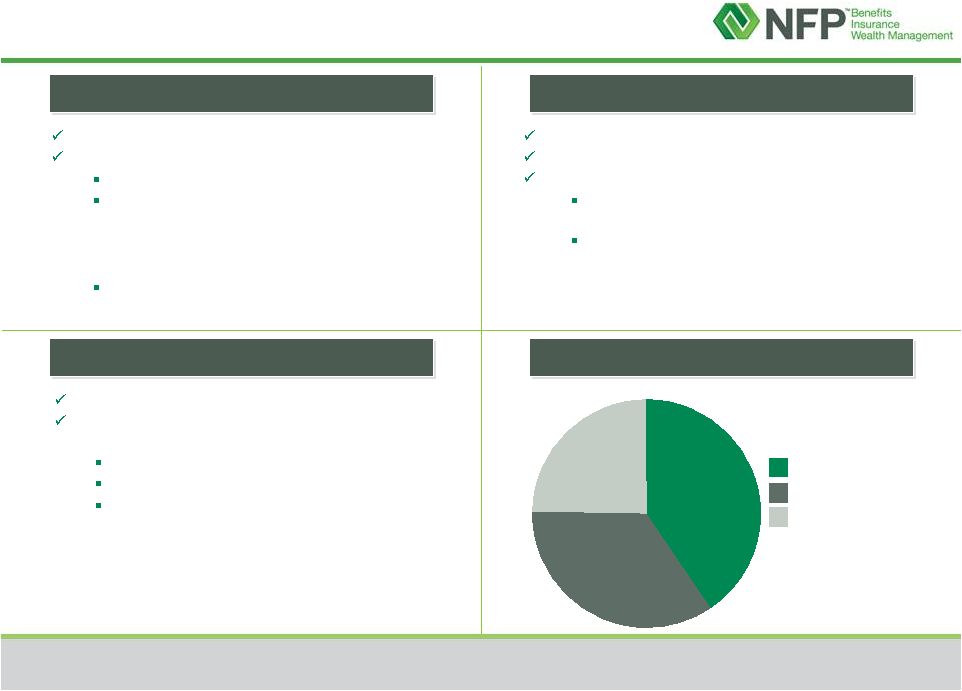
 12
Business Segment
FY11 Overview & Components of Revenue
Corporate Benefits
Executive Benefits
Property & Casualty
34.7%
Retail Life
Marketing Organization & Wholesale Life
Brokerage
Wealth Management
Asset Based Fees & Trails
Commissions & Non-Recurring Fees
% of CCG
Revenue
% of ICG
Revenue
% of ASG
Revenue
81.9%
10.7%
7.4%
40.7%
17.9%
31.9%
50.2%
63.2%
36.8%
24.6%
Steady and recurring business
Diversification of products and
services
Health & Welfare
–
Health care reform
Retirement
NFP Executive Benefits
P&C
Strategic acquisition pipeline
Life insurance
Challenges and uncertainty
remain in the market
Strategic repositioning
Wealth management
Strong performance continues
AUM $9.7 billion, up 3.7% YOY
Growth drivers
New assets
Advisor recruitment
Asset-based fees (due to broader
financial market performance)
Corporate Client Group
Individual Client Group
Advisor Services Group
|
 DONNA BLANK
Chief Financial Officer |
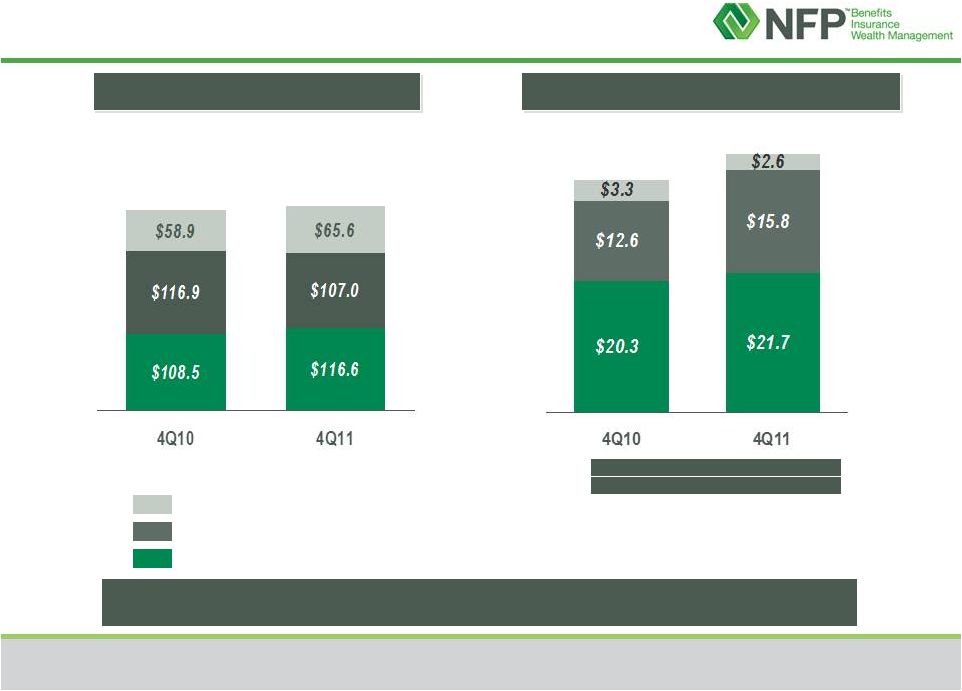 14
4Q11 Consolidated Financial Highlights
($ in millions)
56.4%
60.7%
Recurring
Revenue
Individual Client Group
Corporate Client Group
Advisor Services Group
Adjusted EBITDA Margin
4Q10
4Q11
Corporate Client Group
18.7%
18.6%
Individual Client Group
10.8%
14.8%
Advisor Services Group
5.5%
4.0%
Consolidated
12.7%
13.9%
Adjusted EBITDA growth +11% and margin expansion
The sum of the components may not agree to total due to rounding.
$36.1
$40.1
1
1
$284.3
$289.2
Revenue
Adjusted EBITDA & Margin |
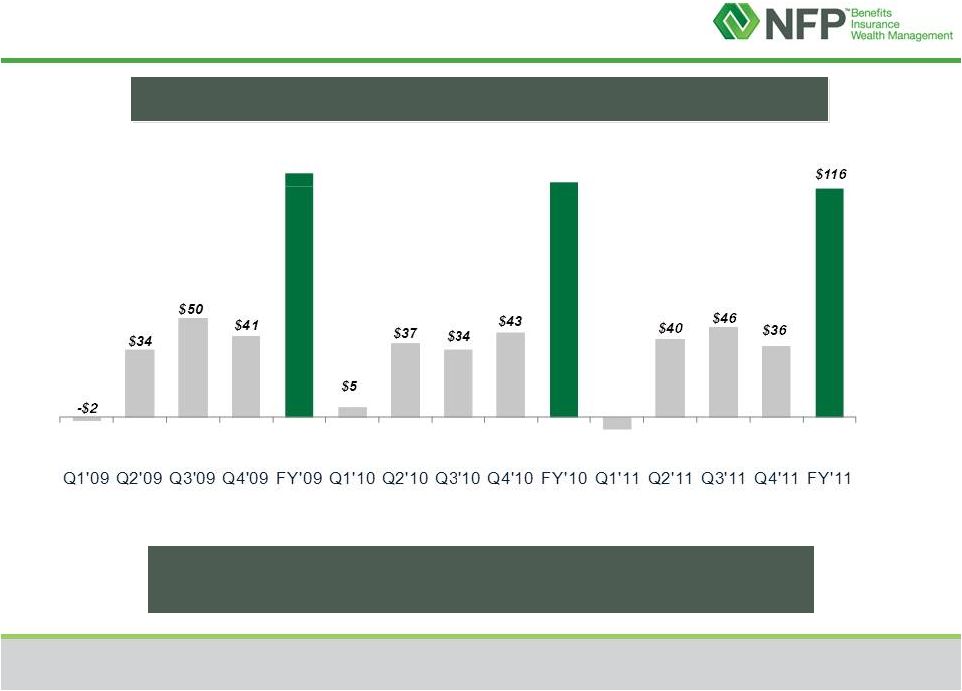 15
Operating Cash Flow
In Q1, larger payments to principals typically occur as bonus fees to
principals for prior year performance are paid
(1)
Sum of the quarters may not agree to the full year total due to rounding.
$124
($ in millions)
(1)
$119
-$6
Quarterly/Annual Operating Cash Flow |
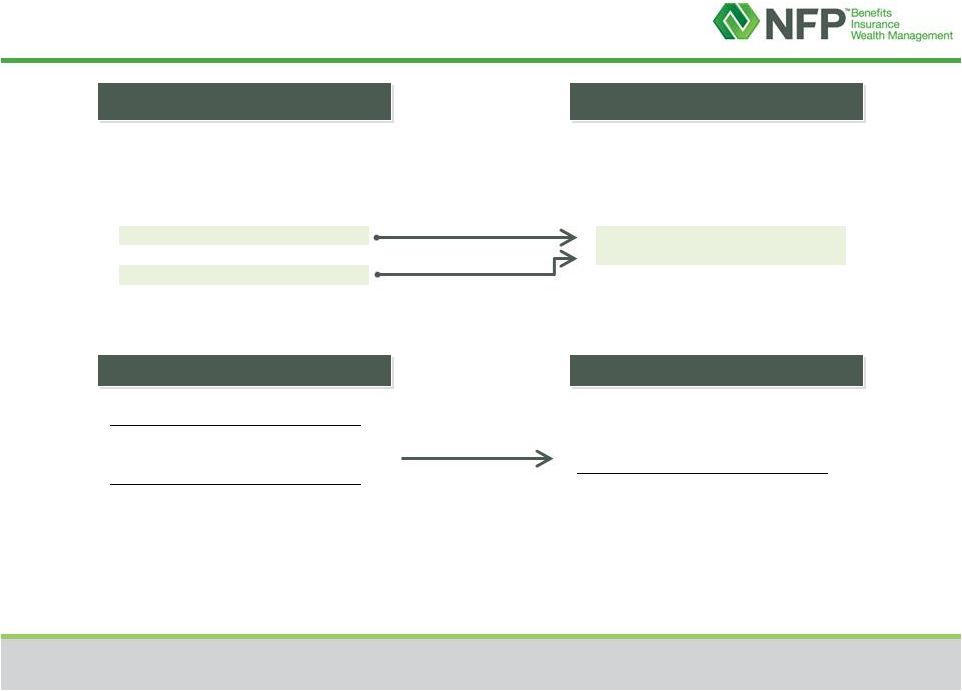  16
New Total Compensation Ratio
Operating Expenses
Commissions and fees
Compensation expense-employees
Fees to principals
Non-compensation expense
Operating Expenses
Commissions and fees
Compensation expense
Non-compensation expense
Management fees
Renamed
Compensation expense
Revenue
Management Fees
Income Before Management Fees
(Compensation expense-employees) +
(Fees to principals)
Revenue
Old Format
New Format
Total compensation ratio
Two compensation metrics |
 17
Total Compensation Ratio by Segment
Qtrly
YTD
Corporate Client Group
Corporate Client Group
Individual Client Group
49.7%
47.8%
48.6%
50.2%
50.0%
49.2%
49.0%
46.0%
47.0%
48.0%
49.0%
50.0%
51.0%
Q1'11
Q2'11
Q3'11
Q4'11
54.0%
52.3%
51.7%
50.7%
52.4%
52.3%
52.2%
49.0%
50.0%
51.0%
52.0%
53.0%
54.0%
55.0%
Q1'11
Q2'11
Q3'11
Q4'11 |
 18
2011 Balanced Capital Allocation
Balanced approach to capital allocation; maintain financial flexibility
Strategic acquisitions and sub-acquisitions
–
Approximately $50 million cash consideration
Direct capital return to shareholders –
stock buyback
Reinvestment in existing businesses
$50 million NFP stock buyback authorization completed
4Q11
Total Program as
of February 6,
2012
# of shares repurchased
1,030,593
3,992,799
Average share price
$12.80
$12.45
Total $ amount repurchased (in millions)
$13.2
$50
$ amount remaining outstanding (in millions)
$8.2
– |