Attached files
| file | filename |
|---|---|
| EX-99.3 - PRESS RELEASE - REX ENERGY CORP | d289363dex993.htm |
| 8-K - FORM 8-K - REX ENERGY CORP | d289363d8k.htm |
| EX-99.1 - INFORMATION REGARDING EXPECTED FINANCIAL RESULTS - REX ENERGY CORP | d289363dex991.htm |
 Rex
Energy Corporation | 476 Rolling Ridge Drive | State College, PA 16801 P:
(814) 278-7267 | F: (814) 278-7286 E:
InvestorRelations@RexEnergyCorp.com www.rexenergy.com
Responsible Development of America’s Energy Resources
Rex Energy
Corporate Presentation
February 2012
Exhibit 99.2 |
 2
Forward Looking Statements
Except for historical information, statements made in this presentation, including those
relating to significant potential opportunities, future earnings, resource
potential, cash flow, capital expenditures, production growth, planned number of wells
(as well as the timing of rig operations, natural gas processing plant
commissioning and operations, fracture stimulation activities and the completion of wells
and the expected dates that wells are producing hydrocarbons that are sold) and
potential ethane sales pipeline projects are forward-looking statements within the meaning of Section 27A of the Securities Act of 1933, as amended,
and Section 21E of the Securities Exchange Act of 1934, as amended. These
forward-looking statements are indicated by words such as “expected”, “expects”,
“assumes”, “anticipates” and similar words. These statements
are based on assumptions and estimates that management believes are reasonable based on
currently available information; however, management's assumptions and the company's
future performance are subject to a wide range of business risks and
uncertainties, and there is no assurance that these goals and projections can or will be
met. Any number of factors could cause actual results to differ materially from
those in the forward-looking statements, including (without limitation) the following:
adverse economic conditions in the United States and globally; the difficult and
adverse conditions in the domestic and global capital and credit markets; domestic
and global demand for oil and natural gas; sustained or further declines in the prices the company receives for oil and natural gas; the effects of
government regulation, permitting and other legal requirements; the geologic quality of
the company’s properties with regard to, among other things, the existence of
hydrocarbons in economic quantities; uncertainties about the estimates of the company’s oil and natural gas reserves; the company’s ability to
increase production and oil and natural gas income through exploration and development;
the company’s ability to successfully apply horizontal drilling techniques
and tertiary recovery methods; the number of well locations to be drilled, the cost to drill and the time frame within which they will be drilled; the
effects of adverse weather on operations; drilling and operating risks; the ability of
contractors to timely and adequately perform their drilling, construction, well
stimulation, completion and production services; the availability of equipment, such as drilling rigs and transportation pipelines; changes in the
company’s drilling plans and related budgets; the adequacy of capital resources and
liquidity including (without limitation) access to additional borrowing capacity;
and uncertainties associated with our legal proceedings and the outcome.
The company undertakes no obligation to publicly update or revise any forward-looking
statements. Further information on the company’s risks and uncertainties is
available in the company's filings with the Securities and Exchange Commission.
The company's internal estimates of reserves may be subject to revision and may be
different from estimates by the company's external reservoir engineers at year
end. Although the company believes the expectations and forecasts reflected in these and other forward-looking statements are reasonable, it can give no
assurance they will prove to have been correct. They can be affected by inaccurate
assumptions or by known or unknown risks and uncertainties. |
 Estimates
Used in This Presentation 3
Hydrocarbon Volumes
The SEC permits publicly-reporting oil and gas companies to disclose “proved
reserves” in their filings with the SEC. “Proved reserves” are estimates that
geological and engineering data demonstrate with reasonable certainty to be recoverable
in future years from known reservoirs under existing economic and operating
conditions. SEC rules also permit the disclosure of “probable” and possible” reserves. Rex Energy discloses proved reserves but does not disclose
probable or possible reserves. We may use certain broader terms such as
“resource potential,” “EUR” (estimated ultimate recovery of resources, defined
below) and other descriptions of volumes of potentially recoverable hydrocarbon resources
throughout this presentation. These broader classifications do not constitute
“reserves” as defined by the SEC and we do not attempt to distinguish these classifications from probable or possible reserves as defined by SEC
guidelines.
The company defines EUR as the cumulative oil and gas production expected to be
economically recovered from a reservoir or individual well from initial production
until the end of its useful life. Our estimates of EURs and resource potential have been prepared internally by our engineers and management
without review by independent engineers. These estimates are by their nature more
speculative than estimates of proved, probable and possible reserves and
accordingly are subject to substantially greater risk of being actually realized. We
include these estimates to demonstrate what we believe to be the potential for
future drilling and production by the company. Ultimate recoveries will be dependent upon numerous factors including actual encountered geological
conditions, the impact of future oil and gas pricing, exploration and development costs,
and our future drilling decisions and budgets based upon our future evaluation of
risk, returns and the availability of capital and, in many areas, the outcome of negotiation of drilling arrangements with holders of adjacent or
fractional interest leases. Estimates of resource potential and other figures may
change significantly as development of our resource plays provide additional data
and therefore actual quantities that may ultimately be recovered will likely differ from these estimates.
Potential Drilling Locations
Our estimates of potential drilling locations are based upon our total acreage holdings
discounted by a factor derived from our historical drilling experiences and
practices. We use assumptions for well spacing based on the area of operations, i.e. 120-acre spacing for wells in the Ohio and Butler Area Utica, 84 acre
spacing for Marcellus wells and 76 acre spacing for Upper Devonian wells in the Butler
County, Pennsylvania operations. We believe these spacing assumptions are
consistent with our expected drilling operations and those used by other exploration and production companies operating in the areas in
which we operate, as well as in other unconventional shale plays. We divide our
discounted acreage holdings by the assumed acre spacing to arrive at an estimated
number of potential drilling locations. Management uses these estimates to, among other things, evaluate our acreage holdings and to formulate
plans for drilling. Any number of factors could cause the number of wells we
actually drill to vary significantly from these estimates, including: the availability
of capital, drilling and production costs, commodity prices, availability of drilling
services and equipment, lease expirations, regulatory approvals and other factors.
Potential ASP Units
Our estimates of potential target areas, which we sometimes refer to as
“units,” for which we may use an Alkali-Surfactant-Polymer (“ASP”) flood as a method
of tertiary recovery have been prepared internally by our engineers and management. These
estimates are based on our evaluation of the sand bodies underlying certain of our
properties in the Illinois Basin. We have identified certain characteristics which we believe are desirable for potential ASP projects,
including sand bodies with no less than 60 acres of areal extent and net reservoir
thickness no less than 15 feet. We have subdivided the sand bodies to determine
potential ASP target areas, which have been modeled such that no individual target area or unit would exceed 500 acres. We include these estimates
to demonstrate what we believe to be the future potential for ASP tertiary recovery for
the company. These estimates are highly speculative in nature and ultimate
recoveries will depend on a number of factors, including the ASP technology utilized, the characteristics of the sand bodies and the reservoirs,
geological conditions encountered, our decisions regarding capital, and the impact of
future oil prices. |
 Rex Energy
Overview Market Data
•
NASDAQ: REXX
•
Common
shares
outstanding:
~44.9
million¹
•
~21% Ownership with corporate officers and directors
•
Share Price: $10.72²
•
Market
Capitalization:
$476
million²
•
52
Week
Price
Range:
$9.67
-
$18.00²
•
2011
December
Exit
Rate
of
54.6
Mmcfe/d³
•
Active operations in two basins:
•
Appalachia Basin
•
Illinois Basin
Balance
Sheet
&
Liquidity³
•
$10.7 million in cash
•
$225 million in debt
•
$80 million available on senior credit facility
•
Total bank commitments of $305 million
•
Senior Credit Facility of $255 million
•
Second Lien Facility initial commitment of $50 million
with ability to increase to $100 million
1. As of January 24, 2012, represents basic and diluted common shares outstanding
2. Data as of market close 1/27/2012
3. Unaudited financial data as of 12/31/2011
4 |
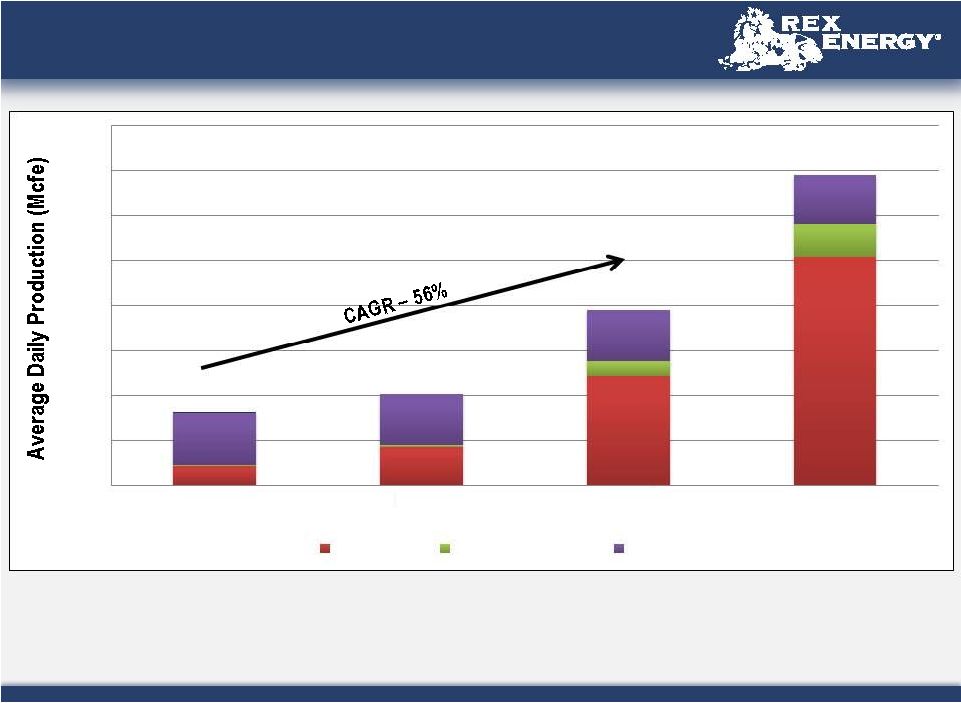 Annual
Consecutive Growth •
Compounded annual growth rate of 56% over last three years, 62% CAGR at midpoint of 2012
guidance •
Company has achieved five consecutive quarters of double digit growth since the third
quarter of 2010 5
4%
26%
92%
77%
1
1. Excludes production from discontinued operations
0
10,000
20,000
30,000
40,000
50,000
60,000
70,000
80,000
2009 (A)
2010 (A)
2011 (A)
2012 Midcase
Guidance (E)
Natural Gas
NGL & Condensate
Oil |
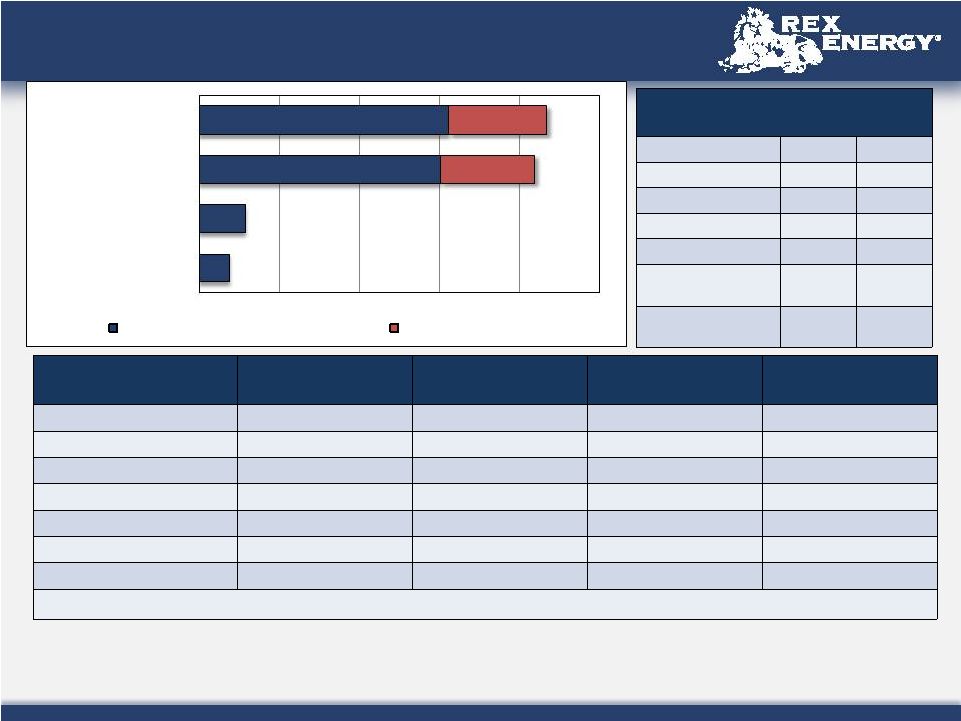
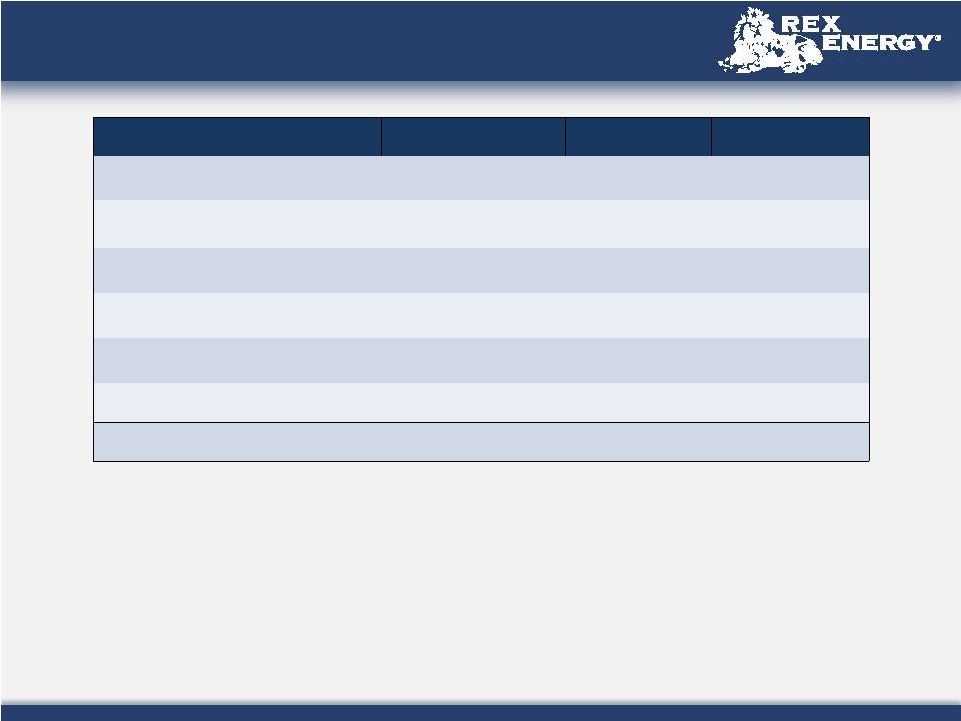
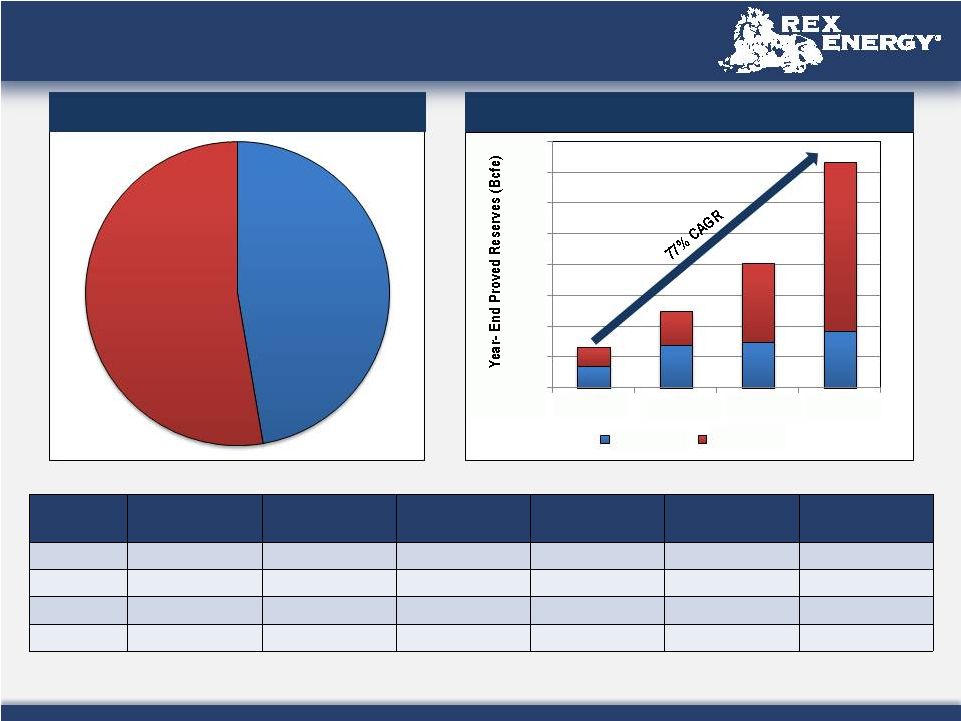 2011
Proved Reserves Year
Proved Reserves
(Bcfe)
PV-10
(Millions)
% Proved
Developed
Oil Price
Assumption
1
Natural Gas Price
Assumption
1
NGL Price
Assumption
1
2011
366.2
$ 539.6
47%
$ 92.45
$ 4.54
$ 46.34
2010
201.7
$ 269.4
42%
$ 76.03
$ 4.57
$ 31.71
2009
125.2
$ 190.5
54%
$ 57.73
$ 3.81
$ 30.27
2008
65.9
$ 84.0
62%
$ 40.50
$ 6.27
$ 19.95
6
•
Ratio of 1.27 PUD to 1 PDP in the Marcellus Shale
1. Commodity prices used were based on the 12-month unweighted arithmetic average
of the first-day-of-the-month price for 2011. For crude oil and NGL volumes, the average West Texas
Intermediate posted price of $92.71 per barrel was adjusted by lease for quality,
transportation fees and regional price differentials. For gas volumes, the average Henry Hub spot price of $4.118
per MMBTU was adjusted by lease for energy content, transportation fees and regional
price differentials. All prices were held constant throughout the life of the properties.
0
50
100
150
200
250
300
350
400
2008
2009
2010
2011
Oil & NGLs
Natural Gas
PDP
47%
PUD
53%
2011 PDP –
PUD Reserves
Proved Reserves Growth |
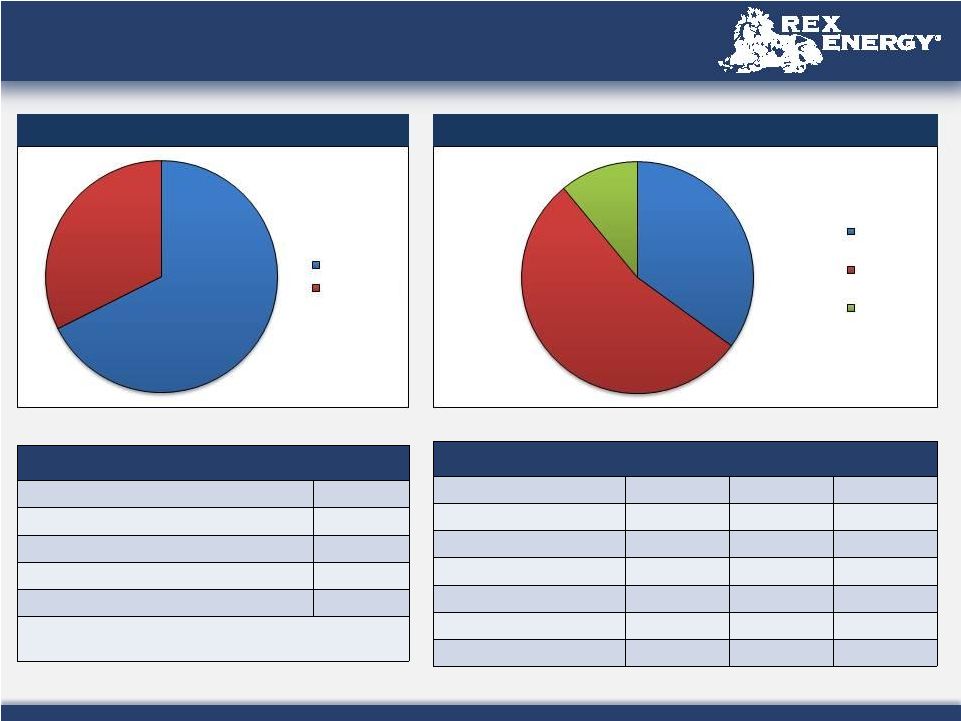
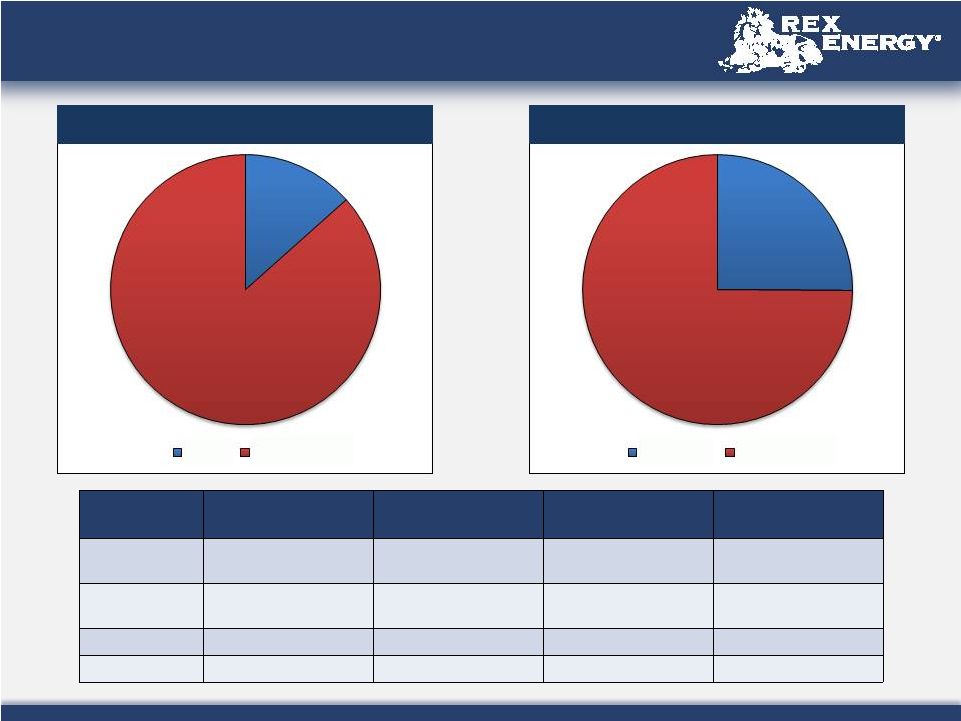 2011
Proved Reserves Area
PDP Reserves
(MMcfe)
PDNP Reserves
(MMcfe)
PUD Reserves
(MMcfe)
Total Proved
Reserves (MMcfe)
Appalachia
Conventional
4,703
-
-
4,703
Appalachia
Unconventional
111,152
8,309
192,936
312,399
Illinois Basin
48,442
646
-
49,088
Total
164,297
8,955
192,936
366,188
7
13%
87%
Illinois
Appalachia
25%
75%
Oil & NGLs
Natural Gas
2011 Reserves By Region
2011 Reserves By Commodity |
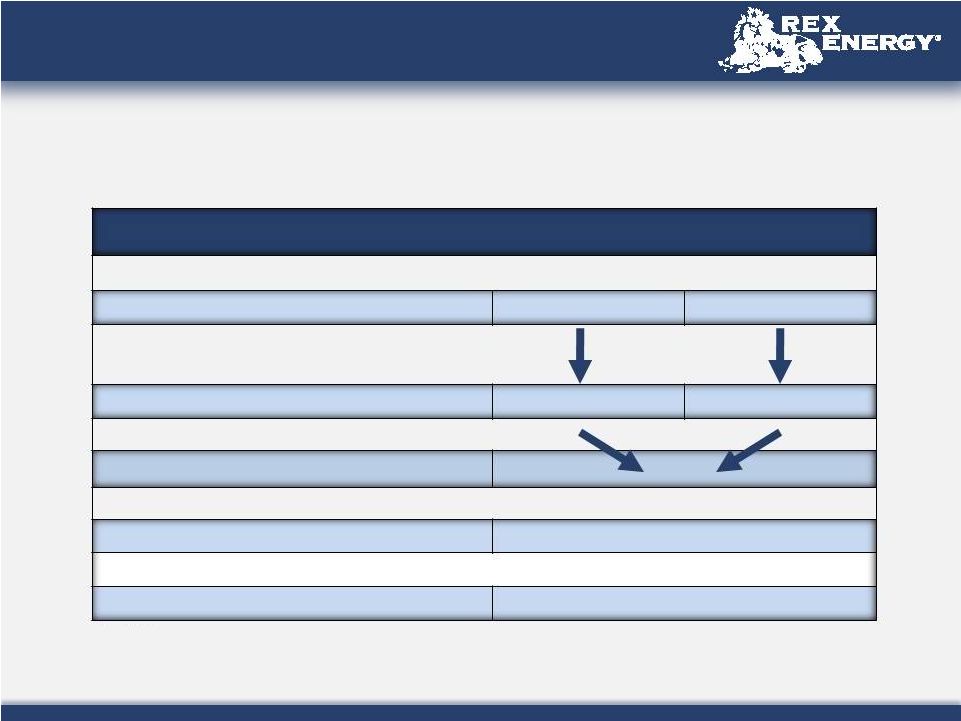
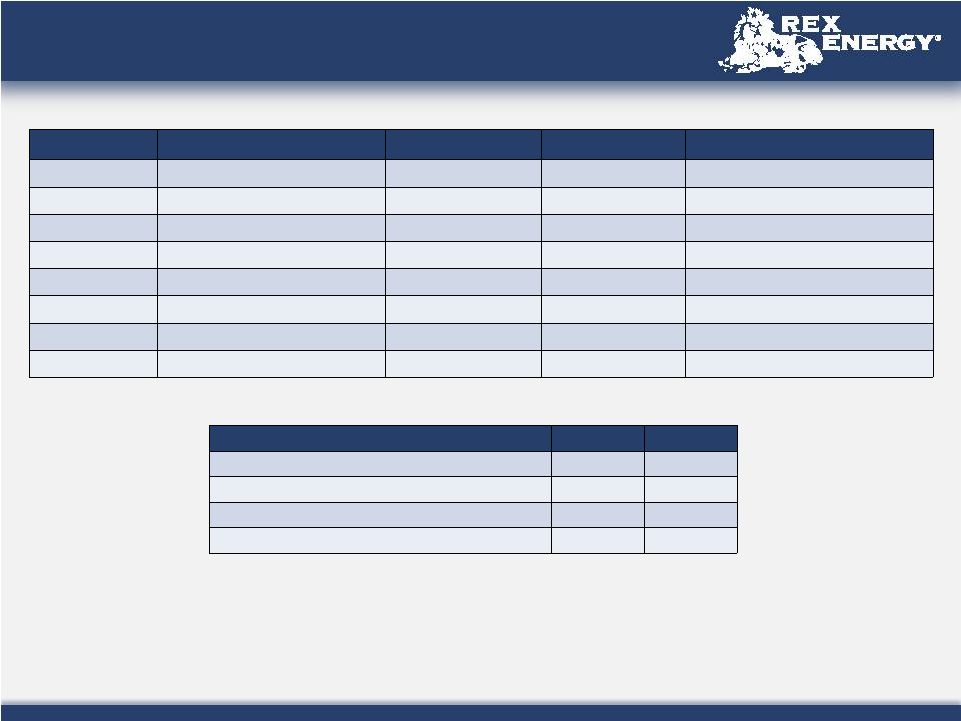
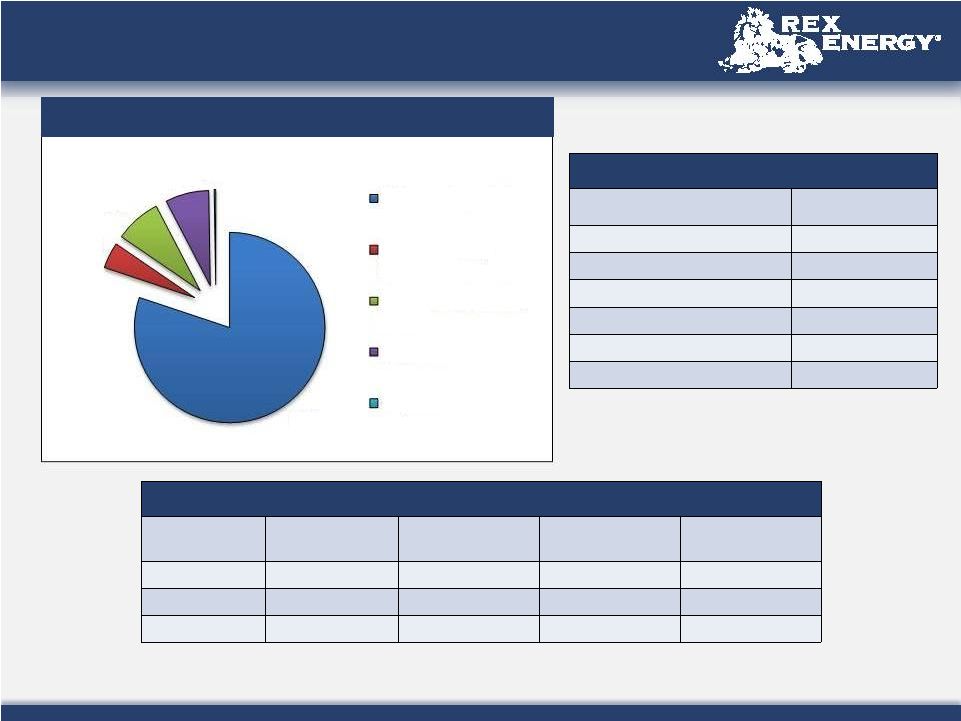 2012
Operating Capital Budget 8
Capital Budget Allocation by Activity
2012 Appalachia Drilling Program
Gross (Net)
Wells Drilled
Gross (Net) Wells
Fracture Stimulated
Gross (Net) Wells
Placed Into Service
Gross (Net) Wells
Awaiting Completion
Operated
18 (12.9)
24 (16.0)
26 (17.4)
13 (9.1)
Non-Operated
17 (6.8)
16 (6.4)
16 (6.4)
5 (2.0)
Total
35 (19.7)
40 (22.4)
42 (23.8)
18 (11.1)
2012 Capital Program Breakdown
Activity
Budget ($ in millions)
Drilling and Exploitation
152.0
Tertiary Recovery Projects
8.4
Facilities, Equipment, & HS&E
14.8
Midstream
14.0
Corporate
0.5
Total
189.7
¹
1. The company does not attempt to budget for future acquisitions of proved
and unproved oil and gas properties
80%
5%
8%
7%
0%
Drilling and Exploitation
Tertiary Recovery
Projects
Facilities, Equipment, &
HS&E
Midstream
Corporate |
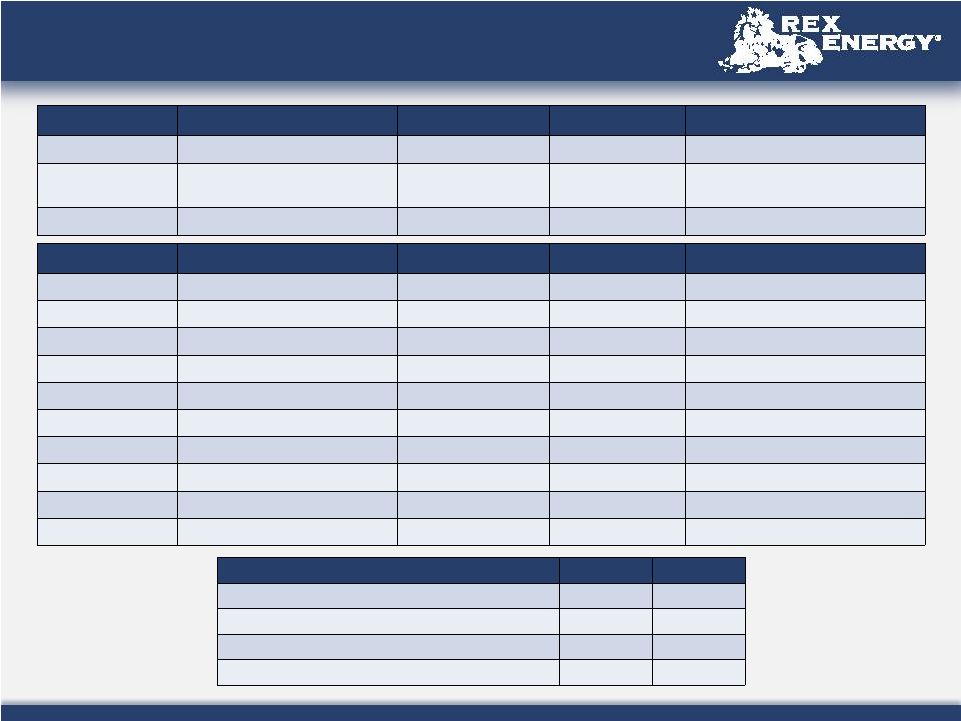
 2012
Capital Program & Liquidity Analysis 2012 Capital Budget
Activity
Appalachia
Illinois
Total
Drilling and Exploitation
150.0
2.0
152.0
Tertiary Recovery Projects
-
8.4
8.4
Facilities, Equipment, & HS&E
4.1
10.7
14.8
Midstream
14.0
-
14.0
Corporate
-
-
0.5
Total
168.1
21.1
189.7
Liquidity Sources (Uses)
Cash and Cash Equivalents¹
$ 10.7
Existing Borrowing Base Debt Available¹
$ 80.0
Estimated Proceeds From Asset Divestitures
$ 100.0
Total Sources
$ 190.7
Capital Expenditures
(189.7)
*Future 2012 cash flows, borrowing base increases and
availability under second lien facility will add to liquidity position
Capital Expenditures by Commodity
Capital Expenditures by Operatorship
9
1. Unaudited financial results as of 12/31/2011
35%
54%
11%
Dry Gas
Wet Gas and
Gas Liquids
Oil
68%
32%
Operated
Non-Operated |
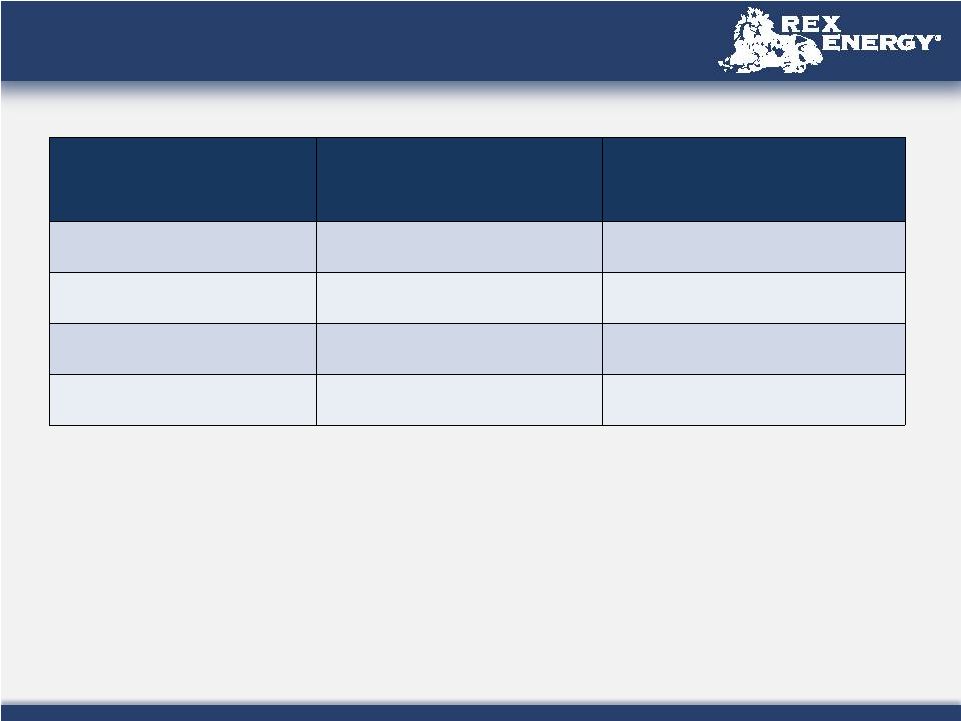 First
Quarter and Full Year 2012 Guidance First Quarter
2012
Full Year
2012
Average Daily Production
56.0 –
60.0 Mmcfe/d
66.0 –
72.0 Mmcfe/d
Lease Operating Expense
$11.0 –
12.0 million
$50.0 –
55.0 million
Cash G&A
$5.0 –
6.0 million
$20.0 –
24.0 million
Capital Expenditures
N/A
$189.7 million
10 |
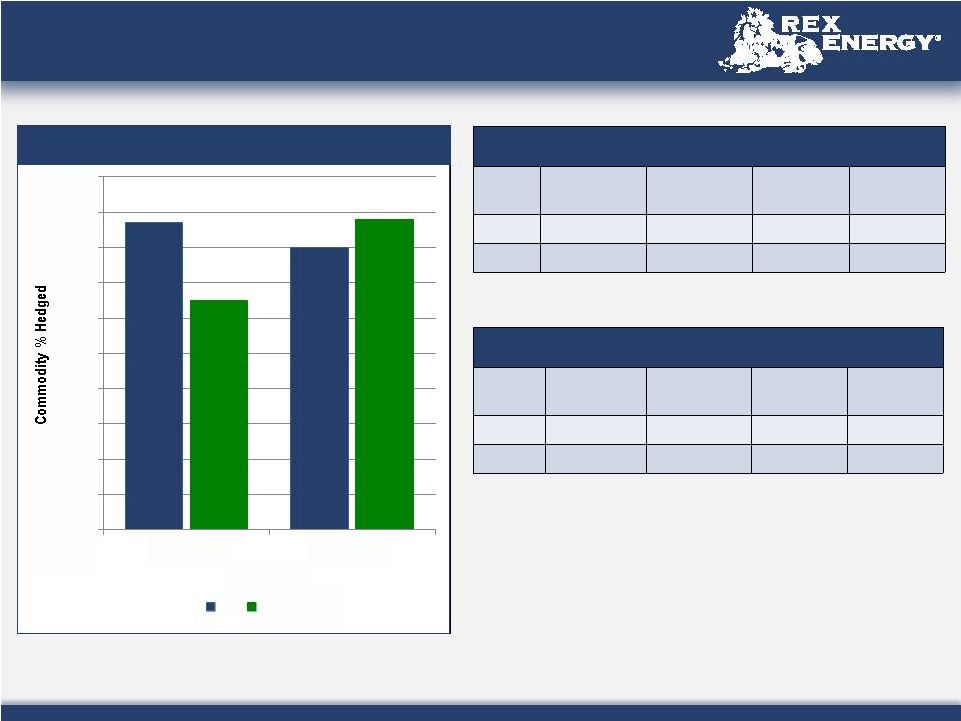 Current
Hedging Summary Natural Gas
% of Current
with Floor
% of Current
with Ceiling
Avg. Floor
Price
Avg. Ceiling
Price
2012
(1)
65%
65%
$ 4.52
$ 5.03
2013
(1)
88%
70%
$ 4.45
$ 4.74
Crude Oil
% of Current
with Floor
% of Current
with Ceiling
Avg. Floor
Price
Avg. Ceiling
Price
2012
87%
87%
$68.39
$111.08
2013
80%
80%
$72.44
$112.56
•
Percentage hedged based on 1
Quarter 2012 mid-case
guidance with standard decline
11
1. Portions of production hedged with put spreads and collar contracts with short
puts. See Appendix for more information 0%
10%
20%
30%
40%
50%
60%
70%
80%
90%
100%
2012
2013
Commodity
Oil
Natural Gas
Current Production Hedged
st |
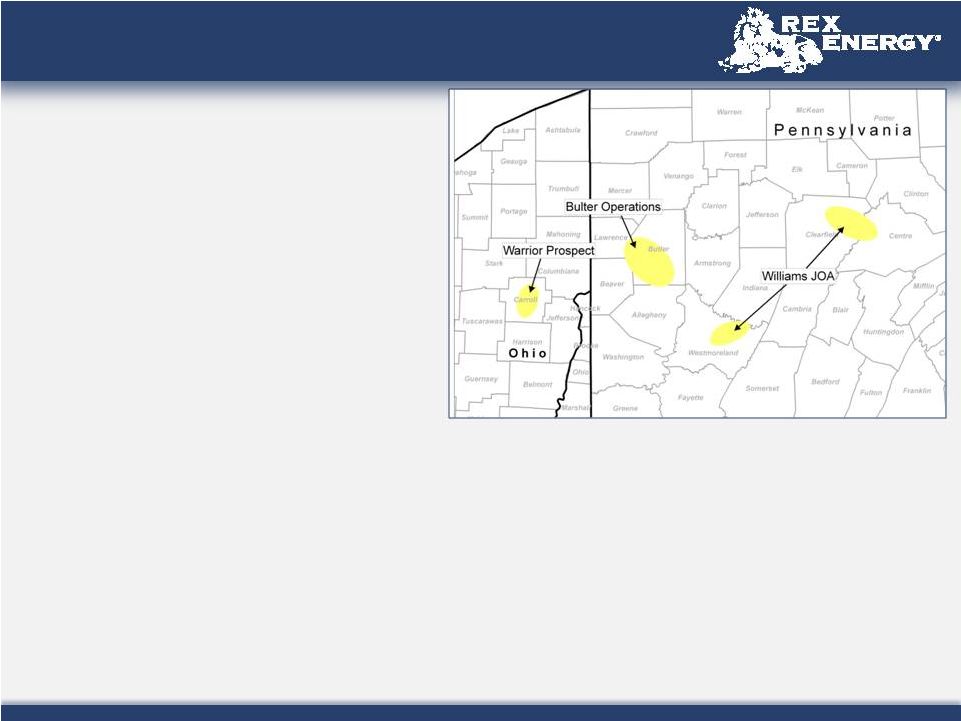
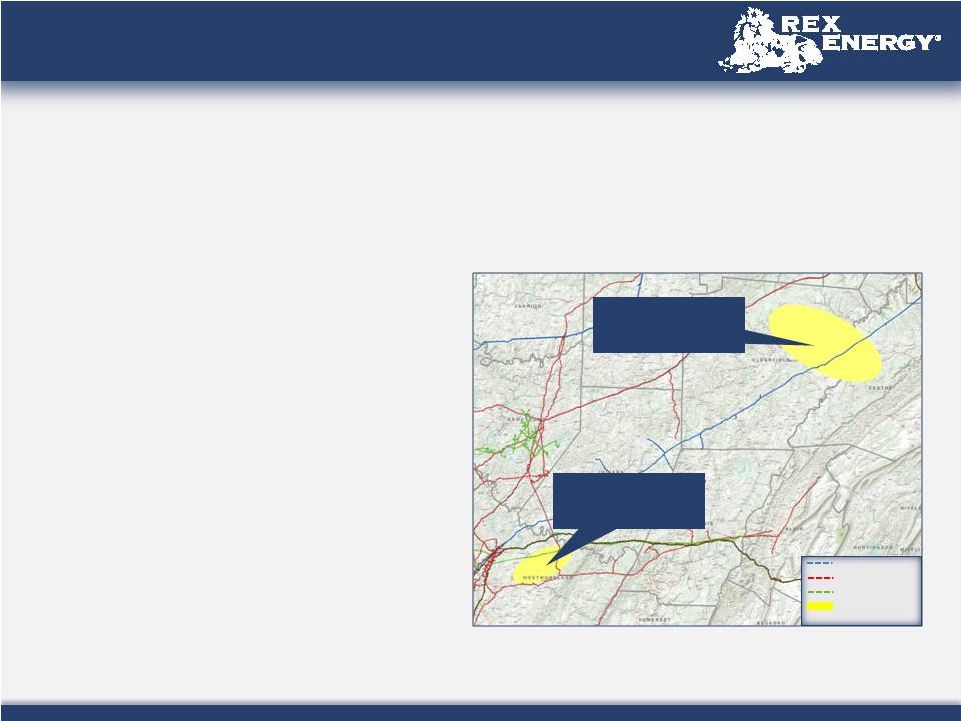
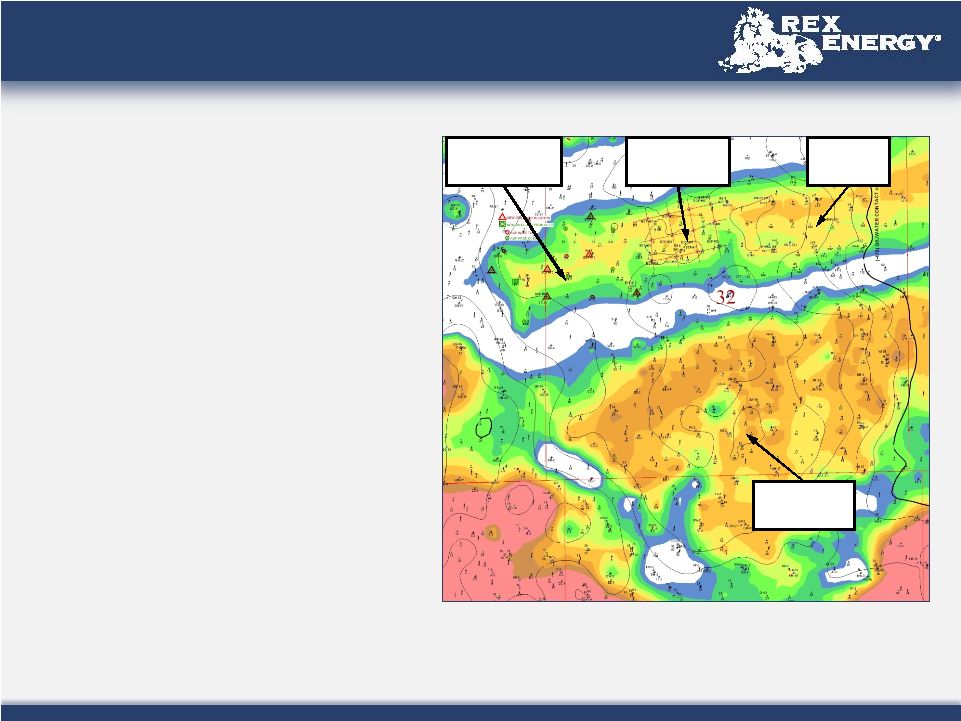
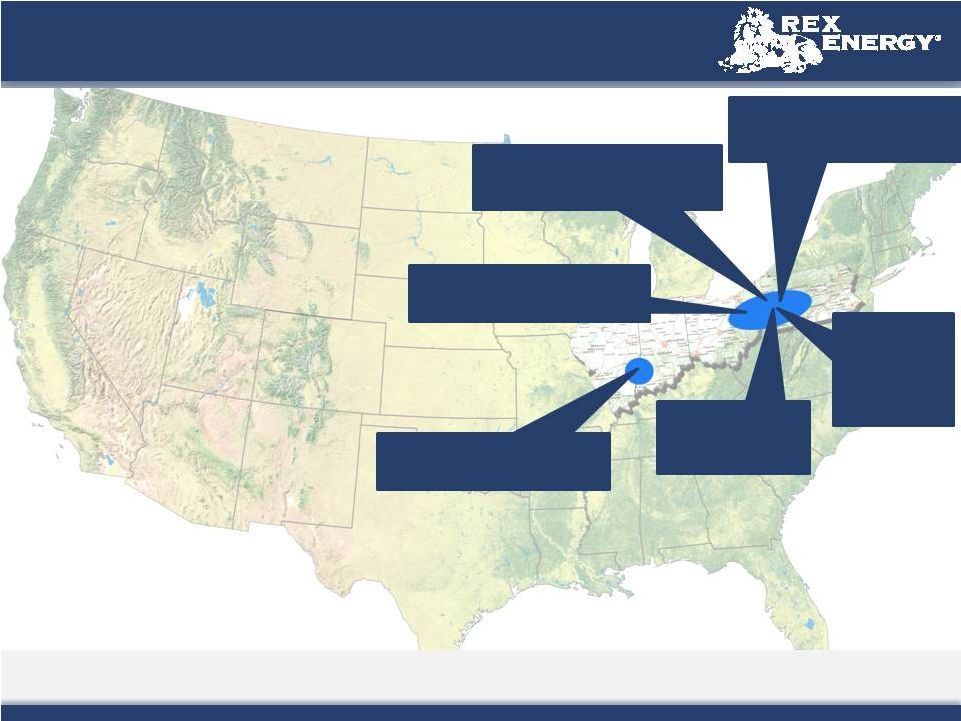 Acreage
Summary 12
•
Total
of
~90,800
gross
(~62,400
net)
acres
in
the
Utica
Shale³
•
Total of ~129,200 gross (~66,400 net) acres in the Marcellus Shale
1.
Closed
on
13,000
acres,
~2,000
acres
committed
pending
clearance
of
title
2.
Other Marcellus acreage located in Clearfield, Centre and Fayette Counties,
Pennsylvania 3.
~15,000 gross (~7,800 net) acres in areas of Warren County, Pennsylvania, which have
not been included in acreage totals Butler Operated Area
~67,200 gross
(~44,800 net) acres
Westmoreland, Centre, Clearfield
Non-Operated Area
~44,600 gross (~16,500 net) acres
Carroll County –
Warrior Prospect
~15,000 acres¹
Illinois Basin –
Lawrence Field
~13,100 gross (~13,000 net) acres
Other Marcellus
Acreage
~17,400 gross
(~5,100 net)
acres²
Other Operated Utica Acreage in
Mercer County Pennsylvania
~9,300 gross (~3,400 net) |
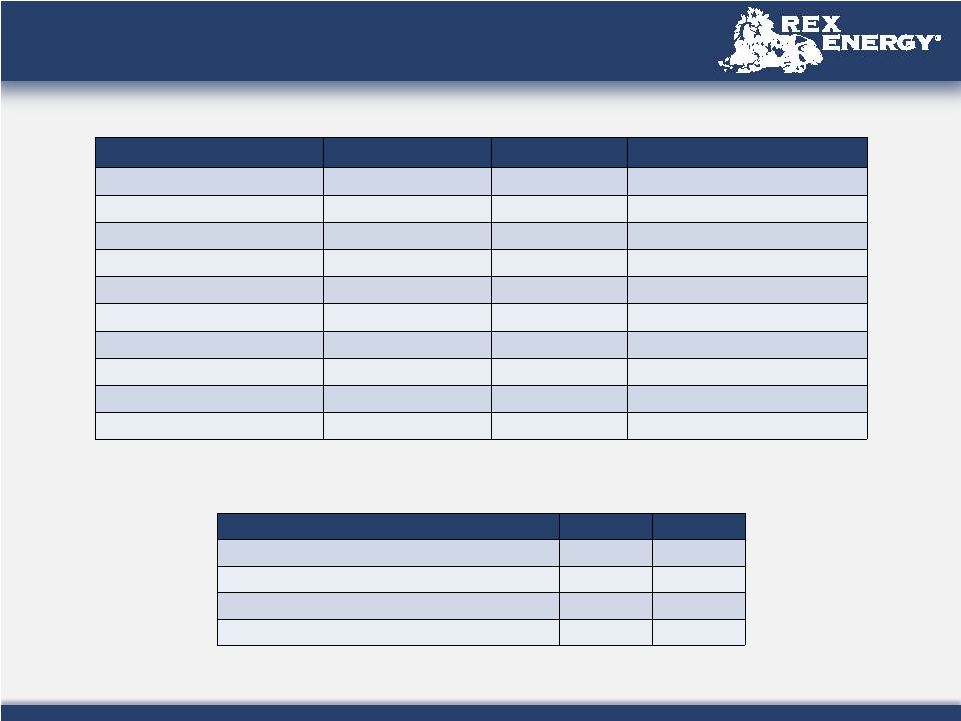
 0
500
1,000
1,500
2,000
2,500
ASP:
Oil
Warrior Prospect:
Liquids Rich Utica
Butler Marcellus:
Liquids Rich
Butler Upper Devonian:
Liquids Rich
Estimated Resource Potential (Bcfe)
Additional Ethane Recoveries²
Rex Energy Liquids-Rich Resource Potential
1
13
Assumptions
Butler Operated Area:
Marcellus
Butler Operated Area:
Upper Devonian³
Warrior Prospect:
Liquids-rich Utica³
Illinois Basin: ASP
Unproved Prospective Acreage
4
~38,700
~44,700
~15,000
5
N/A
Assumed % Drilled
6
75%
75%
80%
N/A
Well Spacing
6
84 Acres
76 Acres
120 Acres
N/A
Net Potential Well Locations
6
347
443
100
N/A
EUR
7
5.3 Bcfe
4.3 Bcfe
600 MBOE
N/A
Royalty Burdens
8
18%
18%
20%
N/A
Resource Potential
1
1,508 Bcfe
1,562 Bcfe
48,000 MBOE
31,500 MBbls
MMBOE
Bcfe
Oil & Condensate
52.6
315.7
NGLs
110.8
664.5
Natural Gas
427.8
2,566.9
Total
591.2
3,547.1
Additional Ethane
Recoveries²
200.2
1,200.9
Total with Additional
Ethane Recoveries²
791.4
4,748.0
1
Total Liquids-Rich Operating Area Resource
Potential
1
Total Liquids-rich Resource Potential ~3.5 Tcfe / ~591 MMBOE (~4.7 Tcfe / ~791
MMBOE with full ethane recoveries²) 1. See notes on “Forward Looking
Statements” and “Hydrocarbon Volumes” on pages 2&3 2.
Represents potential ethane recoveries assuming a full ethane recovery scenario; see page 16 for
estimated yield for ethane recovery
3. As of 12/31/2011, the company has drilled 1 gross (0.7 net) Upper Devonian well and
has not begun development of its Warrior Prospect Utica acreage
4. Based on net acreage position excluding acreage from proved developed and
undeveloped reserves 5. Closed on 13,000 acres, ~2,000 acres pending clearance
of title 6. See note on “Potential Drilling Locations” on page 3
7. EURs based on internal estimates, see notes on “Forward Looking
Statements” and “Hydrocarbon Volumes” on pages 2&3
8. Represents the company’s average royalty burden assumption in each designated
area, does not necessarily reflect royalties paid to landowners |
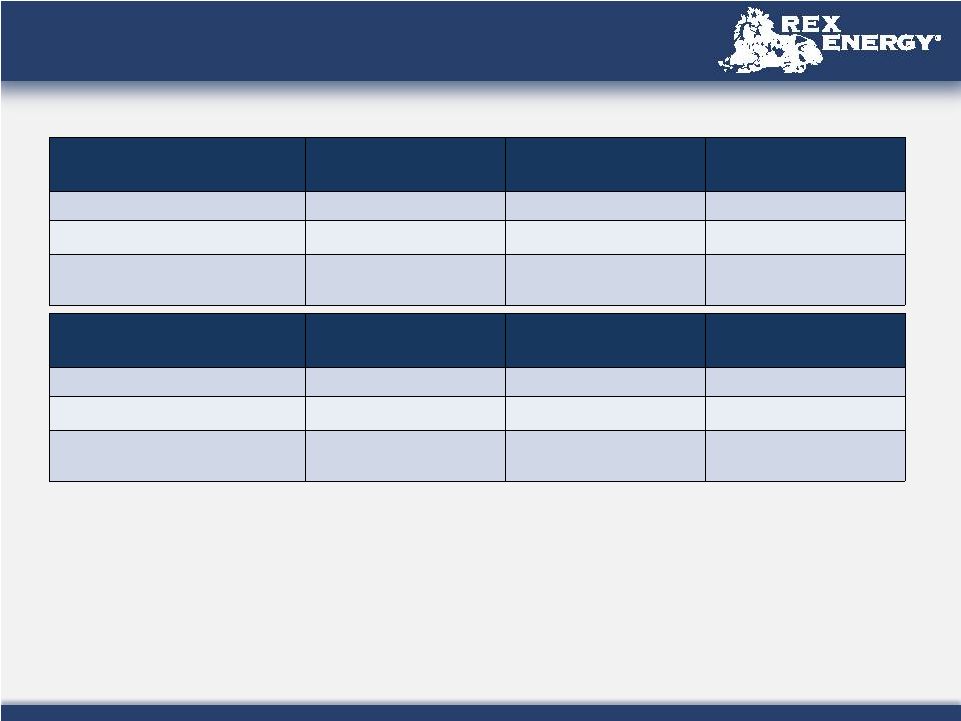 Leasing
Program Focused on Liquids-Rich Areas Year-End 2010
Year-End 2011
Change
Year-to-Year
Total Marcellus Acreage (Net)
~56,200
~66,400
+10,200
Marcellus
Liquids-Rich
Areas
(Net)
¹
~34,100
~44,800
+10,700
Percent of Marcellus Acreage
Liquids-Rich
60.7%
67.5%
+6.8%
14
Year-End 2010
Year-End 2011
Change
Year-to-Year
Total Utica Acreage (Net)
~37,500
2
~62,400
2
+24,900
Utica
Liquids-Rich
Areas
(Net)
¹
--
~15,000
3
+15,000
Percent of Utica Acreage
Liquids-Rich
0%
24.0%
+24.0%
1.
Based on the company’s internal estimates of resource potential; see notes on
“Forward Looking Statements” and “Hydrocarbon Volumes” on pages 2&3
2.
~3,400 net acres in Mercer County, Pennsylvania are undetermined as to liquids
content
3.
Closed on 13,000 acres, ~2,000 acres committed pending clearance of title |
 Appalachia Overview
Butler Area (Operated)
•
~67,200 gross (~44,800 net) acres
•
Joint Venture with Sumitomo in Butler County
•
70% Rex / 30% Sumitomo
•
Butler Midstream Joint Venture
•
•
15
Carroll County, Ohio –
Warrior Prospect
•
Commitments on ~15,000 acres in liquids rich
window of the Utica Shale
•
Actively leasing in the area
•
Drilling operations expected to begin in 2012
Other Appalachia Acreage
Westmoreland, Centre, and Clearfield Counties
(Non Operated)
•
~44,600 gross (~16,500 net) acres
•
Joint Venture among Williams, Rex, and Sumitomo
•
50% Williams / 40% Rex / 10% Sumitomo
•
JV includes interest in gathering and transportation
1.
Currently exploring options to monetize Butler midstream assets
2.
~44,100 acres believed to be prospective for all three drilling horizons
2
1
•
~26,700 gross (~8,600 net) acres in areas of
Clearfield, Centre, Mercer and Fayette counties
•
Marcellus Shale
•
Utica Shale
•
Upper Devonian Shale
•
60% Stonehenge / 28% Rex / 12% Sumitomo
50 MMcf/d Bluestone Cryogenic Plant expected to
be commissioned May 2012
Access to three drilling horizons |
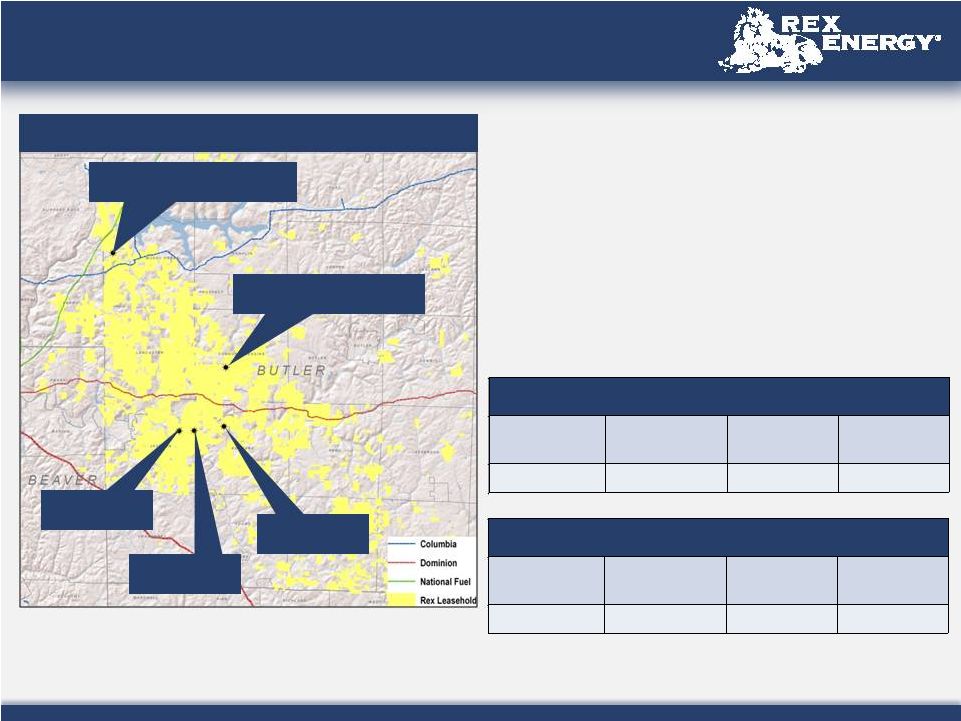 •
Consolidated acreage position of ~67,200 gross
(~44,800 net) acres
•
Allows for minimal rig movement
•
Decreases in drilling time
•
Maximizes unitized acreage
•
Marcellus Shale: increasing EUR from previous range
•
Upper Devonian / Burkett Shale: similar in composition to
Marcellus Shale
•
Utica Shale: encouraging test well results
Butler Operated Area
16
1.
~44,100
net
acres
believed
to
be
prospective
for
all
three
drilling
horizons
2.
Includes 2 wells completed and awaiting pipeline
3.
Includes 3 Utica Shale wells in Butler County
2011 Butler County Drilling Program Well Counts
Wells Drilled
Fracture
Stimulated
Placed in
Service
Awaiting
Completion
2
31
19
21
21
2012 Butler County Drilling Program Well Counts
Wells Drilled
Fracture
Stimulated
Placed in
Service
Awaiting
Completion
15
21
23
13
Cheeseman #1 –
Utica Shale Test
9.2 MMcf/d 24-Hour Test Rate
Gilliland #11HB –
Burkett Shale Test
3.1 Mmcfe/d 5-day test rate
Talarico Pad
Mmcfe/d
Drushel Pad
Butler Operated Area
•
Three potential drilling horizons
Behm Pad
5-day rate of 6.6
5-day rate of 4.4
Mmcfe/d
5-day rate of 3.8
Mmcfe/d
1
3 |
 Butler
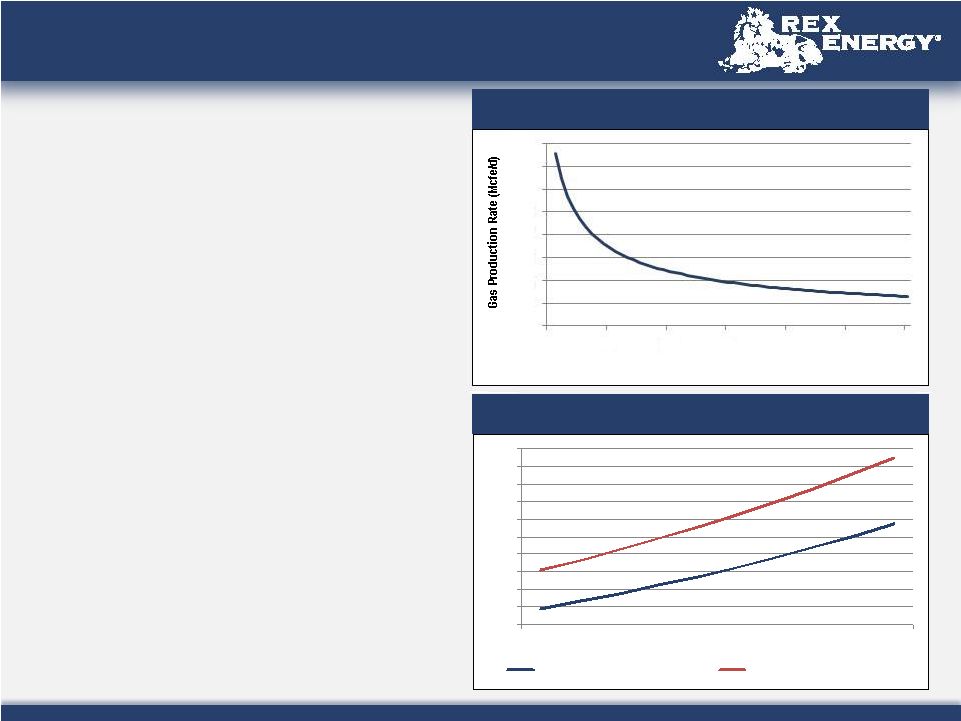
County Marcellus Economics 17
Before Tax IRR
Butler County Wet Gas Type Curve
Butler Area (Operated) Assumptions
•
Well costs of $5.3 million per well
•
Lateral length of 3,500 ft.
•
30-Day average rate of 3.8 MMcfe/d
•
Reference Oil Price: $90.00
•
EUR
of
5.3
Bcfe
per
well
•
EUR range increase 20% over 2010 EUR
with only 13% increase in well cost
•
NGL yield with current Ethane recovery of 1.64
gallons
per
Mcf
(39
Bbls
per
MMcf)
•
Butler Area type curve based on current ethane
recovery and NGL yield
•
NGL yield with full Ethane recovery of
approximately 4.5 gallons per Mcf (107 Bbls per
MMcf)
1.
See note on “Hydrocarbon Volumes”
on page 3
2.
Assumption
used
for
“Current
Ethane
Recovery”
projections
3.
Assumption
used
for
“Full
Ethane
Recovery”
projections
0%
10%
20%
30%
40%
50%
60%
70%
80%
90%
100%
$2.50
$3.00
$3.50
$4.00
$4.50
$5.00
$5.50
$6.00
$6.50
$7.00
IRR: Current Ethane Recovery
IRR: Full Ethane Recovery
2
3
0
500
1,000
1,500
2,000
2,500
3,000
3,500
4,000
0
10
20
30
40
50
60
Production Month
1
2
3 |
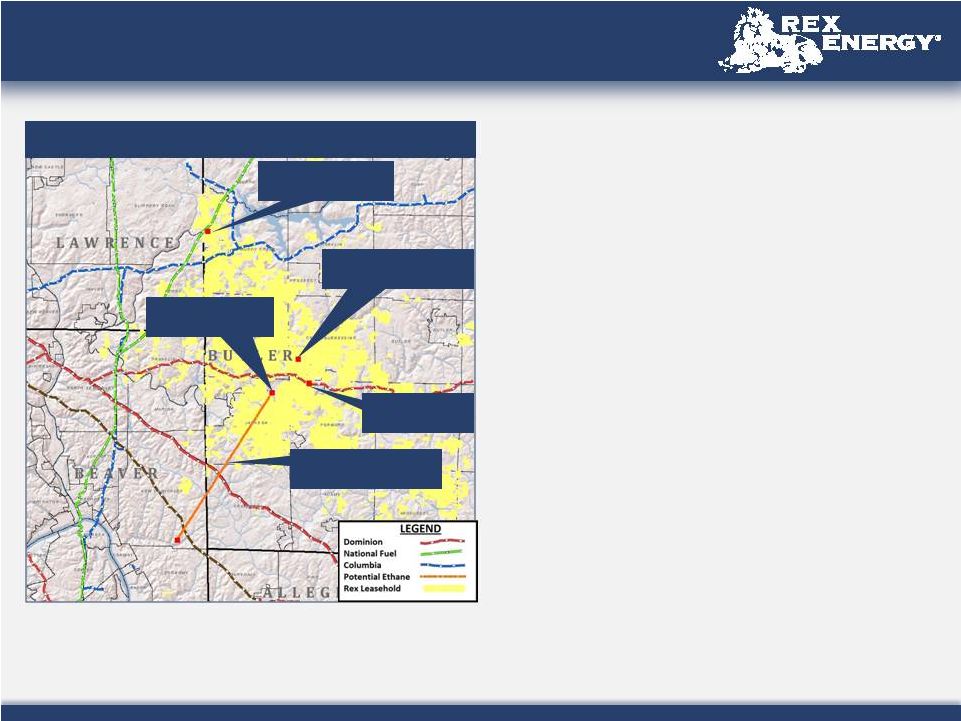 •
Firm transportation of 85.0 gross MMcf/d
•
25.0 gross MMcf/d available March 2012
•
Remaining 60.0 gross MMcf/d available January 2013
•
Sarsen Plant
•
Current processing capacity of 34 MMcf/d
•
Capacity increase to 40 MMcf/d with commissioning of
the Voll compressor station expected in February 2012
•
Bluestone Plant
•
50 MMcf/d processing capacity design
•
Expected commissioning in May 2012
•
Location for third cryogenic processing plant being
determined
•
Cheeseman #1H Utica Shale test well expected sales
February 2012
•
Currently exploring options to monetize Butler midstream
assets
•
Regional projects entering southwestern Pennsylvania
have been proposed to expand ethane alternatives¹
Butler Area Midstream & Infrastructure
18
Voll Compressor Station
Sarsen Cryogenic
Processing Plant
Bluestone Cryogenic
Processing Plant
Butler Operated Area
Cheeseman #1 –
Pipeline tap into NFG
Projected 12-Mile Ethane
Pipeline Connection ¹
1.
Pipeline route shown for illustrative purposes only. Actual pipeline route,
design, construction and capacity
may
vary
from
illustration
shown.
See
note
on
“Forward
Looking
Statements”
on
page 2.
The company can give no assurance that proposed ethane projects will be completed or
that ethane markets will expand as currently projected
1
•
Rex Energy targeting 2014 for potential expanded
ethane sales |
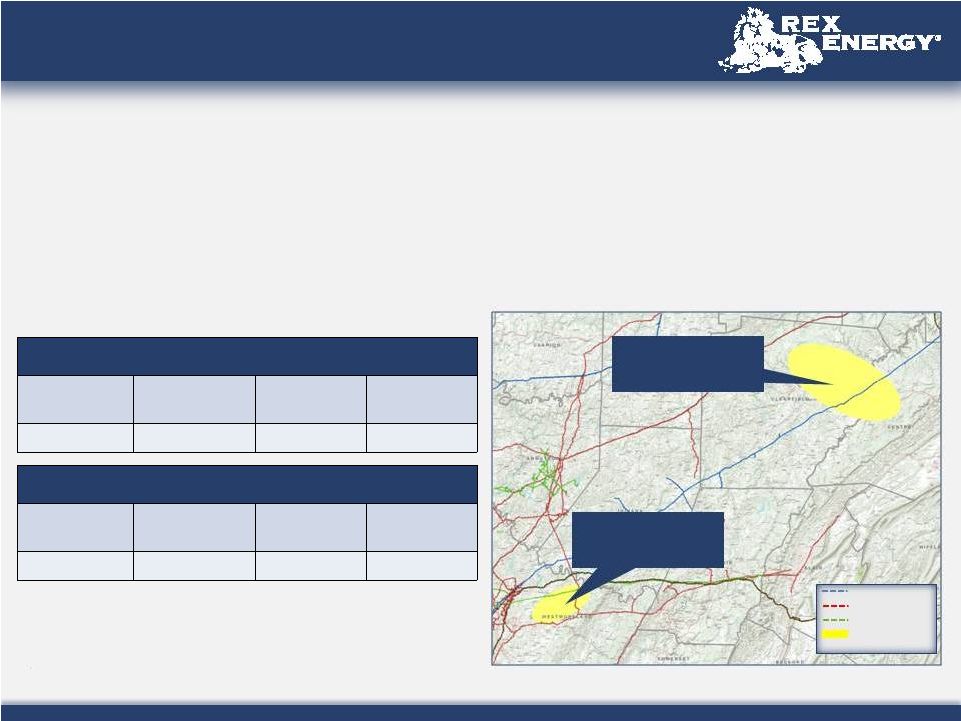 Marcellus
Non-Operated Overview Westmoreland, Clearfield and Centre Counties, PA
•
Sizeable acreage position with ~44,600 gross (~16,500 net) acres¹
•
34 Wells producing in Westmoreland County
•
4 Wells producing in Centre County
•
4 Wells producing in Clearfield County
•
47.0 gross (15.8 Net) MMcf/d 2011 December Exit Rate in Westmoreland County
•
13.3 gross (4.5 Net) MMcf/d 2011 December Exit Rate in Clearfield and Centre County
1.
Includes non-operated area acreage only
Columbia
Dominion
Equitrans
REX Leasehold
Areas
Clearfield –
Centre
County
Non-Operated Area
2011 Non-Operated Drilling Program Well Counts
Wells Drilled
Fracture
Stimulated
Placed in
Service
Awaiting
Completion
26
29
30
3
2012 Non-Operated Drilling Program Well Counts
Wells Drilled
Fracture
Stimulated
Placed in
Service
Awaiting
Completion
17
16
16
5
Westmoreland County
Non-Operated Area
19 |
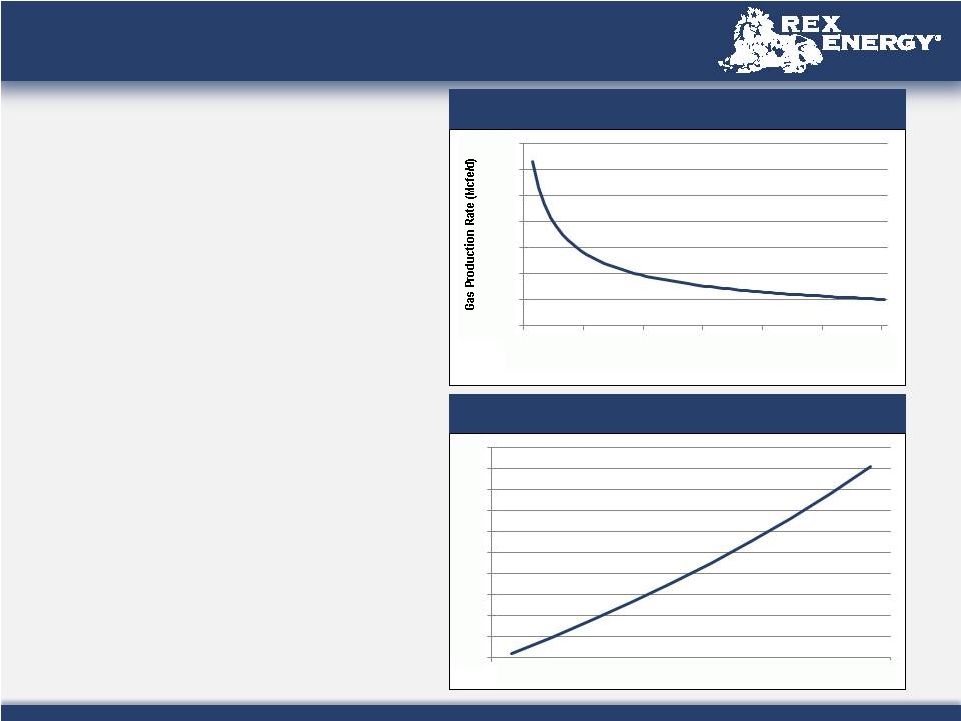 Westmoreland County Marcellus Economics
20
Westmoreland County (Non-Operated)
Assumptions
•
Well costs of $5.8 million per well
•
Lateral length of 3,500 ft.
•
30-Day average rate of 3.2 MMcf/d
•
EUR of 4.2 Bcf per well
•
EUR increase 40% over 2010 EUR with only
23% increase in well cost
•
Seven recently completed laterals recorded an
unconstrained 30-day average rate of 4.3 MMcf/d
0
500
1,000
1,500
2,000
2,500
3,000
3,500
0
10
20
30
40
50
60
Production Month
0%
5%
10%
15%
20%
25%
30%
35%
40%
45%
50%
$2.50
$3.00
$3.50
$4.00
$4.50
$5.00
$5.50
$6.00
$6.50
$7.00
Westmoreland County Dry Gas Type Curve
Before Tax IRR |
 Non-Operated Midstream and Infrastructure
Westmoreland County, PA
•
17.0 gross MMcf/d capacity through Ecker Station tap
into Dominion line
•
35.0 gross MMcf/d capacity through high pressure
delivery system into Peoples line
•
29.0 gross MMcf/d capacity through Salem Beagle
Club station into Equitable gas line
Clearfield and Centre Counties, PA
•
7.0 gross MMcf/d firm capacity with interruptible
takeaway into Columbia gas line
21
Westmoreland County
Non-Operated Area
Clearfield –
Centre
County
Non-Operated Area
Columbia
Dominion
Equitrans
REX Leasehold
Areas |
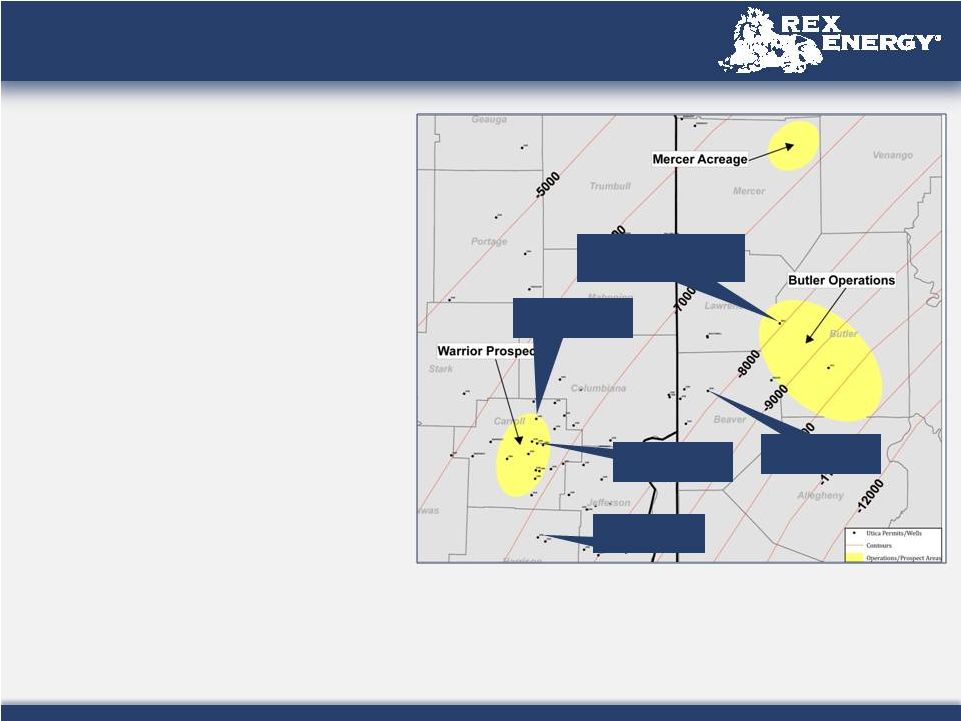 ~ 90,800
gross (~62,400 net) acres in the Utica Shale¹
•
Butler County Operations ~66,400 gross
(~44,100 net) acres
•
Successful well test in 2011 in Butler
County
-
Cheeseman
#1H
-
9.2
MMcf/d
24 hour test rate (dry gas)
•
Ohio Warrior Prospect 15,000 acres²
•
Other operated Utica acreage 9,300 gross
(3,400 net) acres
•
Expecting to drill 6 Utica Shale wells in 2012
22
CHK Buell 10-11-5
8H -3.0 Mboe/d
CHK Mangun 22-15-5
8H -1.5 Mboe/d
CHK Neider 10-14-5
3H -1.6 Mboe/d
Rex Energy Cheeseman #1H –
9.2 MMcf/d Dry Gas
24-Hour Test Rate
CHK Thompson 3H –
6.4 MMcf/d Dry Gas
Utica Shale Overview
•
Drill and complete 3 wells in the Warrior
Prospect
•
Drill 3 wells in the Butler County
operated area (1 completed and placed
in service)
1.
~15,000 gross (~7,800 net) acres in areas of Warren County, Pennsylvania which have not
been included in acreage totals
2.
Closed on 13,000 acres, ~2,000 acres committed pending clearance of title |
 Ohio
Utica – Warrior Prospect
~ 15,000 acres in the Utica Shale¹
•
Close access to infrastructure and pipelines
•
Acreage within liquids rich window of the
Utica Shale
•
100 Potential drilling locations²
•
Drilling and development expected to begin in
2012
•
Secured 15 MMcf/d of firm wet gas processing
capacity for Ohio Utica development
•
Processing at Dominion Natrium Facility
after expected plant commissioning in
December 2012, interim processing at
Dominion Hastings Plant
•
Actively leasing in the area
23
CHK Buell 10-11-5
8H -3.0 Mboe/d
CHK Mangun 22-15-5
8H -1.5 Mboe/d
CHK Neider 10-14-5
3H -1.6 Mboe/d
1.
Closed
on
13,000
acres,
~2,000
acres
committed
pending
clearance
of
title;
the
company
refers
to
this
acreage
as
its
“Warrior
Prospect”
2.
See
note
on
“Potential
Drilling
Locations”
on
page
3 |
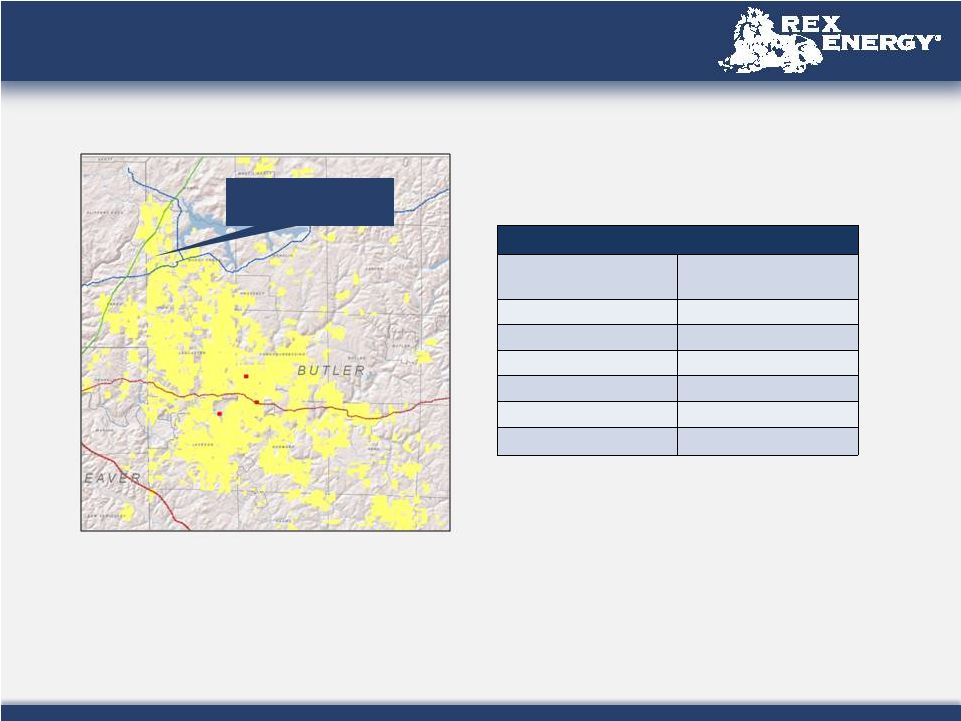 Butler
Area Utica Shale Resource Potential 1
24
Butler Operated Area: Utica Shale –
Dry Gas
Unproved Prospective
Acreage
²
~43,800
Assumed
%
Drilled³
30%
Well
Spacing³
120 Acres
Net Potential Well Locations³
110
EUR
4
4.5 Bcfe
Royalty Burdens
5
18%
Resource
Potential
¹
405.9 Bcfe
1. See notes on “Forward Looking Statements”
and “Hydrocarbon Volumes”
on pages 2&3
2. Based on net acreage position excluding acreage from proved developed and
undeveloped reserves that the company believes to be prospective for
Utica
Shale
development.
Actual
future
development
of
this
acreage
may
vary.
See
notes
on
“Forward
Looking
Statements”
and
“Hydrocarbon
Volumes”
on pages 2&3. Does not include ~3,400 net acres in Mercer County,
Pennsylvania 3. See
note
on
“Potential
Drilling
Locations”
on
page
3;
drilling
assumptions
based
on
what
the
company
believes
can
be
drilled
economically
under
the current commodity price environment
4. Current EUR assumption based on internal estimates using a 4.3 MMcf/d 30-day
estimated average production rate; see notes on “Forward Looking
Statements” and “Hydrocarbon Volumes”
on
pages
2&3
5.
Represents
the
company’s
average
royalty
burden
assumption
in
the
designated
area,
does
not
necessarily
reflect
royalties
paid
to
landowners
Rex Energy Cheeseman #1H –
9.2 MMcf/d Dry Gas
24-Hour Test Rate |
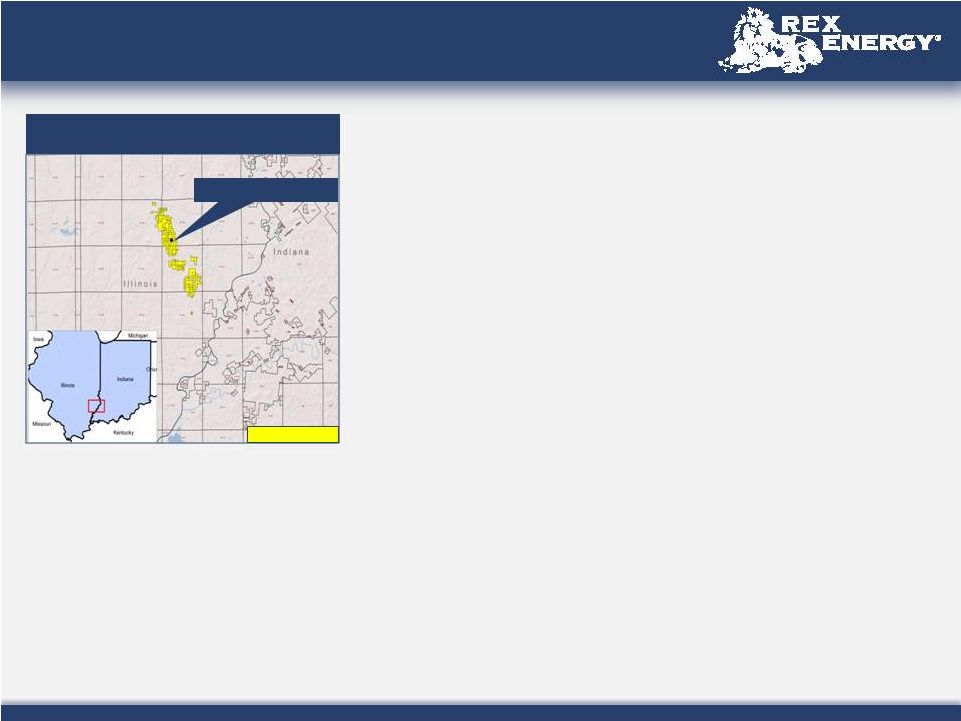 Lawrence
Field ASP Overview Illinois Basin
Middagh Unit, ASP Project
25
REX Acreage
~13,100 gross (13,000 net) acres in Lawrence Field
•
Estimated 1 billion barrels of original-oil-in-place (OOIP)
•
Field has produced 400 MMBbls since 1906
•
Waterflooded
since
the
1950’s
•
Two successful surfactant-polymer flood pilots completed by Marathon
with 15-20% of OOIP recovered
•
Field currently produces ~1,600 gross (1,250 net) barrels per day under
waterflood
ASP Project Summary
•
ASP stands for Alkali-Surfactant-Polymer flood
•
Alkali-Surfactant mix reduces interfacial tension allowing remaining oil to flow
easier through the formation
•
Polymer
improves
sweep
efficiency
by
forcing
fluid
into
parts
of
the
field
not
effectively swept by the waterflood
•
Field ASP injection plant constructed in 2008
•
Capacity design of 72,000 Bbls per day
•
15 Acre Middagh Unit Pilot used to confirm commerciality of ASP Tertiary
Recovery in the Lawrence Field:
•
Pilot flood initiated in August 2010
•
Initial oil response seen on March 2011
•
Peak production rates observed in September 2011
•
Proved reserves are booked as of 12/31/2011 at 13% of Pore Volume
|
 ASP
Economics 26
Delta Unit ASP Economics
1.
Resource
potential
and
pore
volume
recovery
assumptions
based
on
full
development
program.
Individual
ASP
unit
results
may
vary
significantly.
See
note
on
“Hydrocarbon
Volumes”
on
page
3
2.
See
note
on
“Potential
ASP
Units”
on
page
3
3.
Based
on
company
estimates
and
projections
to
date.
See
note
on
“Hydrocarbon
Volumes”
on
page
3
Resource Potential Range Confirmed
•
Proved reserve bookings at 13% of pore volume
recovery confirming mid-point resource potential
range of ~31.5 MMBbls (net)
•
North and Central Lawrence Units reviewed for
ASP potential in Bridgeport and Cypress
formations by NSAI
•
27 ASP targets identified across both units
combined²
•
Estimated 76% of North and Central Lawrence
acreage prospective for ASP flooding, with a
further ~1,900 acres of South Lawrence unit to
undergo further review
Delta Unit Conceptual Economics³
•
$5MM of Capex in 2012 and $21MM in 2013
•
Proved reserve bookings at 13% of Pore Volume
equate to ~20% IRR at $100/Bbl NYMEX prices
•
All reserves recovered in first 5 years
•
Discounted Return on Investment: ~1.25
•
Full-cycle F&D Cost ~$30/Bbl
Resource
Potential: North & Central Lawrence Units¹
Low Case
High
Case
Bridgeport Sand Pore Volume
182.7 MMbbl
Cypress Sand Pore Volume
128.3 MMbbl
Royalties
22%
Recovery
Potential (%PV)
8%
20%
Total ASP Upside
Potential (Net)
19.4 MMbbl
48.5 MMbbl
0
5
10
15
20
25
30
35
40
45
50
9
10
11
12
13
14
15
16
17
18
19
20
Pore Volume Recovery % |
 27
Middagh Pilot
15 Acres
Griggs
72 Acres
Perkins-Smith
58 Acres
Delta Unit
351 Acres
Lawrence Field ASP Update
•
Middagh Pilot:
•
Production increased from 16 BOPD and has maintained a
range of 65 –
75 gross BOPD over the last 90 days; peak
production was seen at 100+ BOPD
•
Oil cuts in the Pilot increased from
1.0% to ~12.0% in total unit, with individual wells
experiencing oil cuts above 20%
•
Third party engineer firm NSAI booked PDP reserves as of
12/31/2011
•
Perkins-Smith Unit Pilot Expansion:
•
Third party engineer firm NSAI booked PDNP reserves as of
12/31/2011
•
All drilling and infrastructure complete
•
Initial brine injection underway
•
Plan to commence ASP injection by 2
nd
quarter of 2012
•
Initial
project
response
expected
by
2
nd
quarter
of
2013;
expected
peak
response
of
175-250
gross
BOPD
by
4
th
quarter of 2013
•
Delta Unit Full Scale Expansion:
•
Core studies and geologic mapping underway
•
Drilling of additional pattern wells planned for 2Q & 3Q-2012
•
Injection line tie-in targeted for 3Q-2012
•
Expect to initiate tracer injection survey work in 3Q-2012
•
Planning to begin ASP injection in 2Q-2013
•
Initial production response anticipated in 2014
•
ASP Recovery Incremental Production Impact:
•
Potential to double current field production in 2015 |
 Responsible Development of America’s Energy Resources
Appendix |
 Assumed
Net Asset Value ($ in millions)
Description
Scenario A
Scenario B
2011 Year-End Proved Reserves
366.2 Bcfe
$536.5
(NYMEX PV-10¹)
$ 539.6
(SEC PV-10²)
Warrior Prospect (Liquids-rich Utica)
-
Net Acreage
15,000
Net
Acres³
$90.0
(@ $6,000 per acre
4
)
$225.0
(@ $15,000 per acre
4
)
Butler Marcellus -
Resource Potential
5
1,508.0 Bcfe Net
6
$452.4
(@ $0.30/Mcfe
7
)
$904.8
(@ $0.60/Mcfe
7
)
ASP -
Resource Potential
5
31.5 MMBbls Net
6
$31.5
(@ $1.00/Bbl
7
)
$94.5
(@ $3.00/Bbl
7
)
Other
Midstream and Rockies
Assets
8
$ 90.0
$ 110.0
Less Long-term Debt
9
As of 12/31/2011
($ 225.0)
($ 225.0)
Assumed Net Asset Value
$ 975.4
$ 1,648.9
29
1.
Based on Rex Energy internal estimates using NYMEX commodity strip prices as of
December 31, 2011. Estimates have not be updated to reflect current
market prices
2.
Estimated by Netherland, Sewell, & Associates, Inc. at $92.45 per Bbl and $4.54
per Mcf as of 12/31/2011
3.
Closed on 13,000 acres, ~2,000 acres pending clearance of title 4. Based on publicly available data for recent joint venture
transactions
5.
See note on “Forward Looking Statements” and “Hydrocarbon Volumes”
on pages 2&3
6.
Recoveries based on Rex Energy internal estimates, (see page 3); excludes
approximately 307.4 Bcfe of Marcellus proved reserves and 5.0 Bcfe of Utica
and Upper Devonian Shale proved reserves as of December 31, 2011 7. Assumptions based on analyst valuations 8. Based on Rex Energy internal estimates of the amount of
proceeds it expects to receive in connection with its previously announced divestiture of its
midstream assets in Butler County, Pennsylvania and its interests in the
Denver-Julesburg Basin
9.
Includes borrowings under the senior credit facility and second lien facility |
 Wet Gas
Economic Yields $3.75 NYMEX equates to $3.95 per Mcf of net revenue
•
$3.75 NYMEX Henry Hub
•
$100.00 NYMEX WTI
Wellhead Production –
1 mcf of Natural Gas
Natural Gas
NGLs
Production by Product
.900 mcf
1.64 gallons/ mcf
(2)
Gross Realized by Product
$3.42 net
(1)
$2.03
(3)
Aggregate Realized Price per 1 mcf at wellhead
$5.45
Gathering, transportation and operating expenses
$1.50
Net Income Less Operating Expenses
$3.95
(4)
1.
$0.05 added to NYMEX Henry Hub for premium
2.
.85 gallon/ mcf is excluded since it is used as fuel for compressors at the
Sarsen cryogenic plant 3.
NGL Price assumption of 52% of $100.00 NYMEX WTI
4.
Does not include Rex’s 28% interest in cash flow from the cryogenic plant
partnership 30 |
 Butler
Marcellus Operated Wells In Inventory 31
Pad
Pad
Gross Well Count
Gross Well Count
Net Well Count
Net Well Count
Status
Status
Gilliland #11-HB
1.0
0.7
Completed awaiting pipeline
Grosick
(1)
4.0
1.7
Fracture stimulating remaining
four of seven Wells
Carson
3.0
2.1
Drilled awaiting completion
Bricker
1.0
0.7
Drilled awaiting completion
Graham
3.0
2.1
Drilled awaiting completion
Pallack
2.0
1.4
Drilled awaiting completion
Drushel
1.0
0.7
Drilled awaiting completion
Gilliland
-
Marcellus
Wells
5.0
3.5
Wells drilled awaiting completion
Total 2011 Wells in Inventory
20
12.9 |
 Pad
Pad
Gross Well Count
Gross Well Count
Net Well Count
Net Well Count
Status
Status
Plesniak
2
1.4
Drilling first of two wells
Lynn N&S
2
1.4
Awaiting Drilling Rig
JRGL
1
0.7
Awaiting Drilling Rig
Stebbins
1
0.7
Awaiting Drilling Rig
Meyer
1
0.7
Awaiting Drilling Rig
Breakneck Beagle Club
1
0.7
Awaiting Drilling Rig
Wack
1
0.7
Awaiting Drilling Rig
Lamperski
1
0.7
Awaiting Drilling Rig
Rape
2
1.4
Awaiting Drilling Rig
Total 2012 Drilling Program
12
8.4
Butler Operated Drilling & Completion Schedule
2012 Butler County Operated Area Drilling Program
Gross
Net
Wells Drilled
12
8.4
Wells Fracture Stimulated
20
12.9
Wells Placed in Service
21
13.6
Wells Drilled Awaiting Completion
11
7.7
32 |
 Area
Pad
Pad
Gross Well Count
Gross Well Count
Net Well Count
Net Well Count
Status
Status
Butler County, PA
Cheeseman #1H
1
0.7
Completed Awaiting Pipeline
Butler County, PA
Petro
1
0.7
Awaiting Drilling Rig
Butler County, PA
Grubbs
1
0.7
Awaiting Drilling Rig
Butler County, PA
Burgh
1
0.7
Awaiting Drilling Rig
Carroll County, OH
Brace
1
0.8
Awaiting Drilling Rig
Carroll County, OH
G. Graham
1
0.8
Awaiting Drilling Rig
Carroll County, OH
Troyer
1
0.8
Awaiting Drilling Rig
Total 2012 Utica Drilling Program
7
5.2
Utica Shale Drilling & Completion Schedule
2012 Utica Shale Drilling Program
Gross
Net
Wells Drilled
6
4.5
Wells Fracture Stimulated
4
3.1
Wells Placed in Service
5
3.8
Wells Drilled Awaiting Completion
2
1.4
33 |
 County
Pad
Pad
Gross Well Count
Gross Well Count
Net Well Count
Net Well Count
Status
Status
Westmoreland
Duralia
2.0
0.8
Wells Drilled Awaiting Completion
Westmoreland
McBroom
1.0
0.4
One of three wells on pad awaiting
completion
Total 2011 Wells in Inventory
3.0
1.2
Non Operated Drilling & Completion Schedule
34
County
Pad
Pad
Gross Well Count
Gross Well Count
Net Well Count
Net Well Count
Status
Status
Westmoreland
Corbett
2.0
0.8
Drilling Second of Two Wells
Westmoreland
Gera
2.0
0.8
Awaiting Drilling Rig
Westmoreland
Mehalic
2.0
0.8
Awaiting Drilling Rig
Clearfield/Centre
Hartle
2.0
0.8
Awaiting Drilling Rig
Clearfield/Centre
Billotte
2.0
0.8
Awaiting Drilling Rig
Clearfield/Centre
Lauver
2.0
0.8
Awaiting Drilling Rig
Clearfield/Centre
Smith
1.0
0.4
Awaiting Drilling Rig
Clearfield/Centre
Sankey
2.0
0.8
Awaiting Drilling Rig
Clearfield/Centre
Mignot
2.0
0.8
Awaiting Drilling Rig
Total 2012 Drilling Program
17.0
6.8
2012 Non-Operated Drilling Program
Gross
Net
Wells Drilled
17
6.8
Wells Fracture Stimulated
16
6.4
Wells Placed in Service
16
6.4
Wells Drilled Awaiting Completion
5
2.0 |
 Current
Hedging Summary Crude Oil
(1)
1Q12
2Q12
3Q12
4Q12
1Q13
2Q13
3Q13
4Q13
Collar Contracts
Volume Hedged
150,000
150,000
150,000
150,000
135,000
135,000
135,000
135,000
Ceiling
$ 111.08
$ 111.08
$ 111.08
$ 111.08
$ 112.56
$ 112.56
$ 112.56
$ 112.56
Floor
$ 68.39
$ 68.39
$ 68.39
$ 68.39
$ 72.44
$ 72.44
$ 72.44
$ 72.44
35
Natural Gas Hedges
(1)
1Q12
2Q12
3Q12
4Q12
1Q13
2Q13
3Q13
4Q13
Swap Contracts
Volume
1,050,000
1,200,000
1,200,000
1,200,000
1,170,000
1,170,000
1,170,000
1,170,000
Price
$ 4.59
$ 4.43
$ 4.43
$ 4.43
$ 3.93
$ 3.93
$ 3.93
$ 3.93
Collar Contracts
Volume
750,000
750,000
750,000
750,000
840,000
840,000
840,000
840,000
Ceiling
$ 5.89
$ 5.89
$ 5.89
$ 5.89
$ 5.68
$ 5.68
$ 5.68
$ 5.68
Floor
$ 4.70
$ 4.70
$ 4.70
$ 4.70
$ 4.77
$ 4.77
$ 4.77
$ 4.77
1. Hedging position as of 1/24/2012 |
 Current
Hedging Summary Cont’d Natural Gas Hedges Cont’d
(1)
1Q12
2Q12
3Q12
4Q12
1Q13
2Q13
3Q13
4Q13
Put Contracts
Volume
-
-
-
-
660,000
660,000
660,000
660,000
Floor
-
-
-
-
$ 5.00
$ 5.00
$ 5.00
$ 5.00
Collar Contracts
with Short Puts
Volume
660,000
660,000
660,000
660,000
480,000
480,000
480,000
480,000
Ceiling
$ 5.13
$ 5.13
$ 5.13
$ 5.13
$ 5.08
$ 5.08
$ 5.08
$ 5.08
Floor
$ 4.48
$ 4.48
$ 4.48
$ 4.48
$ 4.38
$ 4.38
$ 4.38
$ 4.38
Short Put
$3.66
$3.66
$3.66
$3.66
$ 3.53
$ 3.53
$ 3.53
$ 3.53
36
1. Hedging position as of 1/24/2012 |