Attached files
| file | filename |
|---|---|
| 8-K - FORM 8-K - NEW JERSEY RESOURCES CORP | d281426d8k.htm |
| EX-99.2 - EXHIBIT 99.2 - NEW JERSEY RESOURCES CORP | d281426dex992.htm |
 New
Jersey Resources New York Financial
Community Luncheon
January 12, 2012
Exhibit 99.1 |
 Regarding Forward-Looking Statements
2
Certain statements contained in this presentation are forward-looking statements within the
meaning of the Private Securities Litigation Reform Act of 1995. Forward-looking
statements can also be identified by the use of forward-looking terminology such as “may,” “intend,” “expect,” or “continue” or comparable
terminology and are made based upon management’s current expectations and beliefs as of this date
concerning future developments and their potential effect upon New Jersey Resources (NJR or the
Company). There can be no assurance that future developments will be in accordance with management’s expectations
or that the effect of future developments on the Company will be those anticipated by management. NJR
cautions persons reading or hearing this presentation that the assumptions that form the basis
for forward-looking statements regarding expected contribution by new customers of New Jersey Natural Gas Company
(NJNG) to utility gross margin, expected number of new customers of NJNG, the completion of NJRCEV's
planned solar projects in fiscal 2012, the approval of NJNG’s natural gas refueling station filing, approval of the proposed extension of The SAVEGREEN Project®,
estimated capital expenditures in fiscal 2012 by NJNG and NJRCEV, and NJ’s Energy Master Plan include many factors that are beyond the Company’s ability to control or estimate precisely.
The factors that could cause actual results to differ materially from NJR’s expectations include,
but are not limited to, weather and economic conditions; demographic changes in the NJNG service
territory and their effect on NJNG's customer growth; volatility of natural gas and other
commodity prices and their impact on NJNG customer usage, NJNG's incentive programs, NJRES' operations
and on the Company's risk management efforts; changes in rating agency requirements and/or credit
ratings and their effect on availability and cost of capital to the Company; the impact of
volatility in the credit markets; the ability to comply with debt covenants; the impact to the asset
values and resulting higher costs and funding obligations of NJR's pension and postemployment
benefit plans as a result of downturns in the financial markets, a lower discount rate, and impacts
associated with the Patient Protection and Affordable Care Act; accounting effects and other risks
associated with hedging activities and use of derivatives contracts; commercial and wholesale
credit risks, including the availability of creditworthy customers and counterparties, liquidity in the
wholesale energy trading market and the Company’s ability to recover all of NJRES’ funds in
the MF Global liquidation proceedings; the ability to obtain governmental approvals and/or
financing for the construction, development and operation of certain non-regulated energy investments; risks
associated with the management of the Company's joint ventures and partnerships; risks associated with
our investments in solar energy projects, including the availability of regulatory and tax
incentives, logistical risks and potential delays related to construction, permitting, regulatory approvals
and electric grid interconnection, the availability of viable projects and NJR's eligibility for federal
investment tax credits (ITC), the future market for Solar Renewable Energy Certificates and
operational risks related to projects in service; timing of qualifying for ITCs due to delays or failures to
complete planned solar energy projects and the resulting effect on our effective tax rate and earnings;
the level and rate at which NJNG's costs and expenses are incurred and the extent to which
they are allowed to be recovered from customers through the regulatory process; access to adequate
supplies of natural gas and dependence on third-party storage and transportation facilities for
natural gas supply; operating risks incidental to handling, storing, transporting and providing
customers with natural gas; risks related to our employee workforce; the regulatory and pricing policies
of federal and state regulatory agencies; the costs of compliance with the proposed regulatory framework
for over-the-counter derivatives; the costs of compliance with present and future
environmental laws, including potential climate change-related legislation; risks related to changes in accounting
standards; the disallowance of recovery of environmental-related expenditures and other regulatory
changes; environmental-related and other litigation and other uncertainties; and the
impact of natural disasters, terrorist activities, and other extreme events. The aforementioned factors are
detailed in the “Risk Factors” sections of our Annual Report on Form 10-K to be filed on November 23, 2011, as filed with the Securities and Exchange
Commission (SEC) and which is available on the SEC’s website at sec.gov. NJR disclaims any obligation to update and revise statements contained in
these materials based on new information or otherwise. |
 Disclaimer Regarding
Non-GAAP Financial Measures
This presentation includes the non-GAAP measures net financial earnings
(losses) and utility gross margin. As an indicator of the
company’s
operating
performance,
these
measures
should
not
be
considered
an
alternative
to,
or
more
meaningful
than,
GAAP
measures
such
as
cash
flow,
net
income,
operating
income
or
earnings
per
share.
Net
financial
earnings
(losses)
exclude unrealized gains or losses on derivative instruments related to the
company’s unregulated subsidiaries and certain realized gains and
losses on derivative instruments related to natural gas that has been placed into storage at NJRES. Volatility
associated with the change in value of these financial and physical commodity
contracts is reported in the income statement in the current period. In
order to manage its business, NJR views its results without the impacts of the unrealized gains and losses,
and certain realized gains and losses, caused by changes in value of these
financial instruments and physical commodity contracts prior to the
completion of the planned transaction because it shows changes in value currently as opposed to when
the planned transaction ultimately is settled. NJNG’s utility gross margin
represents the results of revenues less natural gas costs, sales and other
taxes and regulatory rider expenses, which are key components of the company’s operations that move
in relation to each other.
Management uses net financial earnings and utility gross margin as supplemental
measures to other GAAP results to provide a more complete understanding of
the company’s performance. Management believes these non-GAAP measures are more
reflective of the company’s business model, provide transparency to investors
and enable period-to-period comparability of financial performance.
For a full discussion of our non-GAAP financial measures, please see Item 7 of our Annual Report on
Form 10-K for the fiscal year ended September 30, 2011, filed on November 23,
2011. 3 |
 Key
Industry Issues 4
Desire for
Yield
Macro
Economic
Environment
Interest Rates
Supply
Commodity
Prices
Organic
Customer
Growth
Financial
Profile
Environmental
Policy |
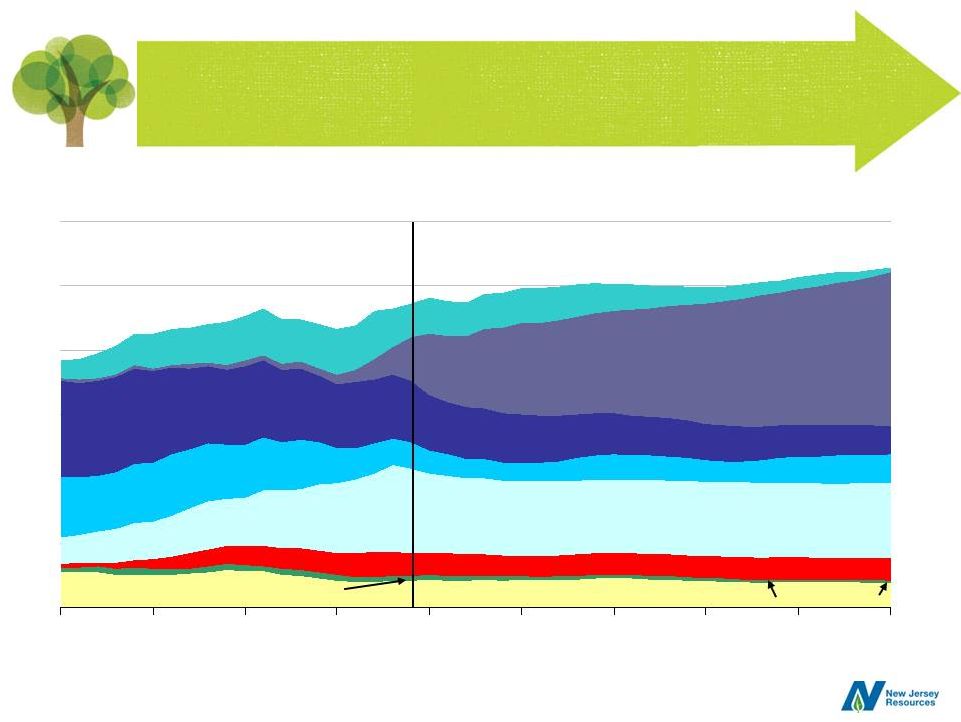
 U.S. Natural Gas Reserves
5
Unproved
shale gas
Unproved
other gas
Proved
reserves
Tcf
245
1,481
827
2,552
0
500
1,000
1,500
2,000
2,500
3,000
2000
2005
2006
2007
2008
2009
2010
2011
Source: EIA,
Annual Energy Outlook 2011 |
 Sources of Supply
6
Alaska
Non-associated offshore
Projections
History
Associated with oil
Coalbed methane
Net imports
Non-associated onshore
Shale gas
2009
11%
1%
9%
7%
9%
8%
20%
14%
8%
2%
8%
7%
46%
1%
Tight gas
28%
22%
Source: EIA, Annual Energy Outlook 2011
30
25
20
15
10
5
0
1990
1995
2000
2005
2010
2015
2020
2052
2030
2035 |
 Our
Business Model Steady customer growth
Rate base
investment opportunities
Regulatory incentives
Safety and reliability
Competitive pricing
Natural Gas Distribution
Clean Energy and Retail Services
Residential solar programs
Commercial rooftop solar
and ground-mounted projects
Service contracts, installations
and repair services
Wholesale Energy Services
Physical natural
gas marketer
Producer services
Storage and transportation
asset management
Midstream investments
Focus on the Fundamentals
•
Diverse Stakeholder Relationships
•
Strong Financial Profile
•
Disciplined Capital Allocation
•
Energy Infrastructure, Asset Mgmt. and Services
•
Consistent Earnings and Dividend Growth
7 |
 •
Achieved our 20th consecutive year of net financial earnings (NFE) per share growth
in fiscal 2011
–
$2.58 compared with $2.46 last year, a 4.9 percent increase
•
Implemented a 5.6 percent dividend increase effective January 3,
2012
–
New annual rate of $1.52 per share
–
17th consecutive annual increase
•
Strong results from New Jersey Natural Gas (NJNG)
–
Steady customer growth
–
Regulatory incentives
–
BGSS margins
•
Continued progress on clean energy strategy
–
Five commercial and 349 residential projects completed totaling over 9.8 megawatts
(MW) –
McGraw Hill and others completed in the first quarter of fiscal 2012
•
Positive earnings contribution from NJR Energy Services (NJRES),
NJR Home
Services (NJRHS) and Midstream Assets
Highlights
8 |
 •
Approximately 496,000
customers
•
$943 million of rate base
•
100 percent residential and
commercial customers
•
Solid customer growth
Our Core Business
9
Favorable demographics to support customer growth |
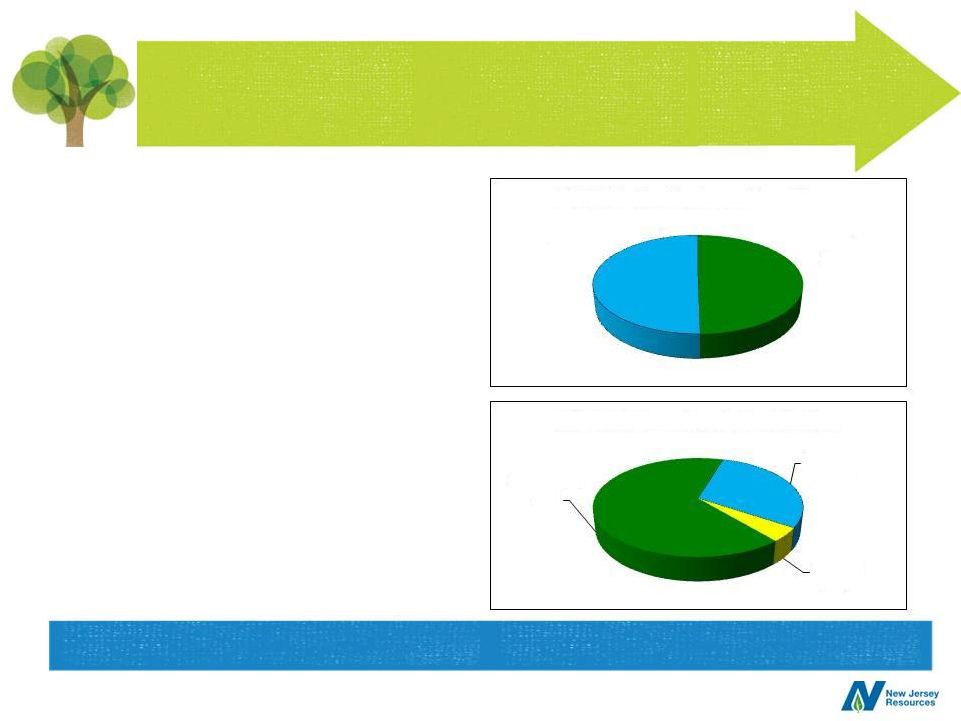 Customer Growth
•
6,783 new customers in fiscal
2011, a 10 percent increase over
fiscal 2010
•
641 additional existing customer
heat conversions
•
New customers and existing
customer conversions are
expected to contribute
approximately $3.5 million of new
NJNG utility gross margin annually
•
Estimate 12,000 to 14,000 new
customers over the next two years
10
Steady customer growth of 1.4 percent
New
Construction
50%
Conversions
50%
FYE 2011 New Customer Breakdown
Residential
66%
Commercial
30%
Existing
4%
FYE 2011 Gross Margin Contribution |
 $1.15
$3.03
$4.52
$4.98
$0.00
$1.25
$2.50
$3.75
$5.00
NJNG
Fuel Oil
Propane
Electricity
Fuel Price Comparison
Source: EIA
Data as of December 2011. Based on 100,000 comparable
BTUs
11
NJNG enjoys a distinct price advantage in its service area
|
 Future Customer Growth
12
2017-Build Out
Potential New Customers = 90,000
2012-2016
Near Main
Potential Conversions = 127,800
Non Heat
On Main
Off Main
Long-term customer growth outlook is strong
Sources: Arthur D. Little , Harte Hanks and NJNG
38,723
7,555
29,445
52,077
75,500
14,500 |
  Regulatory Initiatives
Accelerated Infrastructure Programs (AIP)
•
Extended on March 30, 2011
•
Accelerated
capital
projects
help
create
jobs
and
support
system
reliability
•
Project spending:
13
Conservation Incentive Program
•
In place through September 30, 2013; encourages customer conservation
•
Customers have reduced usage and saved over $193 million since inception in
2006 •
Protects NJNG from declining usage and weather; realized $9.1 million in gross
margin in fiscal 2011 Program
Total Capital
Number of
Expected
Return
Name
Approved ($mm)
Projects
Completion Date
on Equity
WACC *
AIP I
$70.8
14
9/30/2011
10.3%
7.76%
AIP II
60.2
9
10/31/2012
10.3%
7.12%
Total
$131.0
23
Constructive regulatory environment allows for innovative programs
|
 2011 Energy Master Plan
•
For NJNG, overall positive for natural gas:
–
Supports natural gas electric generation
–
Supports renewable fuel vehicles (NGVs)
–
Supports natural gas over oil in conversion
markets
14 |
 Pending Regulatory Initiatives
Natural Gas Refueling Stations
•
Filing submitted to the BPU on June 16, 2011
•
Potential investment of up to $15 million to fund seven to 10 stations in service
area –
$1.60 per gallon of gasoline equivalent based on current prices
–
If approved by the BPU, NJNG would begin construction immediately but no later
than December 31, 2012
–
Proposed annual rate recovery of program spending at WACC of 7.76 percent (10.3%
ROE) 15
The SAVEGREEN Project
®
•
Seeking
program
extension
through
December
31,
2012
to
invest
an
additional
$25.8
million
–
Existing program has resulted in over $73 million of economic activity in the
state •
Over $20 million invested; currently recoverable through rider at WACC of 7.76
percent New regulatory opportunities that benefit
both NJNG and customers |
 •
Off-system sales and capacity release
–
In place since 1992
–
Optimization of capacity and supply contracts
–
Sharing formula of 85 percent customer;
15 percent NJNG
•
Storage Incentive (SI)
–
In place since 2004
–
Promotes long-term price stability
–
Promotes efficient utilization
–
Sharing formula of 80 percent customer;
20 percent NJNG
•
Financial Risk Management (FRM)
–
In place since 1997
–
Promote application of risk management
tools
–
Sharing formula of 85 percent customer;
15 percent NJNG
BGSS Incentives
16
Total earnings since inception:
$1.76 per share, an average
of $.08 annually
Incentive programs in place through October 2015 |
 Clean Energy Strategic Rationale
•
Consistent with our core energy strategy
•
Reduced energy usage and lower prices for customers
•
Promotes economic development and job creation
•
Supports New Jersey’s environmental goals
17
Clean energy investments contributed $6.8 million to NFE
in its first year of operations |
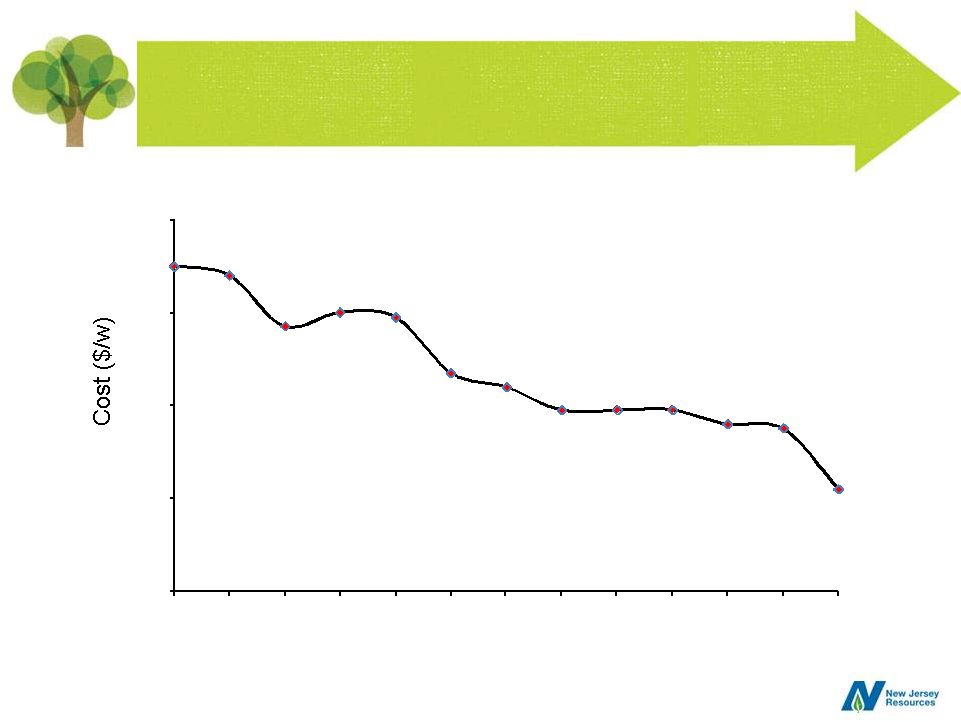 Declining Solar Material Costs
18
Source: Lawrence Berkeley National Laboratory (Behind the meter weighted average installed cost)
$11.00
$10.80
$9.70
$10.00
$9.90
$8.70
$8.40
$7.90
$7.90
$7.90
$7.60
$7.50
$6.20
$4.00
$6.00
$8.00
$10.00
$12.00
1998
1999
2000
2001
2002
2003
2004
2005
2006
2007
2008
2009
2010
National Average -
Installed Cost by Year |
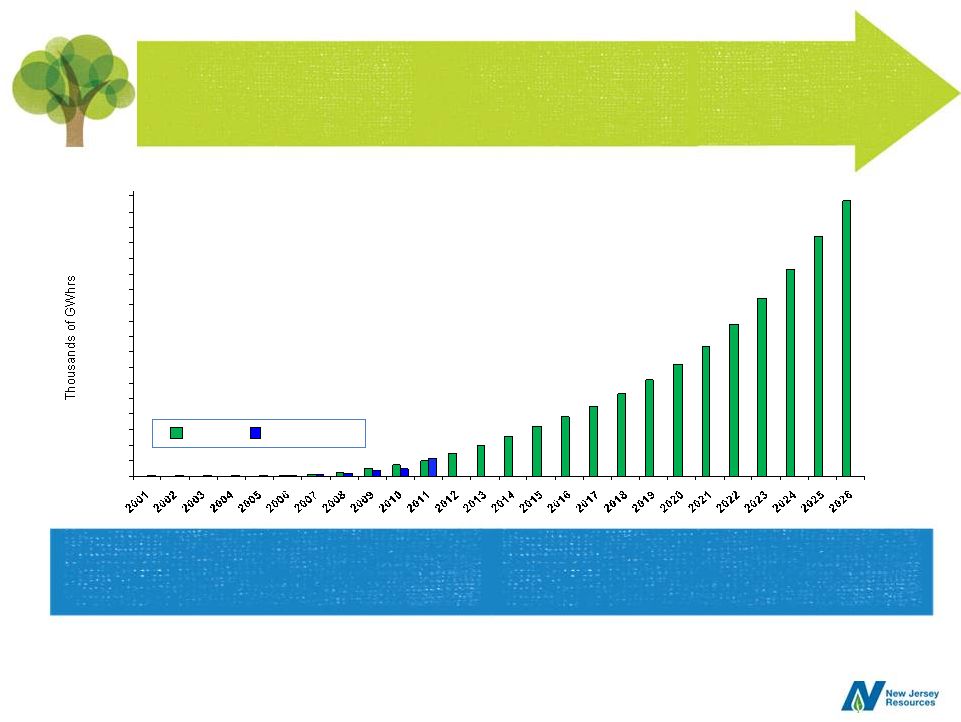 Legislative Renewable Portfolio Standard
12
37
78
156
218
306
442
596
772
965
1,150
1,357
1,591
1,858
2,164
2,518
2,928
3,433
3,989
4,610
5,316
0
300
600
900
1,200
1,500
1,800
2,100
2,400
2,700
3,000
3,300
3,600
3,900
4,200
4,500
4,800
5,100
5,400
RPS
Installed
Source: NJCEP solar installation report as of May 31, 2011
19
Robust Renewable Portfolio Standard (RPS) provides
for long-term solar project opportunities |
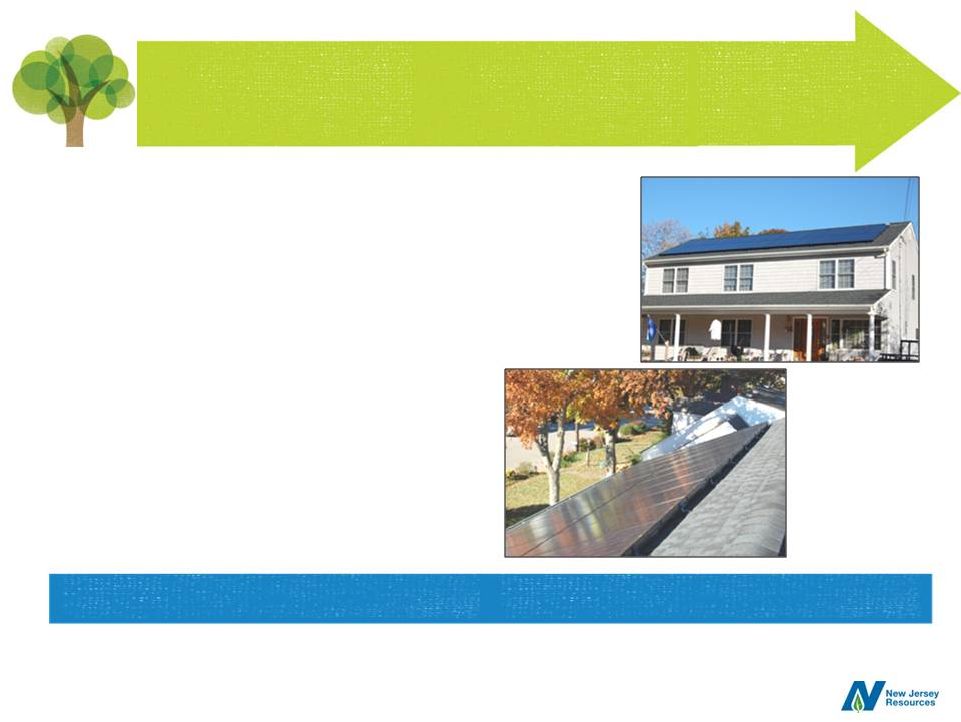 The Sunlight Advantage™
Program
•
Fiscal 2011 results:
–
Over 700 leases signed
–
349 operational in FY 2011
–
Average size: 6.9 kilowatts
–
$9.7 million of capital deployed
in FY 2011
•
Supply chain cost efficiency
–
Construction cost reductions
–
Equipment cost reductions
20
Strong residential solar demand |
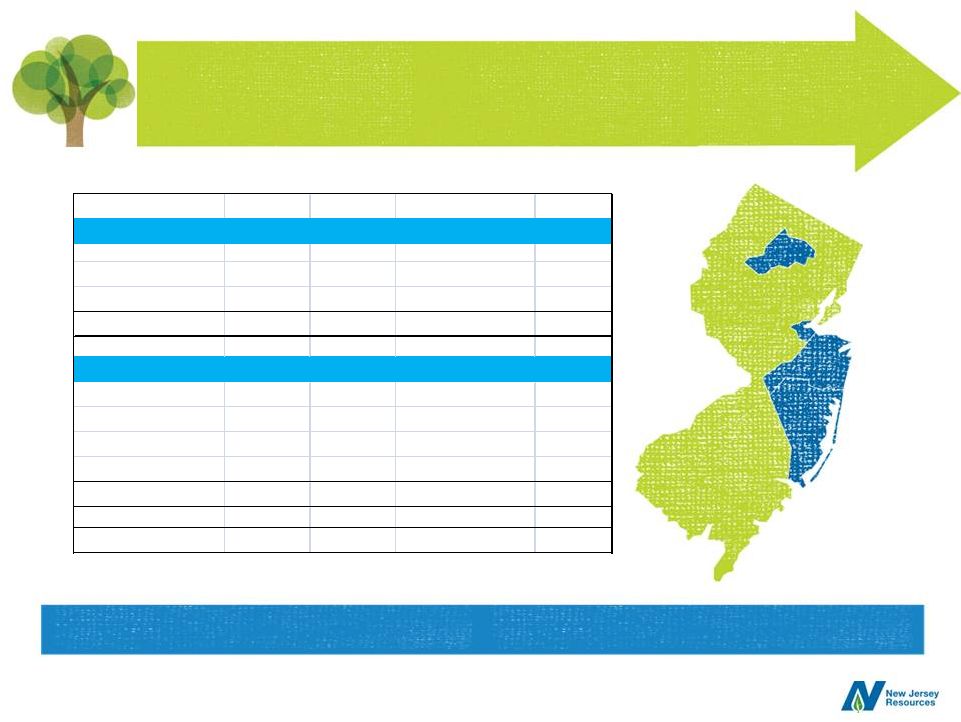 Commercial Solar Project Update
Project
Map Ref.
Type
Capital (mm)
MW
Adler 1-4
1
Rooftop
$18.0
3.9
75% Vineland
2
Ground
15.1
3.5
Sub Total
$33.1
7.4
Adler 5-6
1
Rooftop
$6.4
1.3
25% Vineland
2
Ground
7.2
1.2
Manalapan
3
Ground
17.2
3.6
McGraw Hill
4
Ground
59.5
14.1
Sub Total
$90.3
20.2
Grand Total
$123.4
27.6
In Service - Fiscal 2011
In Service - Fiscal 2012
1
2
3
4
21
Seeking additional opportunities in fiscal 2012 and beyond
|
 22
Solar Project Update -
SREC Pricing
•
New Jersey’s commercial solar market surpassed
California last year to become the largest in the United
States
•
Tax credits, cash grants and bonus depreciation
incentives create an attractive solar market
•
Energy year 2012 SREC prices have been volatile
•
The New Jersey Energy Master Plan and pending
legislation support the solar industry |
 23
Solar Program Update –
Legislative Update
•
Administration’s Energy Master Plan supports a sustainable solar
business model that will create jobs, economic growth and
environmental mandates in New Jersey
•
Pending legislation supports the needs of the solar industry while
balancing the cost to customers
-
Accelerates the RPS targets
-
Reduces the Solar Alternative Compliance Payment (SACP) to
reflect the industry’s cost reductions
-
Reduces cost to customers
•
We currently anticipate legislative action in the first quarter of 2012
|
 Clean Energy Summary
•
Energy Master Plan and pending legislation provides
clear direction that solar will play an important role in New
Jersey’s energy future
–
Provides clean energy
–
Reduces costs to customers
–
Stimulates economic development
–
Uses new technologies
•
The solar industry is aggressively reducing costs, and
improving efficiencies in order to have less reliance on
incentives in the long term
–
Material prices should continue to fall
24 |
 Midstream Investments
•
Overall, Midstream Assets contributed $6.8 million to FY 2011 NFE vs.
$6.4 million last year
–
Iroquois contributed $2.7 million
•
Approximately 30 percent of Steckman Ridge capacity under
long-term contracts
NJRES and Midstream Investment Updates
25
NJRES
•
Value of capacity and storage has been affected by changing markets
and additional supplies
–
Resulted in lower margins
–
Continued focus on a long-option strategy
–
Disciplined risk management
•
Contributed $18.6 million to FY 2011 NFE vs. $24.8 million last year
|
 •
Serves nearly 150,000 customers
with Premier Service Plans and
equipment installations
•
Fiscal 2011 revenue of more than
$36 million, an 18 percent increase
over last year
•
Contributed over 2 percent of fiscal
2011 NFE
NJR Home Services
26
Consistently delivers high-quality products and service levels
|
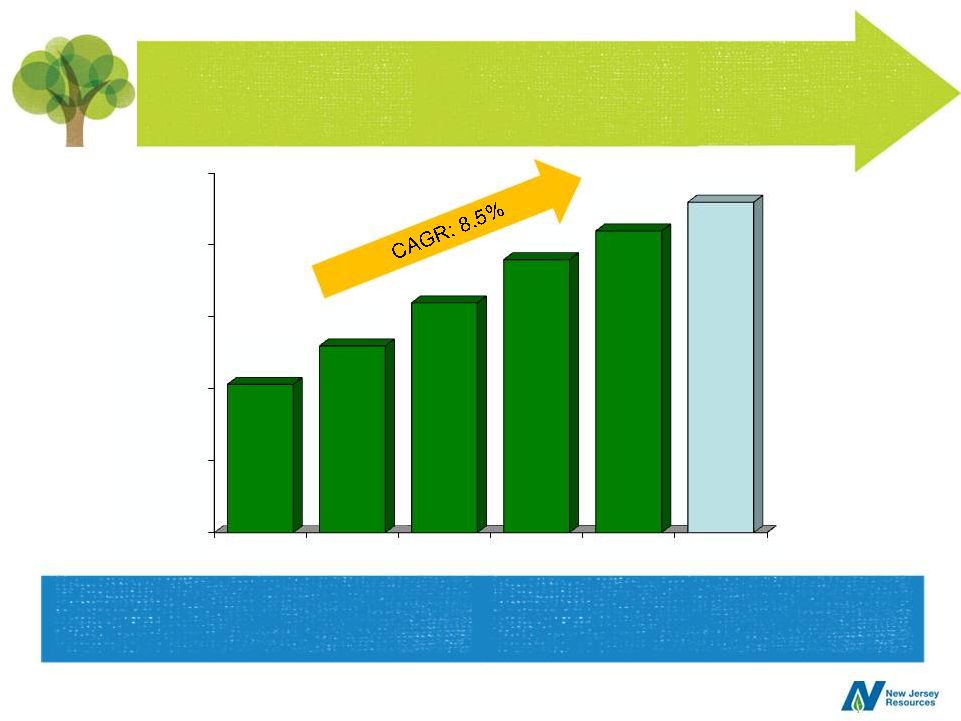
 Financial Performance
September 30
Infrastructure-based businesses provided
83 percent of fiscal 2011 NFE
27
$1.88
$2.11
$2.24
$2.40
$2.46
$2.58
$1.00
$1.30
$1.60
$1.90
$2.20
$2.50
$2.80
2006
2007
2008
2009
2010
2011
Net Financial Earnings |
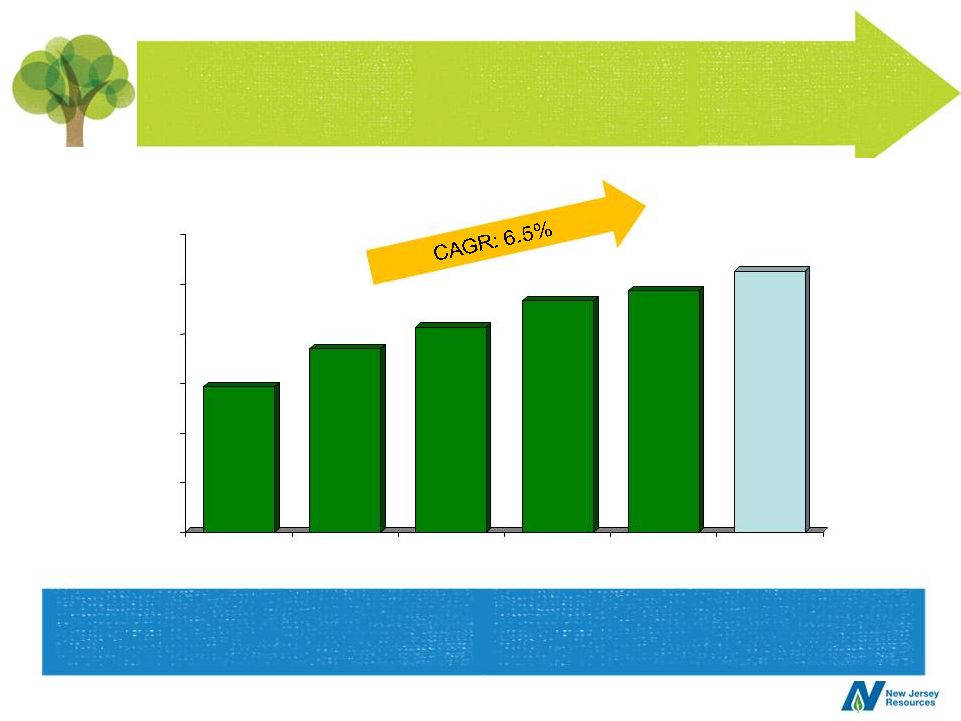
 17 consecutive year of dividend growth;
Five-year CAGR: 8.5% vs. 3.5%** for peers
Dividend Growth
* Effective January 3, 2012
** Based on current indicated dividend rates
28
th
$0.60
$0.80
$1.00
$1.20
$1.40
$1.60
2007
2008
2009
2010
2011
2012*
$1.01
$1.12
$1.24
$1.36
$1.44
$1.52 |
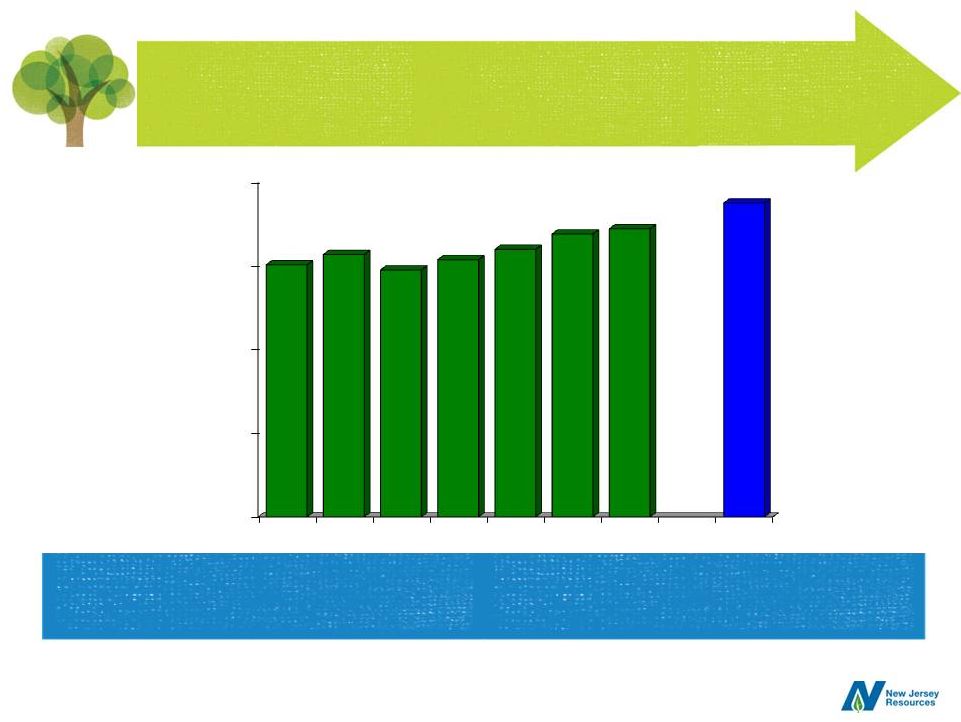 Payout Ratio
Based on Net Financial Earnings
Relatively low payout ratio provides
continued dividend growth opportunities
29
* Peer group average based on 2011 earnings estimates and
indicated dividend from Bloomberg. Peer group: ATO, GAS,
LG, NWN, PNY, SJI, SWX, VVC and WGL
0%
16%
33%
49%
65%
2005
2006
2007
2008
2009
2010
2011
Peer
Group*
49%
51%
48%
50%
52%
55%
56%
61% |
 ($ millions)
September 30,
September 30,
2011
2010
Cash Flow from Operations
$250.1
$139.4
Capital Expenditures:
Utility Plant
(93.6)
(86.6)
Solar Equipment and Other
(75.5)
(3.5)
Cost of Removal, Investments and Other
(6.0)
(11.2)
Subtotal Capital Expenditures
(175.1)
(101.3)
Financing Activitites
Common Stock Issued
15.7
7.2
Common Stock Repurchased
(10.2)
(29.7)
Dividends
(58.7)
(53.1)
Debt (Payments) Proceeds, net
(15.3)
2.3
Subtotal Financing Activities
(68.5)
(73.3)
Change in Cash
$6.5
($35.2)
Cash Flow Summary
30
Strong cash flow supports future capital expenditure plans
Strong cash flow supports future capital expenditure plans
|
 •
NJNG capital expenditures totaling $121.2 million
–
Includes $49.9 million for AIP
•
Continued steady customer growth
–
About 6,500 new customers
–
Gross margin of $3.5 million annually
•
ITC-eligible clean energy capital expenditures estimated
at $104.3 million
–
Commercial -
$90.1 million
–
Residential -
$14.2 million
Key Fiscal 2012 Assumptions
31
Fiscal 2012 guidance will be issued on February 7 |
 32
•
We have:
–
A track record of growth and consistent results
–
The fundamentals in place to deliver consistent long-term NFE growth
•
Solid customer growth
•
Progressive regulation
•
Disciplined solar investments
–
A collaborative relationship with key stakeholders
–
A strong financial profile
–
A commitment to dividend growth
•
17-year growth history
Why NJR?
A record of consistent performance; positioned for long-term growth
|
 New
Jersey Resources New York Financial
Community Luncheon
January 12, 2012 |