Attached files
| file | filename |
|---|---|
| 8-K - FORM 8-K - PS BUSINESS PARKS, INC./MD | d272716d8k.htm |
| EX-99.1 - PRESS RELEASE DATED DECEMBER 20, 2011 - PS BUSINESS PARKS, INC./MD | d272716dex991.htm |
 Northern California Industrial and Flex
Portfolio Acquisition
December 20, 2011
Exhibit 99.2 |
 PS Business
Parks 2
PSB Overview Post Acquisition
Acquisition Highlights
Financing Strategy
Conclusion
Appendix
Contents |
 PS Business
Parks 3
PSB Overview –
Post Acquisition
27.2 Million Square Feet; an increase of 24.4%
102 Business Parks in Eight States, increased from 84
Average Customer Size: 5,500 Sq. Ft., increased from 4,700
4,360 Customers, an increase of 216
Total Market Cap: $3.1 Billion
Data As of December 20, 2011 |
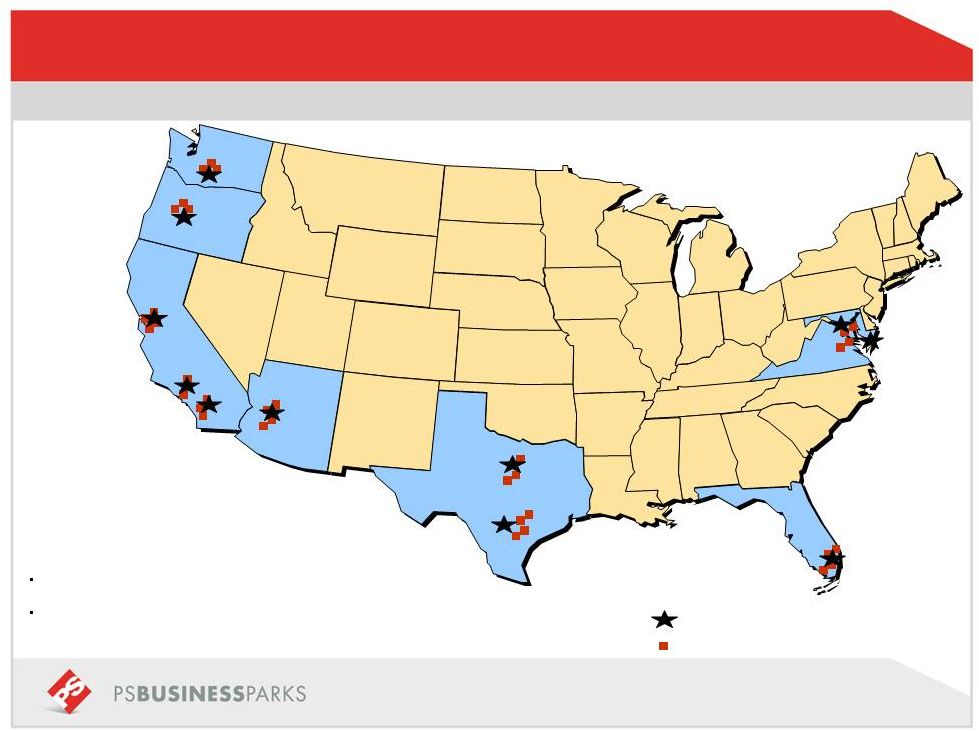 PSB
Office PSB Cluster of Properties
Strong Geographical Diversity within Vibrant Markets
1.3 mm sf
7.2 mm sf
3.2 mm sf
0.8 mm sf
0.7 mm sf
1.8 mm sf
6.5 mm sf
3.7 mm sf
1.5 mm sf
0.5 mm sf
Flex: 56.4%, Office: 18.3%, Industrial: 25.3%
Average Customer Size: 5,500 Square Feet
PS Business Parks
4 |
 PS Business
Parks 5
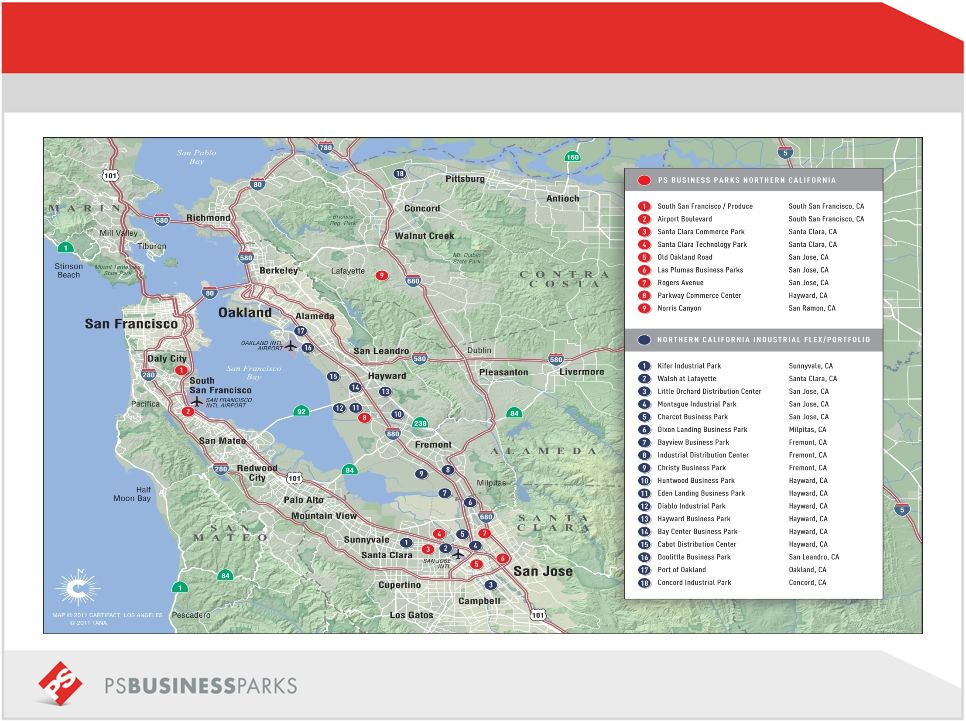
Acquisition Overview
Northern California Industrial/Flex Portfolio
East Bay & Silicon Valley, CA
|
 PS Business
Parks 6
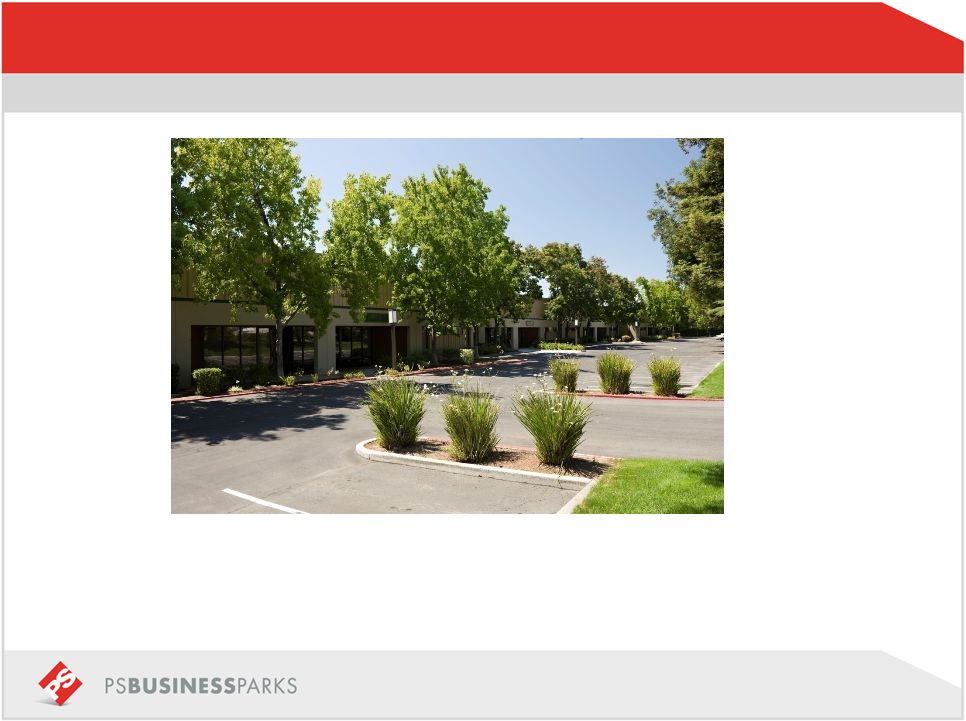
Sample Portfolio Photos
Dixon Landing Business Park
Walsh at Lafayette
Bayview Business Park
Hayward Business Park |
 PS Business
Parks 7
5.3 million sf
54% Industrial
46% Flex
$520 million purchase ($98 psf)
82% occupied
18 business parks (89 buildings)
Average tenant size: 20,000 sf
216 customers
Average remaining in-place
lease term of 2.6 years
Northern California Industrial & Flex Portfolio Overview
|
 PS Business
Parks 8
Expansion of PSB’s Platform in the Bay Area
|
 PS Business
Parks 9
Deep Bay Area Platform
Location: Highly sought after Bay Area flex/industrial markets
Critical Mass: 5.3 million square feet and 18 business parks
Total Northern California Presence: 7.2 Million Square Feet, 30 business
parks Average Tenant Size: 20,000 square feet
Functionality: Core industrial/flex multi-tenant properties
Operational Upside: PSB in-house leasing and management
Opportunity to capture market momentum
At 82% occupancy, below PSB’s existing Bay Area portfolio (92%)
Strategic Considerations |
 PS Business
Parks 10
Portfolio Summary By Submarket
(1) As of December 20, 2011
(1)
Property
Parks
Square Feet
% of Portfolio
Occupancy
Hayward
6
2,333,528
44%
82.8%
Fremont
3
636,579
12%
69.6%
Concord
1
245,930
5%
71.4%
Oakland
1
199,733
4%
83.2%
San Leandro
1
113,196
2%
84.6%
Total East Bay
12
3,528,966
67%
79.7%
San Jose
3
692,529
13%
90.3%
Milpitas
1
505,199
9%
69.1%
Santa Clara
1
320,505
6%
96.8%
Sunnyvale
1
287,300
5%
100.0%
Total Silicon Valley
6
1,805,533
33%
87.1%
Totals
18
5,334,499
100%
82.2% |
 PS Business
Parks 11
Market Data (Q3 2011)
Industrial/Flex - Oakland/East Bay
Size
196,247,212
Vacancy
9.3%
Absorption
1,198,560
Under Construction
-0-
Industrial/Flex - Silicon Valley
Size
103,518,905
Vacancy
7.4%
Absorption
477,531
Under Construction
-0-
Source: CBRE |
 PS Business
Parks 12
Acquisition Funding
$250 Million Existing Loan Assumed (Cross Collateralized)
5 Year Remaining Term
5.45% Fixed Rate
$250 Million Term Loan with Wells Fargo Bank
3 Year Term
Interest Rate at 1.20% Over LIBOR
Prepayable Without Penalty
Balance Funded with Retained Cash/Credit Facility
|
 Total Market Capitalization: $3.1 Billion
Capital Structure
Note: Balances are as of 12/20/11
Secured Debt
9.2%
Unsecured Debt
13.6%
Preferred
Equity
19.8%
Common Stock/OP Units
57.4%
13
PS Business Parks |
 PS Business
Parks 14
APPENDIX |
 PS Business
Parks 15
PSB
Portfolio
Diversification
–
Post
Acquisition
Data as of 12/20/11
Pro Rata
Pro Rata
Region
Square Feet
Share
Square Feet
Share
No.California
1,818,000
8.3%
7,152,000
26.3%
Washington DC Metro
6,517,000
29.8%
6,517,000
23.9%
So. California
3,988,000
18.2%
3,988,000
14.7%
Florida
3,717,000
17.0%
3,717,000
13.7%
Texas
3,326,000
15.2%
3,326,000
12.2%
Pacific Northwest
1,835,000
8.4%
1,835,000
6.7%
Arizona
679,000
3.1%
679,000
2.5%
Total
21,880,000
100.0%
27,214,000
100.0%
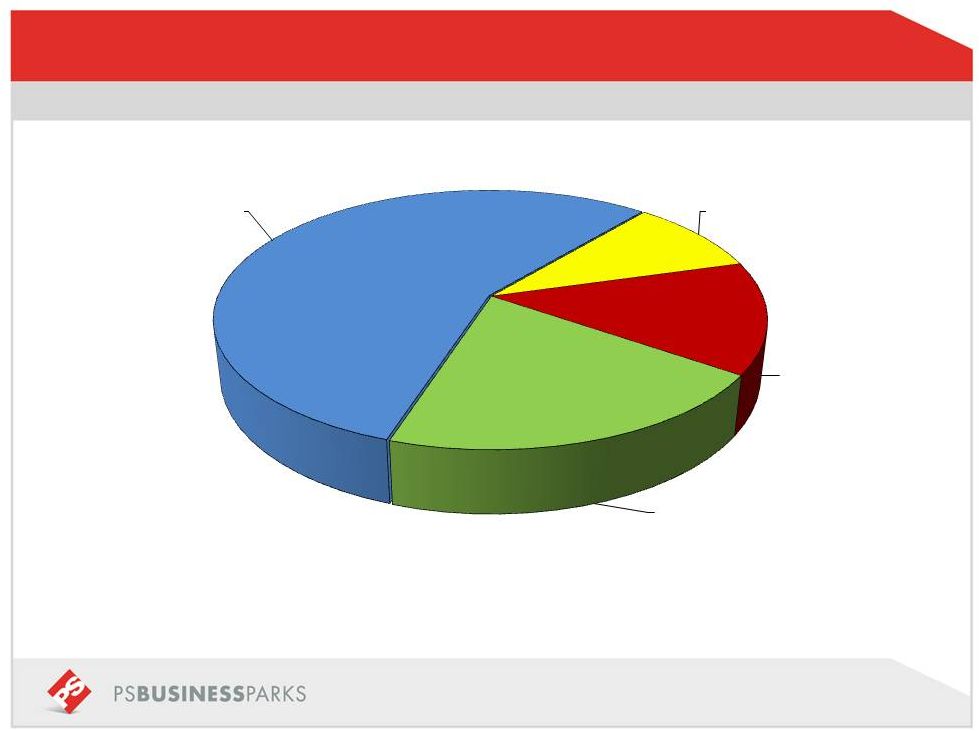
Flex Portfolio
12,904,000
59.0%
15,346,000
56.4%
Industrial Portfolio
3,981,000
18.2%
6,873,000
25.3%
Office Portfolio
4,995,000
22.8%
4,995,000
18.3%
Total
21,880,000
100.0%
27,214,000
100.0%
Pre-Acquisition Allocation
Post-Acquisition Allocation |
 PS Business
Parks 16
Customer Diversification (Full Portfolio)
Company data as of 12/20/11.
Top
10
Tenants
–
Percent
of
Annualized Rental Income:
U.S Government: 6.7%
Lockheed Martin Corporation: 1.5%
Level 3 Communications: 1.1%
Kaiser Permanente: 1.1%
Bristol-Myers Squibb: 0.8%
Wells Fargo Bank: 0.7%
Luminex Corporation: 0.7%
Keeco, LLC: 0.6%
AARP: 0.5%
ATS Corporation: 0.5%
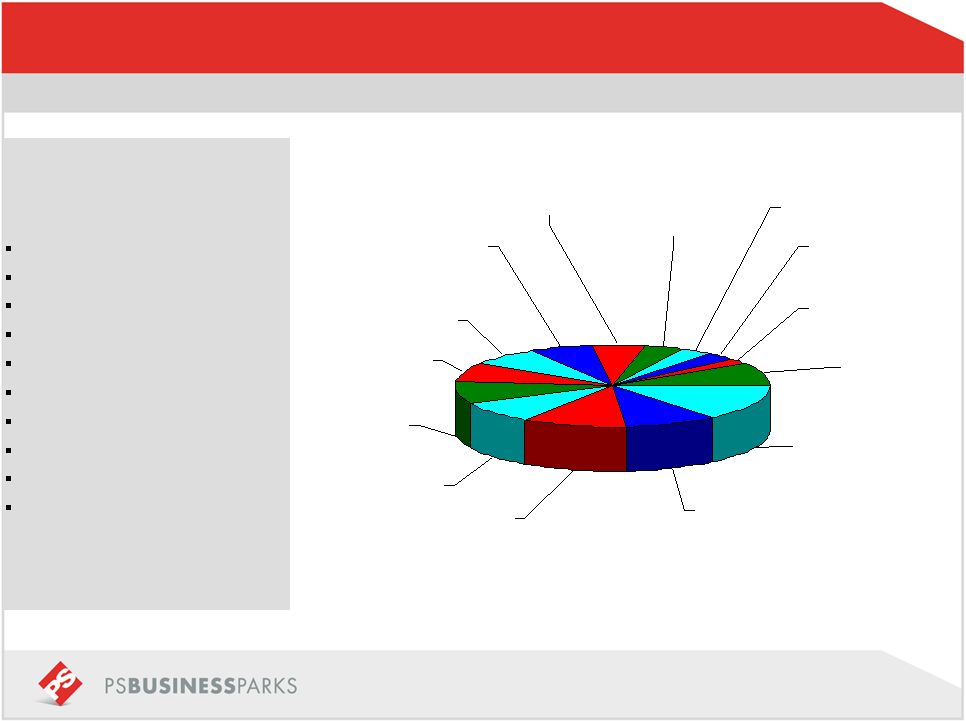
Percentage of Total Rent by Sector
Other, 9.1%
Business Services,
15.7%
Computer Hardware,
Software & Related
Services, 10.4%
Health Services, 11.3%
Government, 10.6%
Warehouse,
Transportation and
Logistics, 9.2%
Engineering and
Construction, 6.1%
Insurance and Financial
Service, 5.9%
Retail, Food and
Automotive, 5.5%
Aerospace / Defense
Products and Services,
2.9%
Educational Services,
1.8%
Electronics, 3.1%
Home Furnishings, 3.4%
Communications, 5.1% |
 PS Business
Parks 17
Acquired Portfolio Top 20 Tenants
Tenant Name
Sqft
Keeco, L.L.C.
279,669
Valley Relocation
212,840
Level 3 Communciations
197,100
EGL Eagle Global Logistics, LP
180,164
Applied Materials, Inc
150,480
KZ Kitchen Cabinet
138,325
PODS of San Francisco, LLC
118,820
Bristol Myers Squibb Company
113,792
First Solar, Inc.
110,025
Brook Furniture
95,904
Contract Office Group, Inc.
92,425
Kuehne & Nagel
90,720
McCollister's Moving
66,893
Apple, Inc
66,185
Fremont Furniture Solutions
58,608
The Gene Schick Company
54,266
Finisar Corporation
43,756
Metabolex
41,600
Cetecom
41,361
Commercial Casework
40,152
|
 PS Business
Parks 18
Disclaimer
When used within this presentation the words “may,”
“believes,”
“anticipates,”
“plans,”
“expects,”
“seeks,”
“estimates,”
“intends”
and similar expressions are
intended to identify “forward-looking statements.”
Such forward-looking statements
involve known and unknown risks, uncertainties and other factors, which may
cause the actual results and performance of the Company to be
materially different from those expressed or implied in the
forward-looking statements. Such risks, uncertainties and other
factors relate to, among others, difficulties encountered in integrating the
properties, inability to realize expected synergies, unanticipated operating
costs, unexpected declines in occupancy, the risk of natural
disasters including earthquakes and the effects of general and local
economic and real estate conditions. Additional factors which could
impact the forward-looking statements contained in this
presentation are contained in the company’s filings with the Securities
and Exchange Commission. PS Business Parks, Inc. assumes no
obligation to update or supplement forward-looking statements
that become untrue because of subsequent events. |
 |