Attached files
| file | filename |
|---|---|
| EX-99 - PDF - FIRST MIDWEST BANCORP INC | exhibit99.pdf |
| 8-K - FORM 8-K - FIRST MIDWEST BANCORP INC | nov108k.htm |

Sandler O’Neill
East Coast Financial Services Conference
Aventura, FL
November 10, 2011
2011 First Midwest Bancorp, Inc.

2
Forward Looking Statements &
Additional Information
Additional Information
This presentation may contain, and during this presentation our management may make statements that may
constitute “forward-looking statements” within the meaning of the safe harbor provisions of the Private
Securities Litigation Reform Act of 1995. Forward-looking statements are not historical facts but instead
represent only our beliefs regarding future events, many of which, by their nature, are inherently uncertain and
outside our control. Forward-looking statements include, among other things, statements regarding our
financial performance, business prospects, future growth and operating strategies, objectives and results.
Actual results, performance or developments could differ materially from those expressed or implied by these
forward-looking statements. Important factors that could cause actual results to differ from those in the forward-
looking statements include, among others, those discussed in our Annual Report on Form 10-K, the preliminary
prospectus supplement and other reports filed with the Securities and Exchange Commission, copies of which
will be made available upon request. With the exception of fiscal year end information previously included in the
audited financial statements in our Annual Report on Form 10-K, the information contained herein is unaudited.
Except as required by law, we undertake no duty to update the contents of this presentation after the date of
this presentation.
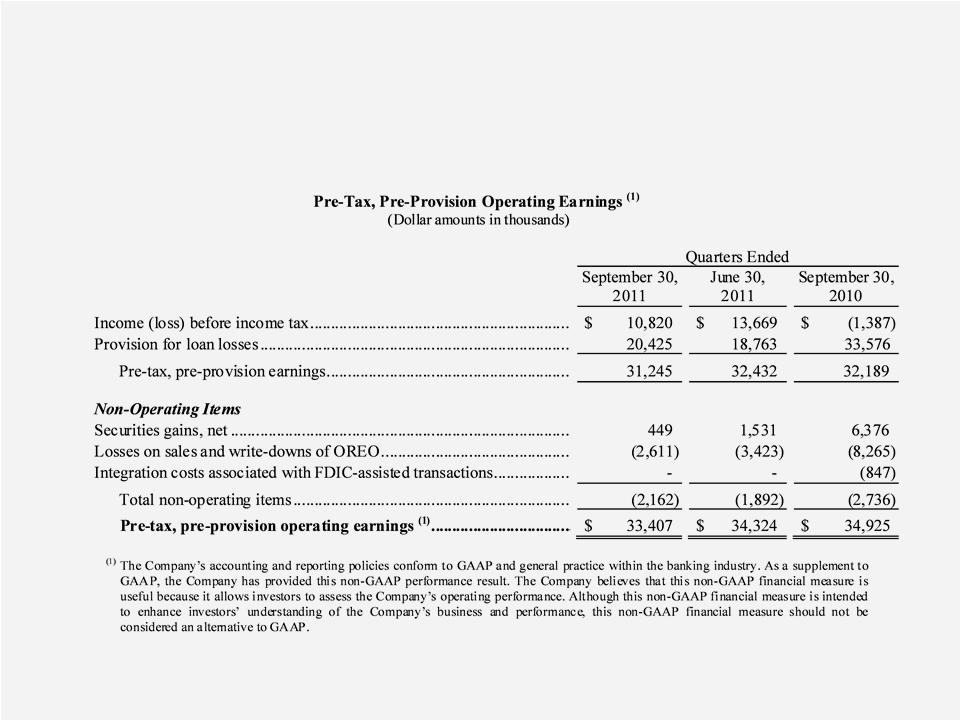
The Company’s accounting and reporting policies conform to U.S. generally accepted accounting principles
(“GAAP”) and general practice within the banking industry. As a supplement to GAAP, the Company has
provided non-GAAP performance results. The Company believes that these non-GAAP financial measures are
useful because they allow investors to assess the Company’s operating performance. Although the non-GAAP
financial measures are intended to enhance investors’ understanding of the Company’s business and
performance, these non-GAAP financial measures should not be considered an alternative to GAAP.

3
First Midwest Presentation Index
Who We Are
Operating Performance
Credit And Capital
Opportunities and Focus
Going Forward

4
Who We Are
5
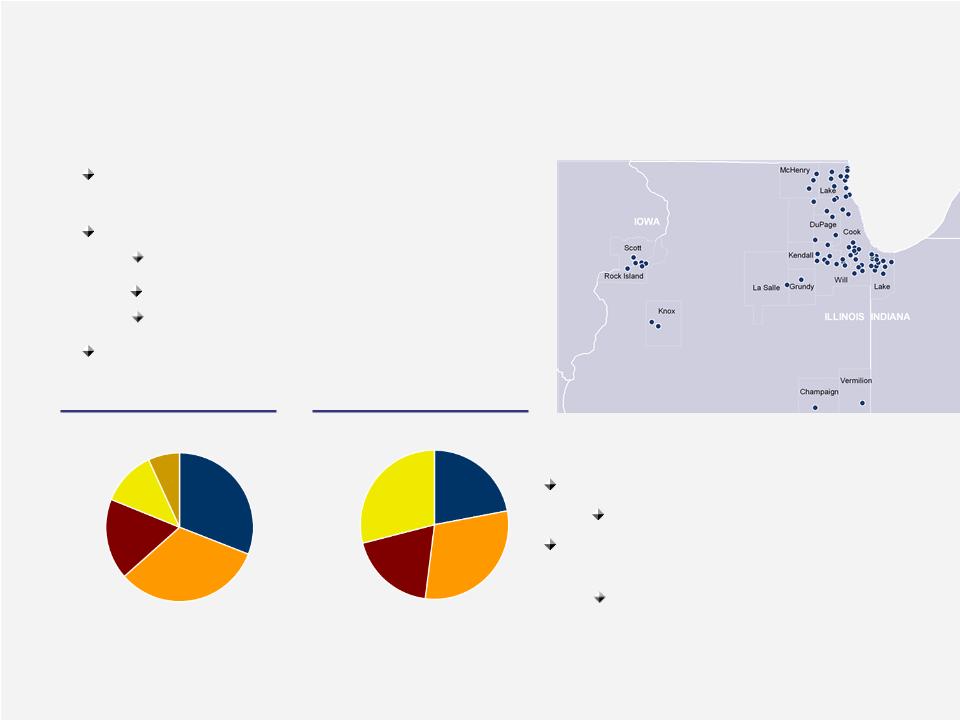
Overview Of First Midwest
Headquartered In Suburban
Chicago
Chicago
$8.4bn Assets
$5.4bn Loans (3)
$6.6bn Deposits
74% Transactional
$4.3bn Trust Assets
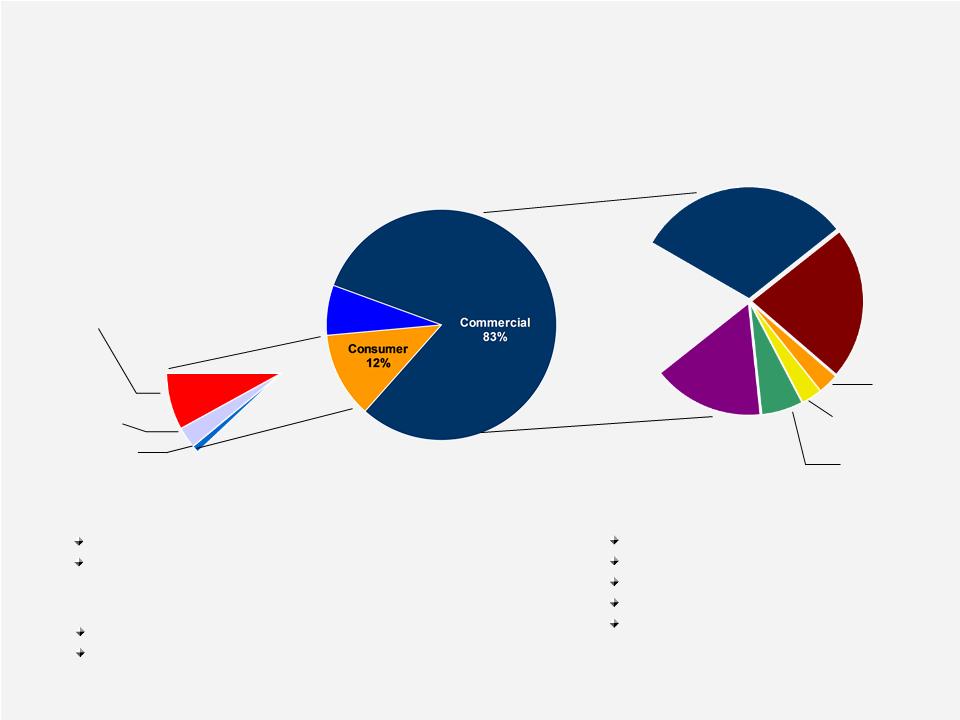
Loan Mix
Deposit Mix 2
Highly Efficient Platform
$69mm Of Deposits Per Branch
Leading Market Share In Non-
Downtown Chicago MSA 1
Downtown Chicago MSA 1
#9 In Market Share
$5.4bn
$6.6bn
Note: Information as of 30-September-11.
1 Source: SNL Financial. Non-downtown ranking and market share based on total deposits in Chicago MSA less deposits in the city of Chicago. Data as of 31-Dec-10.
2 Based on quarterly average deposit mix as of 30-Sept-11.
3 Includes $290mm in covered loans stemming from three FDIC-assisted transactions since 30-Sept-09.
Consumer
12%
Commercial
& Industrial
& Industrial
32%
Non Owner
- Occupied
CRE
CRE
32%
Savings &
NOW
NOW
31%
Demand
22%
Money
Market
Market
19%
Time
Deposits
28%
28%
Covered Loans
6%
Owner -
Occupied
CRE 18%
Occupied
CRE 18%

Top 100 Employer, #7 Of 20 Largest
(Only Financial Institution)
6

7

8
Operating Performance
9
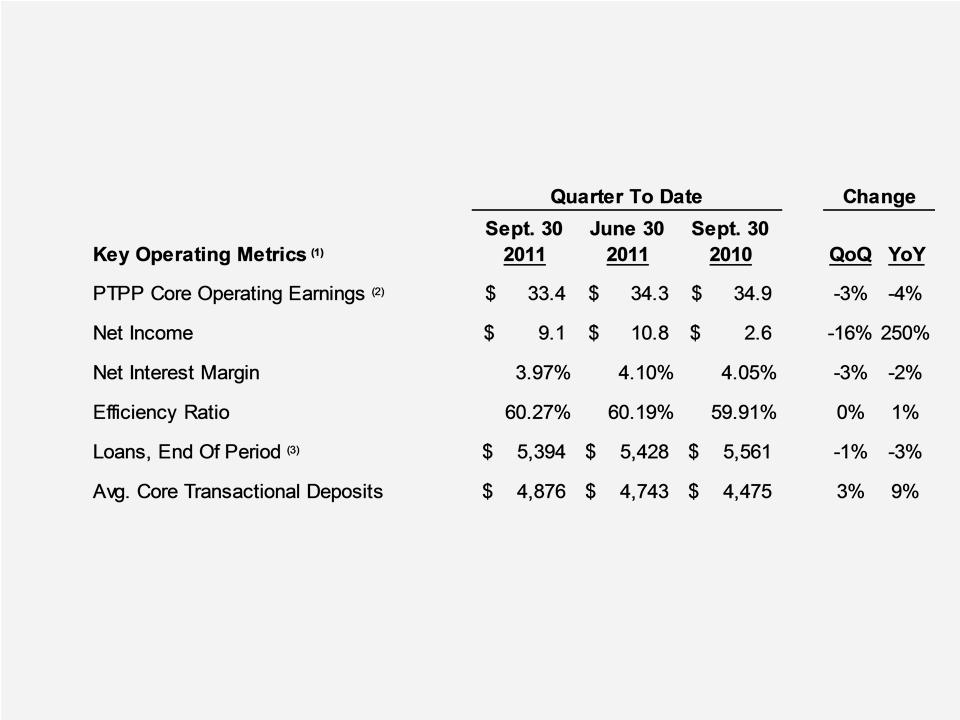
Third Quarter Results
1 Dollar amounts in millions.
2 PTPP represents Pre-Tax, Pre-Provision earnings, which is a non-GAAP financial measure. For reconciliation to GAAP measure, please refer to the appendix.
3 Includes covered loans acquired from FDIC-assisted transactions totaling $290 million, $315 million, and 396 million as of 30-Sept-11, 30-June-11, and 30-Sept-10, respectively.
Stable Earnings, Efficiency, Loans
Notable Growth In Low Cost Deposits
10
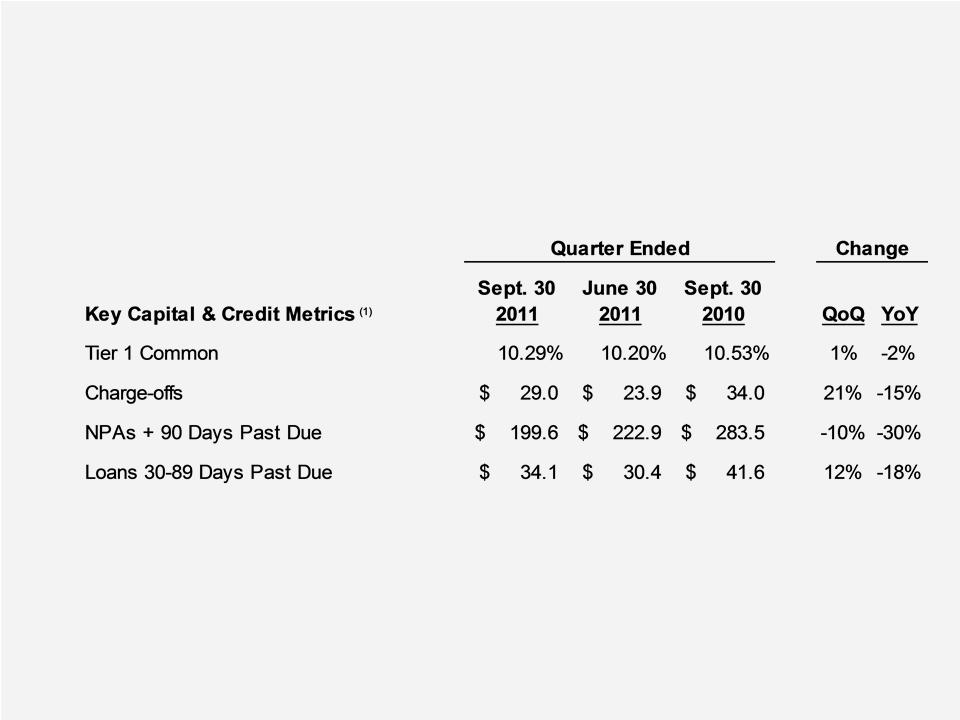
Third Quarter Highlights
Strong Capital Position
Credit Metrics Elevated But Improving
1 Dollar amounts in millions.
11
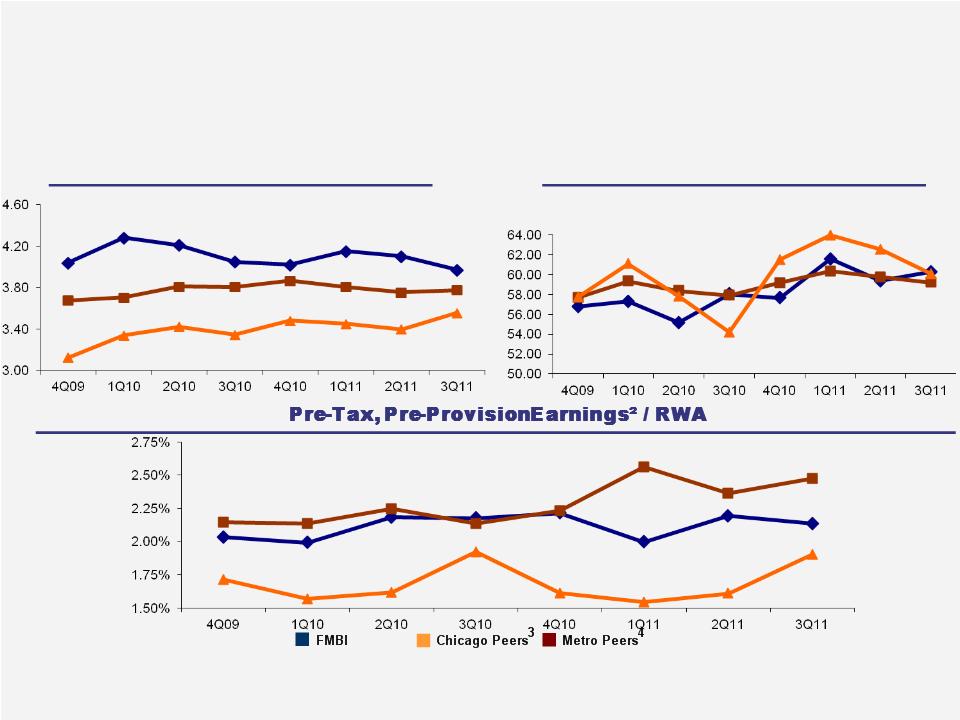
Core Business Is Solid
Source: FMBI based on internal data; peer data from SNL Financial.
¹ Equal to non-interest expense divided by fully taxable equivalent (FTE) net interest income and non-interest income. Excludes nonrecurring items; items sourced from SNL.
² This is a non-GAAP financial measure. For reconciliation to GAAP measure, please refer to the appendix.
³ Chicago Peers based on median of MBFI, OSBC, PVTB, TAYC and WTFC.
4 Metro Peers based on median of CATY, CBSH, CFR, FCF, FMER, FULT, MBFI, ONB, PVTB, SUSQ, UMPQ, VLY, WTFC, and TRMK.
Efficiency Ratio % ¹
Net Interest Margin %

12
Credit & Capital
13
Loan Portfolio Overview
Branch originated
Home equity dominated
~95% in footprint
83% of portfolio, 51% CRE
Diversified + granular
Most have personal guarantees
35% of CRE is owner-occupied
Consumer Loans = $658mm
Home Equity
8%
8%
Other
Consumer
1%
Consumer
1%
C&I
32%
32%
Office,
Retail &
Industrial
24%
Retail &
Industrial
24%
Residential
Construction
2%
Construction
2%
Commercial
Construction &
Land 3%
Construction &
Land 3%
Multi-family
6%
6%
Other CRE
16%
16%
Commercial Loans = $4.74bn
Real Estate - 1- 4
Family
3%
Family
3%
Total Loans = $5.4bn
Note: Loan data as of 30-Sept-11.
Covered 5%
Covered Loans = $290 mm
Performing Better Than Originally Expected
Losses Mitigated By Loss-Share
14
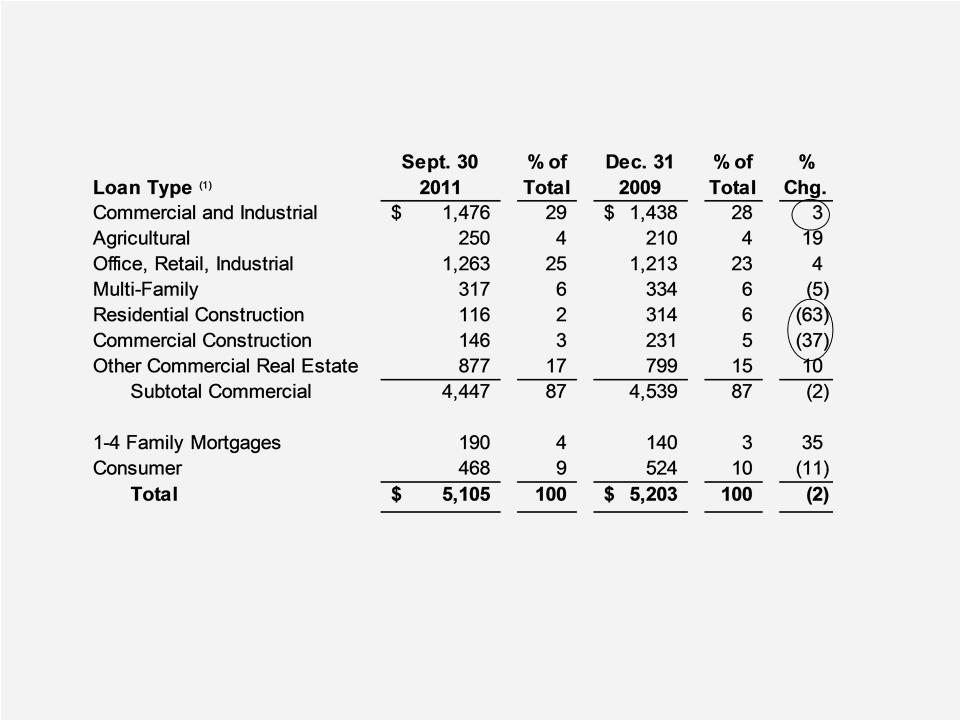
Changing Loan Mix
Note: Excludes covered loans acquired in FDIC-assisted transactions.
Greater Commercial And Owner-Occupied CRE
Reduced Construction, Re-entry To 1-4 Family
1 Dollar amounts in millions.
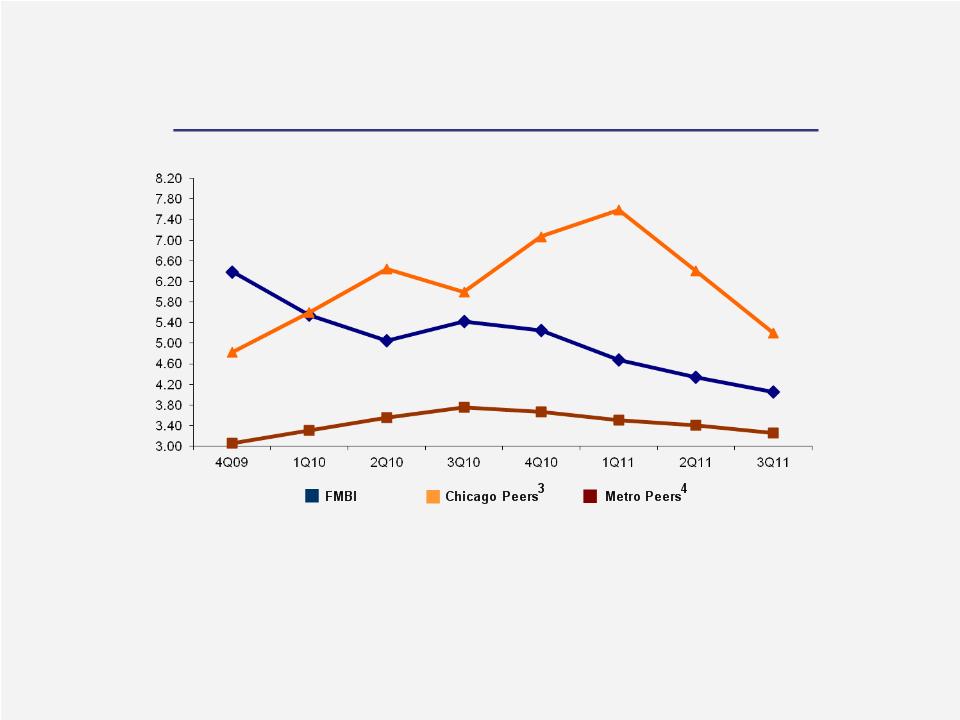
Non-Performing Asset Trends (1) (2)
Reflects Steady Progress, Influenced
By Disposition Strategy And Market
15
Source: SNL Financial.
¹ Non-performing asset trends are represented as Nonperforming Assets (NPAs) + 90 days past due loans divided by loans plus Real Estate Owned (REO).
² Graph represents problem non-performing asset (NPA) percentage.
³ Chicago Peers based on median of MBFI, OSBC, PVTB, TAYC and WTFC.
4 Metro Peers based on median of CATY, CBSH, CFR, FCF, FMER, FULT, MBFI, ONB, PVTB, SUSQ, UMPQ, VLY, WTFC, and TRMK.
NPA %

16
Addressing Reality of Credit Cycle
Conditions Slowly Improving
Real Estate Lagging
C&D Remains Stressed, Lower Exposure
Continued Focus On Reducing NPA Levels
Adverse Rated Credits Declining
Adjusting Carrying Values To Facilitate Disposition
Pursuing Multiple Strategies
Cash-Flowing Properties Offer Greater Alternatives
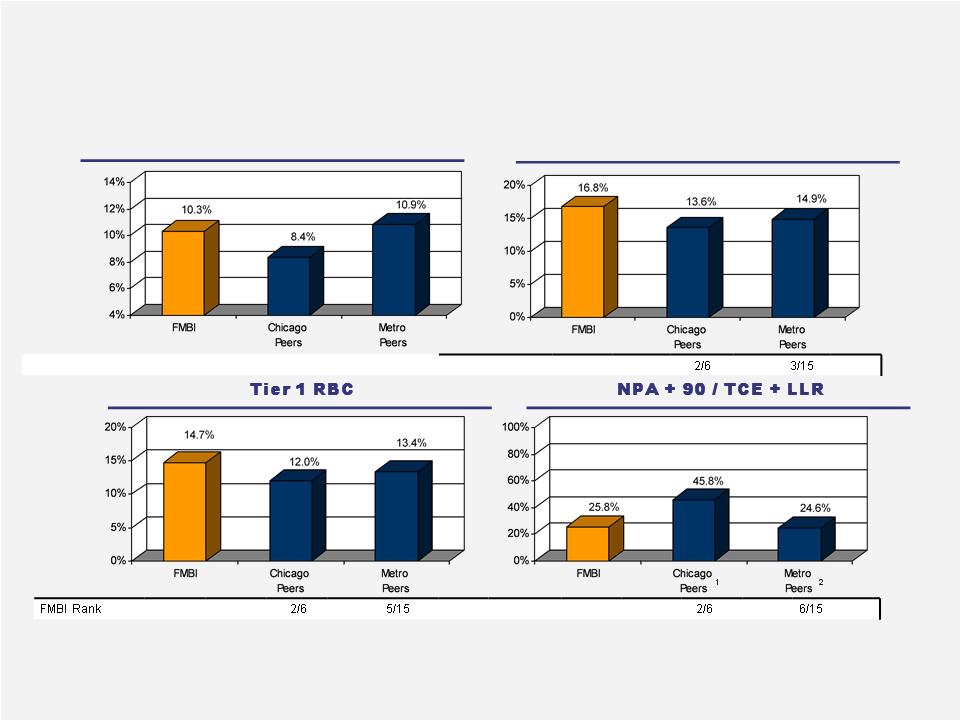
Leading Capital Foundation
First Midwest vs. Peers
First Midwest vs. Peers
Source: Company data and SNL Financial. FMBI as of 30-Sept-11.
1 Chicago Peers based on median of MBFI, OSBC, PVTB, TAYC and WTFC.
2 Metro Peers based on median of CATY, CBSH, CFR, FCF, FMER, FULT, MBFI, ONB, PVTB, SUSQ, UMPQ, VLY, WTFC, and TRMK.
Tier 1 Common
Total Capital
|
FMBI Rank
|
|
|
2/6
|
4/15
|
|
|
1
1
1
2
2
2
17

TARP Redemption
Overview and Rationale
Overview and Rationale
U.S. Treasury, in consultation with our regulators, has approved
redemption of all $193mm of TARP preferred stock
redemption of all $193mm of TARP preferred stock
Expect to fund redemption with cash on hand and proceeds from potential
debt offering(s)
debt offering(s)
Redemption of TARP capital is consistent with strategic priorities and will
allow continued focus on growing core franchise
allow continued focus on growing core franchise
Reflects strong capital position and significant improvement in credit trends
Pro forma for redemption, capital ratios will exceed current and projected
well-capitalized guidelines on standalone basis and under stress scenarios
well-capitalized guidelines on standalone basis and under stress scenarios
18

19
Opportunities & Focus

20
Continued Business Investment
Strengthening Sales
Asset-Based Lending
Mortgage Sales Platform
Wealth Management
Cash Management
Retail Product Offering
Expanding Distribution And Reach
Market Entry
Downtown Chicago, DuPage
Upgrading Internet Platform
Targeting Efficiency
Market Disruption
Environment Creates Opportunities
In Greater Chicago Area
~ 30 Failures Since Start Of 2009
Well Positioned To Benefit
Strong Capital Position
Solid Reputation: In Marketplace 70+ Years
Tenured Sales Force
Experienced Management

Successful Acquisition Growth(1)
Strategically and Financially Accretive
|
|
Date
|
Deposits (2)
|
Core (3)
|
Loans (2)
|
|
First DuPage
|
4Q09
|
$ 232
|
26%
|
$ 212
|
|
Peotone Bank And Trust
|
2Q10
|
84
|
73%
|
53
|
|
Palos Bank And Trust
|
3Q10
|
462
|
47%
|
297
|
|
Total
|
|
$ 778
|
|
$ 562
|
(1) Information as of acquisition date
(2) Dollars in millions
(3) Core comprised of demand, NOW, money market, and savings
(4) As of 30-Sept-11
In Total, Added 8 Locations, 25,000 Households,
Generated Pre-Tax Gain of $17 Million,
Retained Over 90% of Core Deposits (4)
22

23
Acquisition Opportunities
Selective Criteria
Ability To Strengthen The Company
Leverages Our Skills
Local Market Knowledge
Core Competency
Experienced And Successful Acquirer
7 Deals, $2.7bn Since 2003
FDIC-Assisted Deals Becoming More Competitive
Deals Likely Smaller
Eventual Shift From Assisted To Unassisted

24
Deposit-Only Acquisition
$185 Million In Deposits, 50% Core
In-Market Acquisition
Single Branch
Deal Price
Set At Close
Core Deposits Only
December 2011 Close

25
Going Forward

26
Positioning For Long-Term Success
Investing In Sales Organization
Lending Platform
Wealth Management
Market Expansion
Increasing Efficiency
Transitioning To Improved Credit
Investing In And Leveraging Technology
Improving Credit, Significant Capital

27
Why First Midwest
Premier Community Banking Franchise
Working Through Cycle
Solid Capital; Liquidity
Experienced Management Team
Market Opportunities Available
Positioned For Long-term Success

28
Questions?

29

30
Appendix
31
Reconciliation of Non-GAAP Measures