Attached files
| file | filename |
|---|---|
| 8-K - FORM 8-K - AMERICAN DENTAL PARTNERS INC | d8k.htm |
| EX-99.1 - PRESS RELEASE - AMERICAN DENTAL PARTNERS INC | dex991.htm |
 Second Quarter 2011
Earnings Conference Call
July 26, 2011
Exhibit 99.2 |
 2
Introductory Comments
“Safe Harbor" Statement under the Private Securities Litigation Reform Act
of 1995: With the exception of the historical information contained in this
presentation, the matters described herein contain
"forward-looking" statements that involve risk and uncertainties
that may individually or collectively affect the matters herein described,
including but not limited to the Company's risks associated with overall or
regional economic conditions, dependence upon affiliated dental practices,
contracts the affiliated practices have with third-party
payors,
government
regulation
of
the
dental
industry,
impact
of
health
care
reform,
dependence
upon
service
agreements
and
the
impact
of
any
terminations
or
potential terminations of such contracts, business interruptions, the outcome of
pending litigation and the Company's acquisition and affiliation strategy,
which are detailed from time to time in the "Risk Factors" section
of the Company's filings with the Securities and Exchange Commission,
including its annual report on Form 10-K and quarterly reports on Form
10-Q. Certain financial measures that are not in accordance with
Generally Accepted Accounting Principles are included in these slides.
Please see our press release, which is available on our website, www.amdpi.com, for a presentation of the most comparable
GAAP measures and a reconciliation of these non-GAAP measures.
|
 3
Highlights
•
Financial results for 2Q11 vs. 2Q10:
Net revenue +2%
Earnings from operations -25%
Net earnings -15%
•
Completed seven in-market acquisitions |
 4
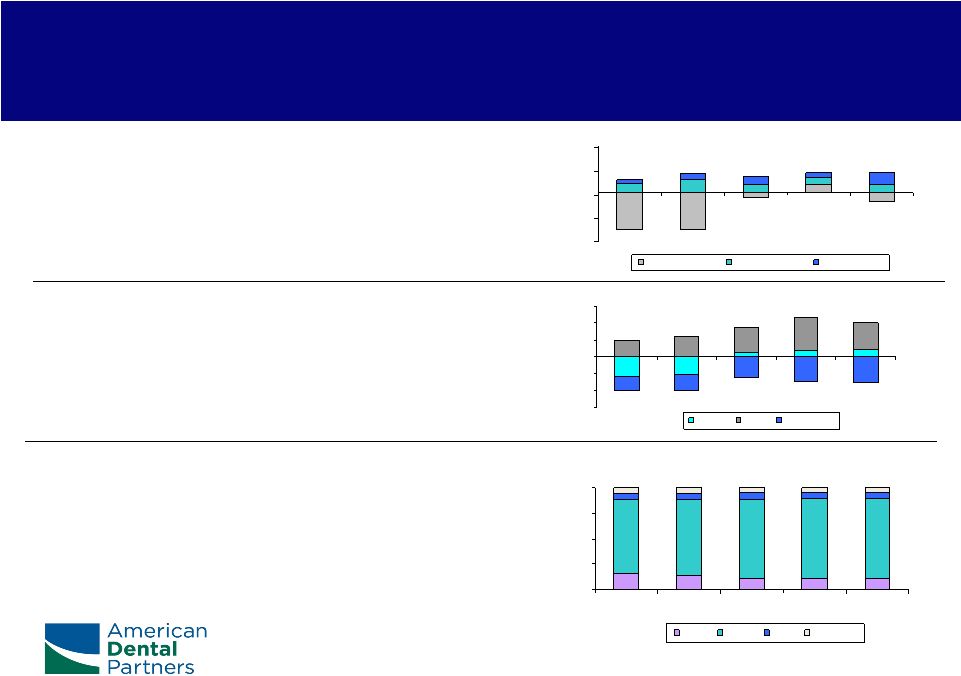
$116.0 million vs. $111.9 million +3.6%
•
+1.0% same market growth
•
+0.0% same market excluding
acquisitions growth
•
-0.7% same facility growth
Components of same market growth
•
+0.8% hours
•
+3.3% productivity per hour
•
-3.1% effectivity
(b)
Revenue mix
•
12% fee for service
•
78% PPO
•
5% managed care
•
5% Medicaid/CHIPS
Patient Revenue of Affiliated Practices (a)
Components of Same Market
-6%
-4%
-2%
0%
2%
4%
6%
2Q10
3Q10
4Q10
1Q11
2Q11
Hours
PPH
Effectivity
Same Market Growth
-4%
-2%
0%
2%
4%
2Q10
3Q10
4Q10
1Q11
2Q11
Same Facility
Development
Acquisitions
Revenue Mix
0%
25%
50%
75%
100%
2Q10
3Q10
4Q10
1Q11
2Q11
FFS
PPO
MC
Medicaid
(a)
See appendix for discussion of patient revenue of affiliated practices.
(b)
Effectivity
is the difference between full fee increases and the net fee increases actually
realized from patients and insurance companies.
|
 5
Income Statement
2011
2010
Change
Comments
Net revenue
73,953
$
72,366
$
2%
Cincinnati Dental (6/10) platform acquisition
Operating expenses:
Salaries and benefits
29,196
28,735
(23)
b.p.
Lab fees and dental supplies
11,790
10,668
120
b.p.
Lab fees 90 bp / dental supplies 30 bp
Office occupancy expenses
9,509
9,131
24
b.p.
Other operating expenses
7,682
6,878
88
b.p.
Cincinnati Dental 45 bp / professional fees 34 bp
General corporate expenses
4,160
3,669
56
b.p.
Legal fees 22 bp / stock option expense 14 bp
EBITDA
11,616
13,285
-13%
EBITDA margin
15.7%
18.4%
(265)
b.p.
Depreciation expense
3,070
2,862
20
b.p.
Amortization of intangible assets
2,559
2,464
6
b.p.
Earnings from operations
5,987
7,959
-25%
EFO margin
8.1%
11.0%
(290)
b.p.
Interest expense, net
1,525
2,726
Debt refinancing of $370K in 2011 and $615K in 2010
Earnings before income taxes
4,462
5,233
-15%
Income taxes
1,818
2,082
Effective tax rate
40.7%
39.8%
Consolidated net earnings
2,644
3,151
-16%
Noncontrolling interest
15
39
Net earnings
2,629
$
3,112
$
-16%
Diluted EPS
0.17
$
0.19
$
-14%
Diluted weighted shares outstanding
15,753
16,056
-2%
Q2
(thousands, except per share amts) |
 6
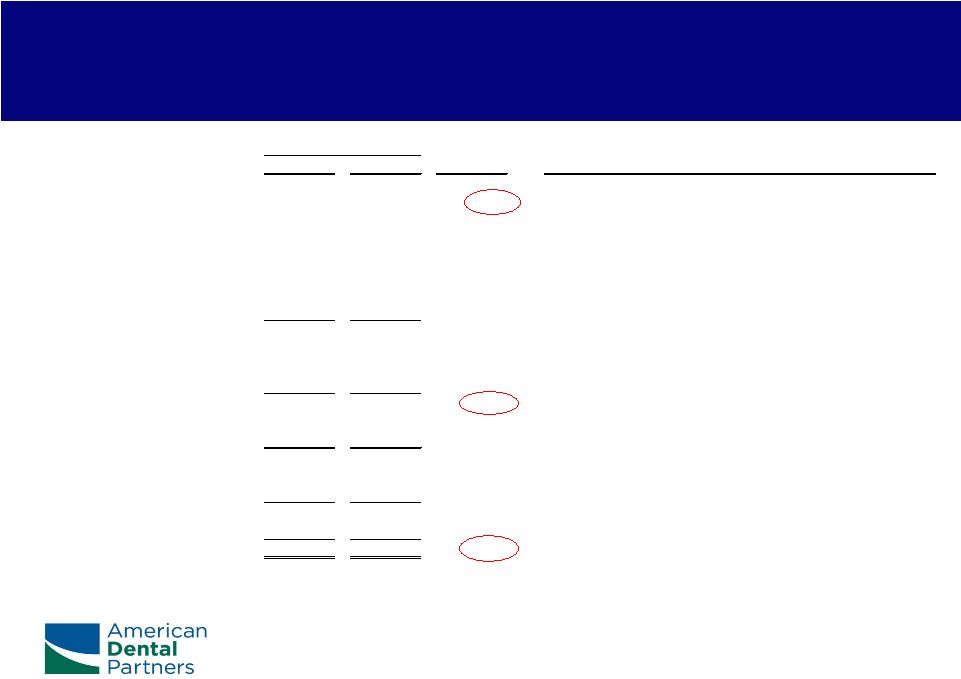
Cash Flow
Operating activities
Favorable cash interest and cash
taxes. Patient receivable DSO @
6/30/11 of 25 vs
DSO @ 6/30/10 of 26
Maintenance capital expenditures
Includes 16 Improvis EDR
implementations
Acquisitions
Completed 7 in-market acquisitions
representing $3.3MM annualized
patient revenue
2Q11
2Q10
Cash flow from operating activities
Net income and non-cash items
11,107
$
10,038
$
Working capital items
797
(8)
Cash flow from operating activities
11,904
10,030
Maintenance capital expenditures
(3,450)
(801)
Free cash flow before growth investments
8,454
9,229
Growth capital expenditures
(1,019)
(1,307)
Acquisitions
(2,563)
(19,798)
Cash flow before financing activities
4,872
$
(11,876)
$
(thousands) |
 7
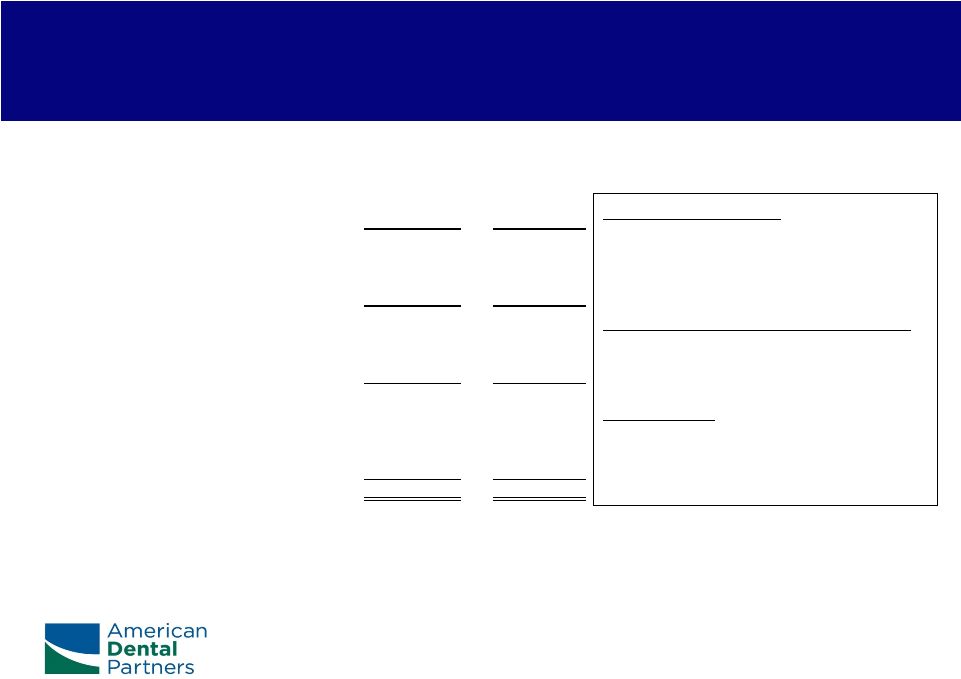
Capitalization
Debt to Total Capitalization
35%
36%
34%
32%
Leverage
•
$87 million debt
•
1.8x debt/EBITDA (bank
compliance calculation)
•
$60 million available for borrowing
under credit facility (bank
compliance calculation)
Senior Indebtedness
•
Renegotiated May 2011
•
$180MM facility
•
May 2016 maturity
•
Reduced borrowing rates
•
Increased share repurchase
•
Participants
•
Bank of America
•
KeyBank
•
RBS Citizens
•
Wells Fargo
•
Toronto Dominion
•
Union Bank
30%
($ millions)
$0
$100
$200
$300
Jun '10
Sep '10
Dec '10
Mar '11
Jun '11
Equity
Debt |
 8
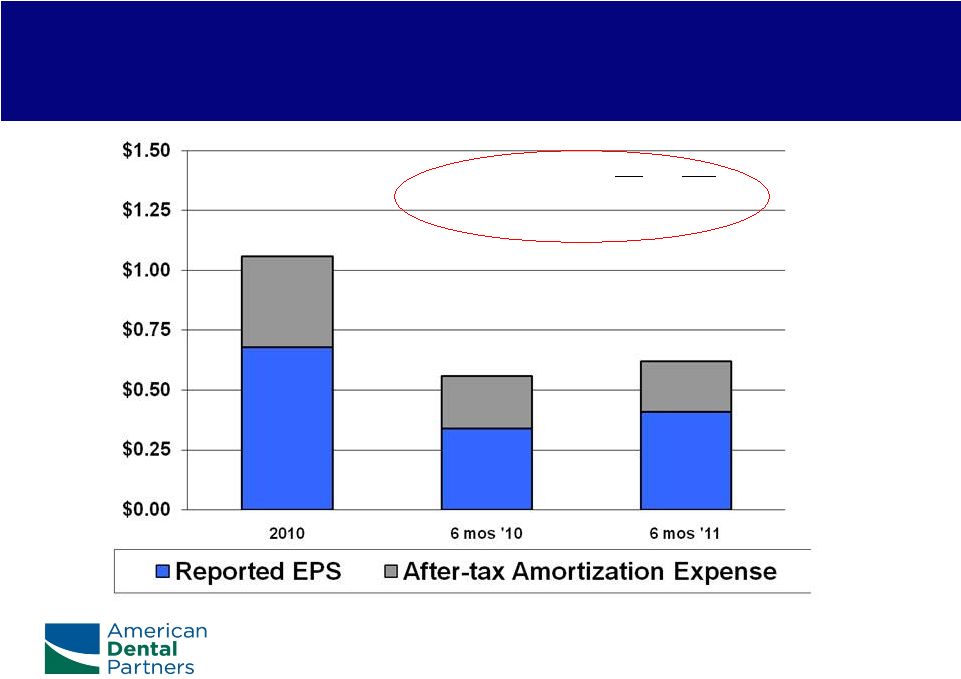
(a) See Appendix for reconciliation of non-GAAP items.
(b) Calculated at $13.25 share price and trailing twelve months ended June 30, 2011
financial results. Diluted Earnings per Share
}+56%
}+42%
}+65%
(a)
TTM
PE(b)
Diluted Reported EPS
0.75
18x
Diluted non-GAAP EPS (a)
1.12
12x
+49%
-33% |
 9
Return on Market Value
2010
Jun '10
Jun '11
TTM
Cash flow from operations
36.3
$
17.7
$
25.4
$
44.0
$
Maintenance capital expenditures
4.7
1.6
5.4
8.5
$
Free cash flow
31.6
$
16.1
$
20.0
$
35.5
$
Diluted shares outstanding
15.8
Share price
13.25
$
Market value of equity
209.4
$
Cash flow from operations/market value equity
21.0%
Free cash flow/market value equity
17.0%
6 Months
(millions, except per share amount) |
 10
Operating Comments
•
Financial results negatively impacted by:
Economy (employment and retail spending both weak)
AHCCCS reimbursement decrease
Texas pediatric Medicaid performance:
9 facilities operational in 2Q11 as compared to 4 facilities in 2Q10
Facility EBITDA loss of $59,000 in 2Q11 as compared to loss of
$126,000 in 1Q11
Facilities operational in 2Q10 had EBITDA of $77,000 in 2Q11 as
compared to a loss of $212,000 in 2Q10
Anticipate 3 de novos
in 3Q11 and 5 de novos
in 4Q11 |
 Operating Comments
•
Specialty care performance:
14% patient revenue growth
Continuing reinvesment in the business:
Technology initiatives –
42 EDR implementations the second half
of 2011 and 126 facilities utilizing EDR by the end of the year
De novos –
15 approved for construction and 9 currently being
evaluated
Acquisitions –
in-market pipeline robust |
 12
Appendix |
 13
Non-GAAP Financial Measures
•
•
Patient Revenue of the Affiliated Practices
•
Appendix
This presentation includes non-GAAP financial measures. In accordance with the requirements
of Regulation G of the Securities and Exchange Commission, please see the attached financial
tables for a presentation of the most comparable GAAP measures, the reconciliation to the
nearest GAAP measure and all additional reconciliations required by Regulation G.
The Company believes non-GAAP financial measures, such as adjusted net earnings and adjusted net
earnings excluding service agreement amortization, are important financial measures for
understanding its financial performance. The Company incurs significant amortization
expense related to its service agreements in contrast to many companies, in the same and other
industries, that do not amortize intangibles based on authoritative literature for goodwill and other intangible assets.
Expenses related to the Company’s debt refinancing and professional fees related to the
Company’s acquisitions have also been excluded from the Company’s non-GAAP
financial measures. The Company believes these items should be presented separately due
to their magnitude and non-recurring impact to the Company’s ongoing operations. The primary limitations
associated with the Company’s use of non-GAAP measures are that these measures may not be
directly comparable to the amounts reported by other companies. Management compensates
for these limitations by providing a detailed reconciliation of the non-GAAP financial
measures to the most directly comparable GAAP measures in this presentation.
The Company does not consolidate the financial statements of the practices affiliated with the
Company by means of service agreements with its financial statements. Patient revenue of
the affiliated practices is, however, a financial measure used by the Company’s
management to monitor operating performance and to help identify and analyze trends of the affiliated
practices that may affect the Company’s business. Most of the operating expenses incurred by the
Company, pursuant to the service agreements, are on behalf of the affiliated practices in the
operation of dental facilities. These expenses are significantly affected by the patient
revenue of the affiliated practices. |
 14
Non-GAAP EPS Reconciliation
2010
2011
2010
Net earnings (as reported)
10,339
$
2,629
$
3,112
$
Add: Write-off of expenses associated with debt refinancing, net of tax (a)
370
219
370
Add: Expenses associated with Cincinnati Dental Services acquisition, net of tax (a)
203
-
123
Adjusted net earnings
10,912
2,848
3,605
Add: Amortization related to service agreements, net of tax (a)
5,960
1,506
1,475
Adjusted net earnings excluding service agreement amortization
16,872
$
4,354
$
5,080
$
Weighted average diluted shares outstanding
15,965
15,753
16,056
Diluted adjusted net earnings per share
0.68
$
0.18
$
0.22
$
Diluted adjusted net earnings excluding service agreement amortization per share
1.06
$
0.28
$
0.32
$
(a) Tax effected at effective tax rate in the period reported.
Q2
(thousands, except per share amt) |
 15 |