Attached files
| file | filename |
|---|---|
| 8-K - FORM8K - DYCOM INDUSTRIES INC | form8-k.htm |
| EX-99.1 - EXHIBIT991 - DYCOM INDUSTRIES INC | exhibit99-1.htm |
| EX-99.3 - EXHIBIT993 - DYCOM INDUSTRIES INC | exhibit99-3.htm |
Exhibit 99.2

3rd Quarter Presentation
May 25, 2011

1
Participants
|
Steven E. Nielsen
President & Chief Executive Officer Timothy R. Estes
Chief Operating Officer
H. Andrew DeFerrari
Chief Financial Officer Richard B. Vilsoet
General Counsel |

2
Forward-Looking Statements and
Non-GAAP Information
Non-GAAP Information
Forward-Looking Statements and
Non-GAAP Information
Non-GAAP Information
Fiscal 2011 third quarter results are unaudited. This presentation contains “forward-looking statements”
which are statements relating to future events, future financial performance, strategies, expectations,
and competitive environment. All statements, other than statements of historical facts, contained in this
presentation, including statements regarding our future financial position, future revenue, prospects,
plans and objectives of management, are forward-looking statements. Words such as “believe,”
“expect,” “anticipate,” “estimate,” “intend,” “forecast,” “may,” “should,” “could,” “project” and similar
expressions, as well as statements in future tense, identify forward looking statements. You should not
read forward looking statements as a guarantee of future performance or results. They will not
necessarily be accurate indications of whether or at what time such performance or results will be
achieved. Forward looking statements are based on information available at the time those statements
are made and/or management’s good faith belief at that time with respect to future events. Such
statements are subject to risks and uncertainties that could cause actual performance or results to differ
materially from those expressed in or suggested by the forward looking statements. Important factors
that could cause such differences include, but are not limited to factors described under Item 1A, “Risk
Factors” of the Company’s Annual Report on Form 10-K for the year ended July 31, 2010, and other
risks outlined in the Company’s periodic filings with the Securities and Exchange Commission (“SEC”).
The forward-looking statements in this presentation are expressly qualified in their entirety by this
cautionary statement. Except as required by law, the Company may not update forward-looking
statements even though its situation may change in the future.
This presentation includes certain “Non-GAAP” financial measures as defined by SEC rules. As required
by the SEC we have provided a reconciliation of those measures to the most directly comparable GAAP
measures on the Regulation G slides included on slides 11 through 13 of this presentation.
by the SEC we have provided a reconciliation of those measures to the most directly comparable GAAP
measures on the Regulation G slides included on slides 11 through 13 of this presentation.

3
Q3-2011 Overview
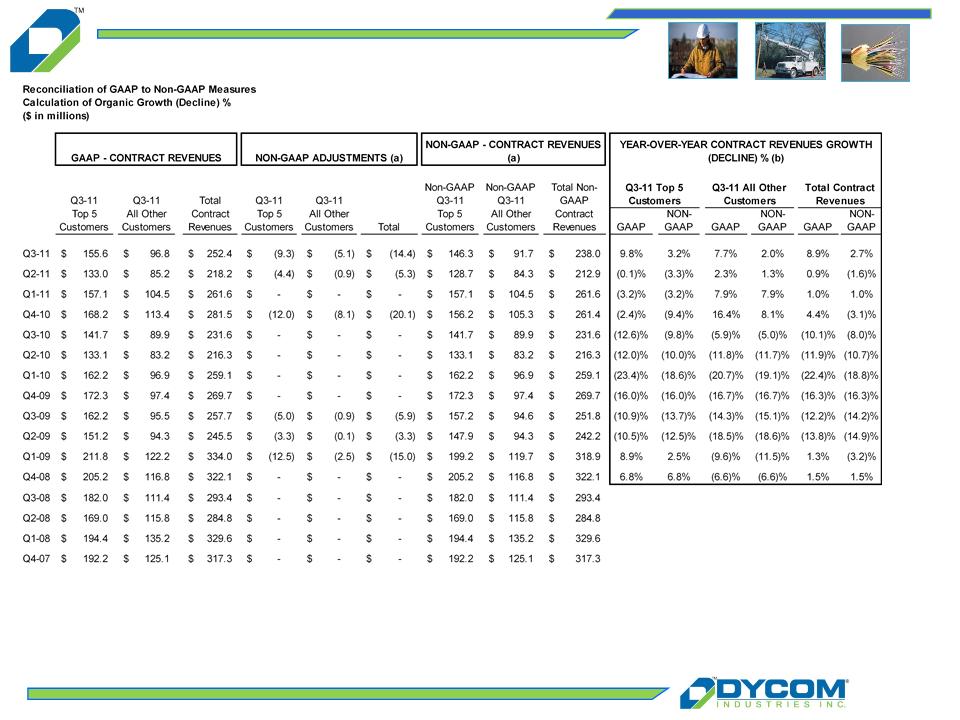
n Contract revenue of $252.4 million grew organically 2.7% year-over-
year after adjusting for revenues from acquired companies
year after adjusting for revenues from acquired companies
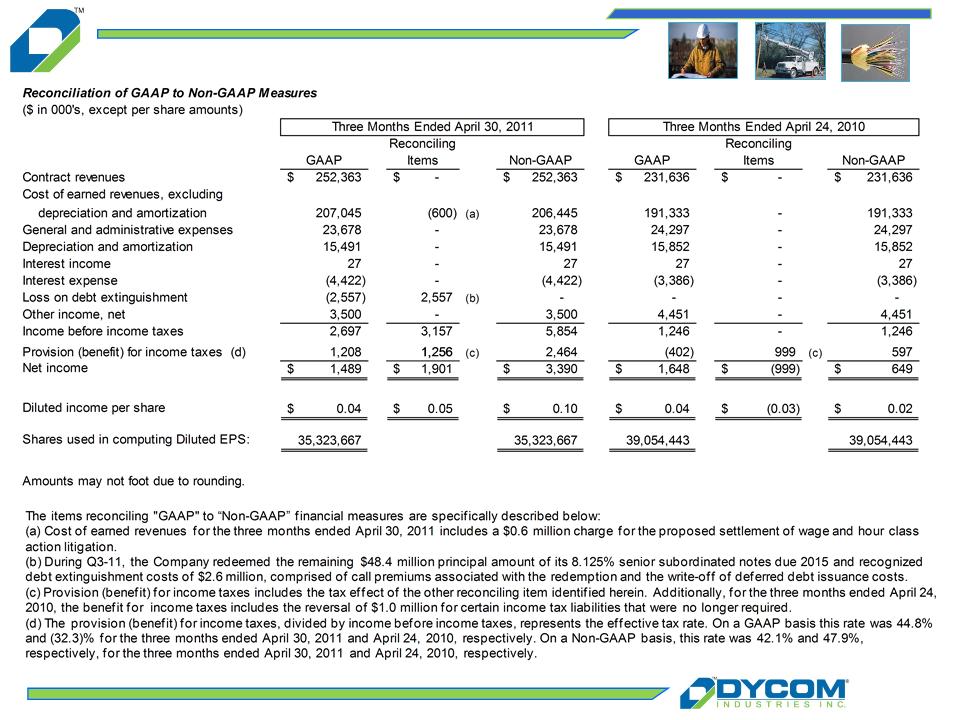
n Non-GAAP income of $0.10 per share compared to $0.02 per share in
the prior year
the prior year
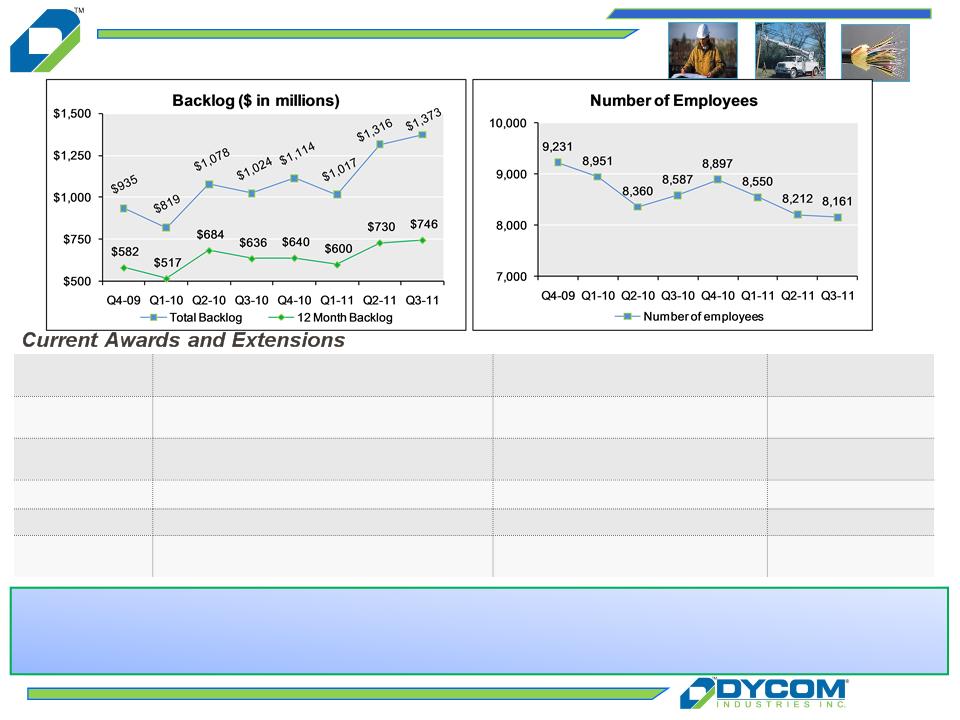
n Backlog increased sequentially to $1.373 billion
n Repurchased 1,278,100 shares at an average price of $16.63 per share
for a total of $21.3 million during Q3-11; Additional $20 million
authorized for share repurchases over next 18 months
for a total of $21.3 million during Q3-11; Additional $20 million
authorized for share repurchases over next 18 months
Note: See “Regulation G Disclosure” slides 11-12 for a reconciliation of GAAP to Non-GAAP financial measures.

4
Revenue Summary
n Top 5 customers from Q3-11 represented 61.6% of
revenue in Q3-11 and 61.2% of revenue in Q3-10
revenue in Q3-11 and 61.2% of revenue in Q3-10
n Windstream became Dycom’s fifth largest customer
in Q3-11 with organic growth of 47.1%
in Q3-11 with organic growth of 47.1%
n Organic revenue growth of 2.7% on an overall basis,
with revenue from Top 5 customers up 3.2% and
combined revenue from all other customers up 2.0%
with revenue from Top 5 customers up 3.2% and
combined revenue from all other customers up 2.0%
n Recently acquired companies, Communication
Services and NeoCom, contributed aggregate
revenues of $14.4 million during the quarter
Services and NeoCom, contributed aggregate
revenues of $14.4 million during the quarter
* For comparison purposes, CenturyLink includes combined revenues from CenturyTel, Inc., Qwest Communications International, Inc. and Embarq Corporation for each period
presented.
presented.
Note: See “Regulation G Disclosure” slide 11 for a reconciliation of GAAP to Non-GAAP financial measures.
5
Backlog and Awards
|
Customers
|
Description
|
Area
|
Approximate Term
(in years) |
|
nWindstream
|
Engineering Services for Broadband Stimulus
|
Iowa, Missouri, New York,
Pennsylvania |
2
|
|
nWindstream
|
Construction Services for Broadband Stimulus
|
Kentucky, Georgia, New Mexico,
Oklahoma, Texas |
2
|
|
nVerizon
|
Construction and Maintenance Services
|
Massachusetts
|
5
|
|
nCharter
|
Construction and Maintenance Services
|
Missouri
|
1
|
|
nVarious
|
Rural broadband
|
Washington, Kentucky, South
Carolina, Georgia, Missouri, Virginia |
1
|
Broadband stimulus backlog at $80 million with activity accelerating
Currently expect to perform at least $175 million in broadband related stimulus projects

6
Summary Results
|
Fully Diluted EPS -
Non-GAAP |
|
|
Q3-10
|
Q3-11
|
|
$0.02
|
$0.10
|
Note: See “Regulation G Disclosure” slides 11-12 for a reconciliation of GAAP to Non-GAAP financial measures.
8.9%
Overall growth
2.7%
Organic change

7
Selected Information
(a) See “Regulation G Disclosure” slide 12 for a reconciliation of GAAP to Non-GAAP financial measures.
(b) Amounts may not foot due to rounding.
|
|
Q3-11
|
Q3-10
|
Change (b)
|
|
|
($ in millions)
|
||||
|
Contract Revenues
|
$252.4
|
$231.6
|
$20.7
|
|
|
Cost of Earned Revenues
-Non-GAAP(a) |
$206.4
81.8%
|
$191.3
82.6%
|
$15.1
(0.8)%
|
§Cost of earned revenues as a percentage of
revenue decreased primarily as a result of improved labor efficiency, partially offset by a 40 basis point increase in fuel costs from higher gasoline prices |
|
General & Administrative
|
$23.7
9.4%
|
$24.3
10.5%
|
$(0.6)
(1.1)%
|
§General and administrative expenses declined
from reduced payroll and professional fees, offset by incremental expenses of Q2-11 acquisitions |
|
Depreciation &
Amortization |
$15.5
6.1%
|
$15.9
6.8%
|
$(0.4)
(0.7)%
|
§Depreciation declined as a result of asset sales
and the impact of assets becoming fully depreciated |
|
Interest expense
|
$4.4
1.8%
|
$3.4
1.5%
|
$1.0
0.3%
|
§Interest expense increased from higher debt
balances outstanding, offset by reduced interest rate on long-term borrowings |
|
Other Income, Net
|
$3.5
1.4%
|
$4.5
1.9%
|
$(1.0)
(0.5)%
|
§Other income declined with fewer assets being
sold in the current period |
8
Cash Flow and Liquidity
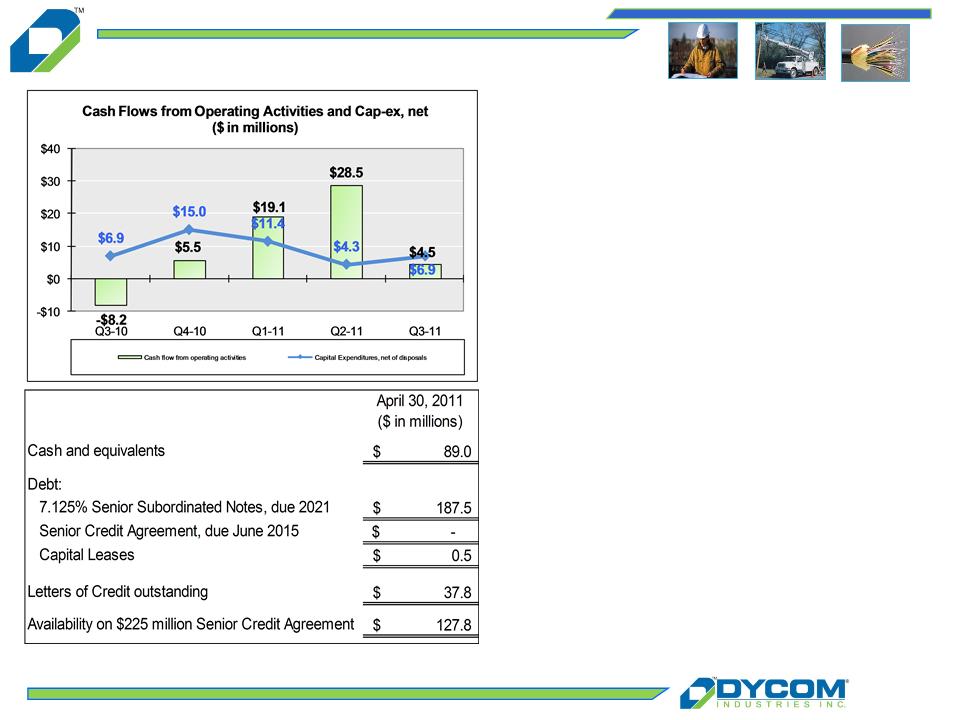
n Operating cash flows grew year-over-year
reflecting improved operating results
reflecting improved operating results
n Capital expenditures, net of disposals,
were at $6.9 million
were at $6.9 million
n 1,278,100 shares repurchased for $21.3
million, or $16.63 per share
million, or $16.63 per share
n Availability on Senior Credit agreement
increased sequentially to $127.8 million
increased sequentially to $127.8 million

9
Summary
n Experienced the effects of an improving environment
n Broadband stimulus awards accelerated throughout the quarter
n Deployment of new technologies by cable operators which enable
them to increase the effective bandwidth of their networks
them to increase the effective bandwidth of their networks
n Increasing number of industry participants aggressively extending
or deploying fiber networks to provide wireless backhaul services
or deploying fiber networks to provide wireless backhaul services
n Equity capitalization, after our share repurchases, is intended to
significantly benefit our shareholders
significantly benefit our shareholders

10
Looking Ahead
n Organic revenue which grows modestly generating high single digit to low
double digit total growth
double digit total growth
n Margins and earnings which increase faster than revenues
n Solid and growing cash flows dedicated to accretive acquisition opportunities
and share repurchases as valuation and projected returns direct
and share repurchases as valuation and projected returns direct
n Increasingly confident that trends are improving for a sustained period
Q4 - 2011:
n Organic revenue which grows mid single digits and total revenue which grows
10%-15% year-over-year, after adjusting for last year’s 14 week quarter
10%-15% year-over-year, after adjusting for last year’s 14 week quarter
n Gross margins which improve year over year
n General and administrative expenses influenced by performance based
incentive plans resulting in an approximate 10% sequential quarterly increase
incentive plans resulting in an approximate 10% sequential quarterly increase
n Depreciation and amortization which slightly increases on a quarterly
sequential basis as a result of increasing capital expenditures
sequential basis as a result of increasing capital expenditures
n Other income which modestly increases year-over-year
11
Appendix: Regulation G Disclosure
Amounts may not foot due to rounding.
(a) Non-GAAP adjustments in Q3-11 and Q2-11 reflect revenues from businesses acquired during Q2-11. Non-GAAP adjustments in Q4-10 result from the Company’s
52/53 week fiscal year. The Q4-10 Non-GAAP adjustments reflect the impact of the additional week in Q4-10 and are calculated by dividing contract revenues by 14
weeks. The result, representing one week of contract revenues, is subtracted from the GAAP-contract revenues to calculate 13 weeks of revenue for Q4-10 on a Non-
GAAP basis for comparison purposes. The Non-GAAP adjustments in Q3-09, Q2-09, and Q1-09 reflect storm restoration revenues recognized during those periods.
(b) Year-over-year growth (decline) percentage is calculated as follows: (i) revenues in the quarterly period less (ii) revenues in the comparative prior year quarter
period; divided by (ii) revenues in the comparative prior year quarter period.
period; divided by (ii) revenues in the comparative prior year quarter period.
12
Appendix: Regulation G Disclosure

13

3rd Quarter Presentation
May 25, 2011