Attached files
 1
2011 First-Quarter
Earnings Results
April 21, 2011
Exhibit 99.3 |
 2
Introduction
Unless otherwise stated, we will be talking about results for the first-
quarter 2011 and comparing them with the same period in 2010
References to PMI volumes refer to PMI shipment data, unless
otherwise stated
Industry volume and market shares are the latest data available from
a number of internal and external sources
Acquisitions, for the purposes of this presentation, also include our
business combination with Fortune Tobacco Corporation in the
Philippines
Organic volume refers to volume excluding acquisitions
Net revenues exclude excise taxes
OCI stands for Operating Companies Income, which is defined as
operating income before general corporate expenses and the
amortization
of
intangibles.
OCI
growth
rates
are
on
an
adjusted
basis
which excludes asset impairment, exit and other costs
Data tables showing adjustments to net revenues and OCI for
currency, acquisitions, asset impairment, exit and other costs, free
cash flow calculations, adjustments to EPS, and reconciliations to
U.S. GAAP measures are at the end of today’s web cast slides and
are posted on our web site |
 3
Forward-Looking and Cautionary Statements
This presentation and related discussion contain statements that, to
the extent they do not relate strictly to historical or current facts,
constitute
“forward-looking
statements”
within
the
meaning
of
the
Private Securities Litigation Reform Act of 1995. Such forward-looking
statements are based on current plans, estimates and expectations,
and are not guarantees of future performance. They are based on
management’s expectations that involve a number of business risks
and uncertainties, any of which could cause actual results to differ
materially from those expressed in or implied by the forward-looking
statements. PMI undertakes no obligation to publicly update or revise
any forward-looking statements, except in the normal course of its
public disclosure obligations. The risks and uncertainties relating to
the forward-looking statements in this presentation include those
described
under
Item
1A.
“Risk
Factors”
in
PMI’s
Form
10-K
for
the
year ended December 31, 2010, filed with the Securities and
Exchange Commission |
 4
First-Quarter 2011 Results
Very strong financial performance:
The events in Japan and North Africa only caused
temporary disruptions that were not material to our
financial results
Q1, 2011 Results
(a)
Net Revenues
+2.7%
Adjusted OCI
+8.0%
Adjusted Diluted EPS
+14.4%
(a)
All financial growth rates exclude currency. Net revenues and OCI growth rates also
exclude acquisitions Source: PMI Financials |
 5
First-Quarter 2011 Results
Volume performance:
Lower organic volume driven by Japan, Mexico, Pakistan,
Spain and Ukraine, as well as events in North Africa
All other markets, representing over 80% of our volume
base, grew at an organic rate of 1.0%
Q1, 2011 Results
Cigarette Volume
+1.6%
Organic Cigarette Volume
-3.3%
Source: PMI Financials |
 6
2011 EPS Guidance
Reported diluted EPS guidance for 2011 is being raised
by 20 cents to $4.55 to $4.65
Compared to an adjusted diluted EPS of $3.87 in 2010,
this corresponds to a growth rate of approximately 17.5%
to 20% at prevailing exchange rates, and approximately
12.5% to 15% excluding currency
Ten cents of the increased guidance are attributable to
more favorable prevailing exchange rates
Ten cents of the increased guidance are attributable to an
improved business outlook, partly offset by investments in
marketing and sales and slightly more conservative
pricing assumptions
Source: PMI forecasts |
 7
Japan
Japan Tobacco facing significant supply disruptions
in its home market
PMI has sufficient in-market inventories
Difficult to determine extent of likely uplift in PMI
sales
Second quarter will allow us to have better read on
total consumption levels and extent to which
consumers return to prior brand of choice
Source: PMI estimates |
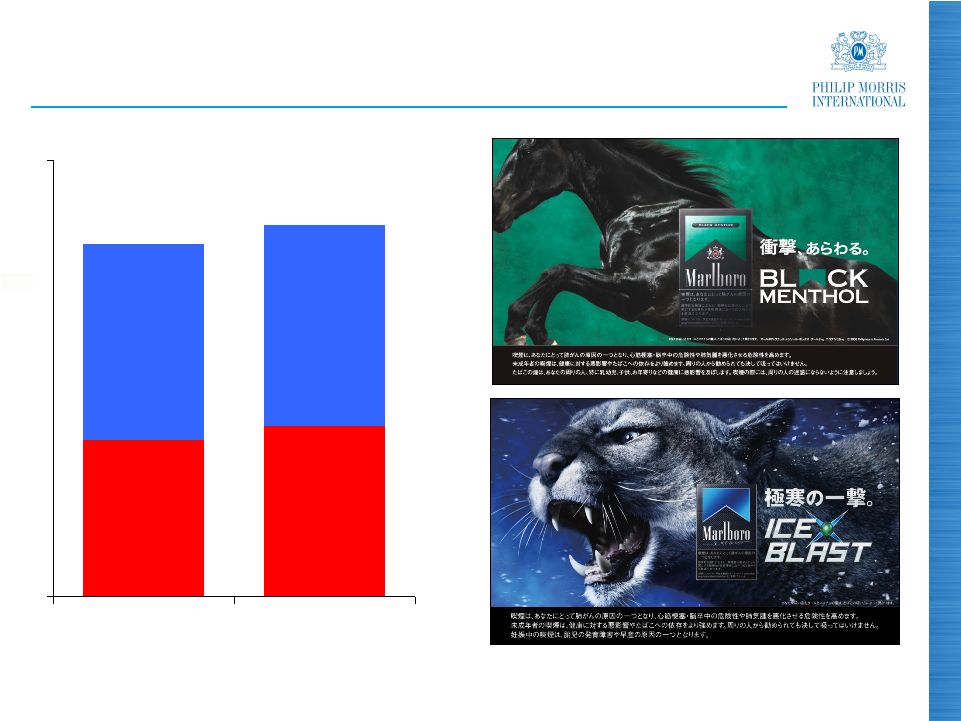 8
Japan -
PMI Market Shares
Source: Tobacco Institute of Japan
(%)
Total PMI
Marlboro
2010
2011
Other
PMI
Brands
10.8
11.7
25.6
24.2
0
30
Q1
Q1 |
 9
Pricing Assumptions
Continued economic difficulties and consumer
affordability issues in certain markets, such as Greece,
Spain and Ukraine
Reaction to competitive price moves, such as selective
tax absorption, brand repositioning, discounting and
delays in the implementation of tax-driven price increases
Pricing will nevertheless remain the key driver of PMI
profitability growth and our 2011 pricing variance is
expected to surpass the level achieved last year |
 10
Asia Region
PMI regional volume increased by 14.0% in Q1, driven by
the business combination in the Philippines, though down
1.7% on an organic basis
Marlboro
volume in Asia increased by 0.7% overall and by
5.5% excluding Japan
Strong volume and share performance in Indonesia,
Korea and the Philippines
Excellent regional financial results with net revenues up
by 11.6% and adjusted OCI 34.0% higher, both excluding
currency and acquisitions
Source: PMI Financials, PMI estimates and Hankook
Research |
 11
Australia -
Plain Packaging
The Australian Government has released an exposure
draft of the bill, which would mandate plain packaging in
2012
There is a public consultation through June 6
PMI is firmly opposed to such a measure because:
-
there is no credible evidence that it will reduce smoking rates
-
it may undermine public health objectives by lowering prices and
increasing illicit trade
-
it will violate intellectual property protections and breach
international trade obligations
PMI will consider all appropriate options, including legal
action, to oppose the plain packaging proposal and
protect its valuable brands |
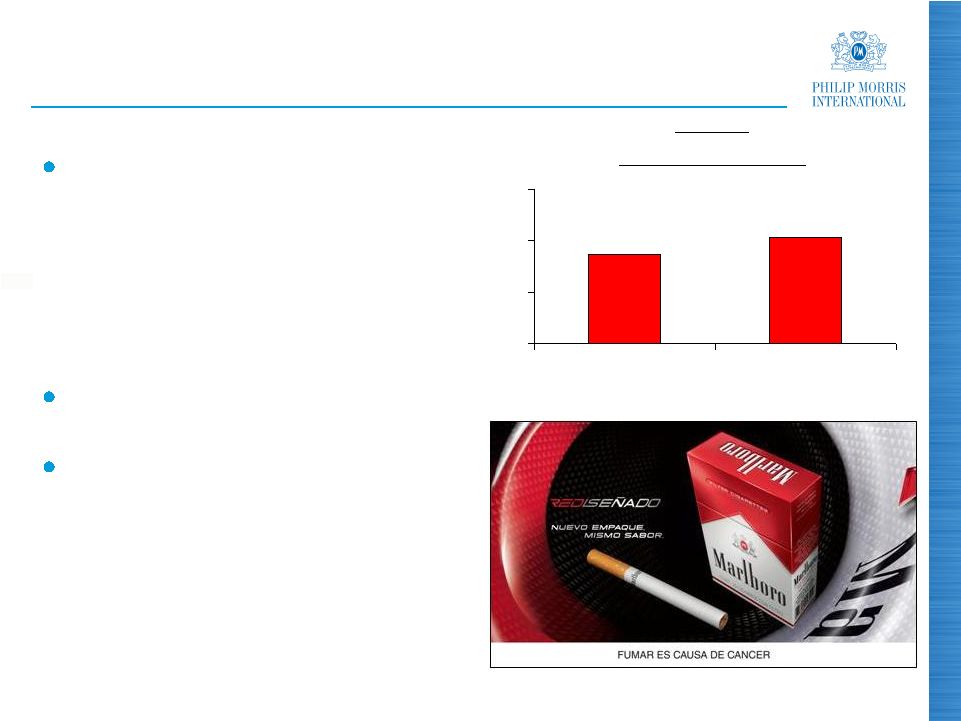 12
Latin America & Canada Region
Impact of disruptively large
tax/price increase in Mexico
(+8 Pesos/pack of 20):
-
Underlying industry volume
decline estimated at 14%
-
Resilience of Marlboro
and
Benson & Hedges
Marlboro
market share up in all
key markets in the Region
Adjusted regional OCI up 15.7%
and adjusted OCI margin 1.9
points higher in the first quarter,
both excluding currency
Source: PMI Financials and PMI estimates
(%)
2010
2011
Marlboro
Mexico -
Market Share
48.7
50.3
40
45
50
55
Q1
Q1 |
 13
EU Region
Weak economies in Southern Europe driving industry
volume decline and consumer downtrading
Situation exacerbated in Spain by the introduction of a
total indoor smoking ban, higher prices, a reduction in
trade inventories and an increase in contraband. Full-year
decline forecast at around 15%
Greece continued to be a drag on PMI results in Q1,
though comparables will be easier as of Q2
Industry volume in EU Region was down by 2.5%,
excluding Spain
Source: PMI Financials and PMI estimates |
 14
EU Region
PMI regional net revenues down 3.5% and adjusted OCI
2.3% lower in Q1, excluding currency, due to lower
industry volume and a Regional share decline
Structural excise tax improvements in 2011 in France,
Greece, the Netherlands, Sweden and the UK
Multi-year excise tax programs in Germany and the
Czech Republic
PMI has announced a 20 Euro cents per pack of 19
cigarettes price increase in Germany across its portfolio
PMI cigarette market share in Germany up 0.5 points in
Q1 and fine cut market share up 0.9 points
Source: PMI Financials and PMI estimates |
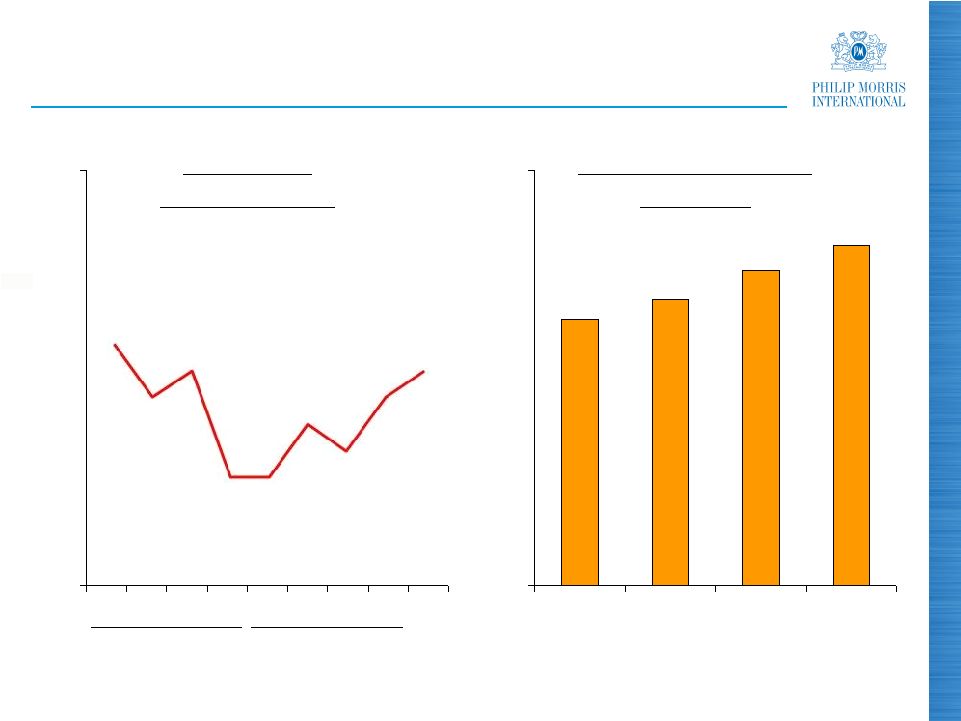 15
EU Region
(a) Young Adult Smokers: Legal Age (minimum 18)-24 years old; 12 mm: 12 months
moving average (b) Through end February
Source: PMI estimates and PMI Market Research
(%)
2008
(%)
2009
2010
2011
France
–
Philip
Morris
brand
Market Share
2009
2010
2011
Italy –
Marlboro
YAS 12 mm Share
(a)
6.4
6.9
7.6
8.2
0
10
Q1
Q1
Q1
Q1
34
29
33
25
40
1
2
3
4
1
2
3
4
Q1
(b) |
 16
EEMA Region
PMI volume decreased by 0.8% driven by Ukraine and
North Africa, partly offset by favorable comparisons in
Romania and Turkey
Strong premium portfolio performance with higher
Marlboro
and Parliament volumes
Russian market impacted by rampant food price inflation
and cigarette price increases. Moderate industry volume
decline now expected in 2011 and only modest consumer
uptrading
PMI’s slight volume and share decline in Russia in Q1,
2011, attributable to the timing of price increases and
increased price gaps at the bottom of the market
Source: PMI Financials and A.C. Nielsen |
 17
EEMA Region
Market contraction and polarization in Ukraine with
premium and super-low segments growing
PMI share loss of 3.6 points in Ukraine through end
February, driven by under-representation at the bottom
end of the market
PMI volume increased by 10.4% in Turkey during the first
quarter, driven by Parliament, Muratti
and L&M
Regional net revenues and adjusted OCI, both excluding
currency, were down 1.7% and 4.4% respectively, in the
quarter
Excluding impact of tax/price windfalls in Q1, 2010,
Regional adjusted OCI would have been up at double
digit rate
Source: PMI Financials and A.C. Nielsen |
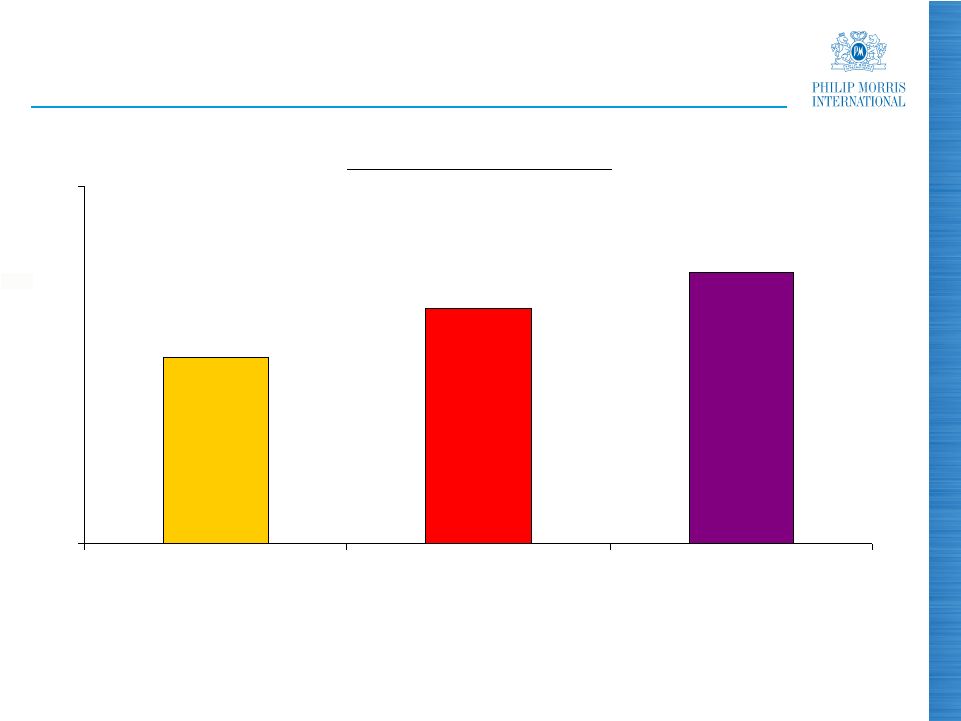 18
PMI Market Share Developments
(%)
Top 30 PMI OCI Markets
Note: Historical data adjusted for pro-forma inclusion of business combination
with Fortune Tobacco in the Philippines Source: PMI estimates
34.6
35.3
35.8
32
37
Q1, 2009
Q1, 2010
Q1, 2011 |
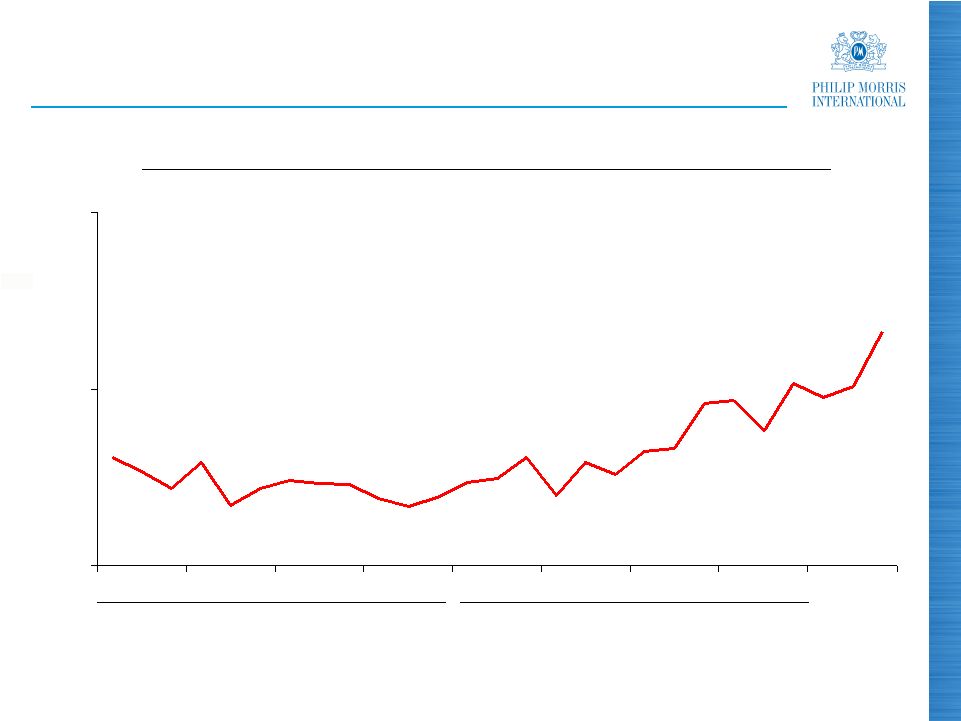 19
9.0
9.1
9.2
Q1
Q2
Q3
Q4
Q1
Q2
Q3
Q4
Marlboro
–
Market Share
2009
2010
Marlboro
Global
Share
of
Market
(a)
–
12
Months
Moving
Average
(%)
(a)
Excluding China and USA
Source: PMI estimates
2011
Q1 |
 20
Tobacco Leaf and Direct Materials
Stable tobacco leaf prices expected in 2011, mainly due
to a larger crop in Brazil
Direct material costs stable
Manufacturing costs expected to increase in line with
inflation this year, partly offset by our $250 million annual
productivity and cost reduction target, which we are fully
on track to achieve |
 21
Adjusted OCI Margins
2.2
42.7
44.9
Total
1.9
31.3
33.2
LA&C
7.7
38.7
46.4
Asia
(1.2)
44.1
42.9
EEMA
0.7 pp
48.6 %
49.3 %
EU
Variance
2010
2011
(a)
First-Quarter
(a)
Excluding currency and acquisitions
Source: PMI Financials |
 22
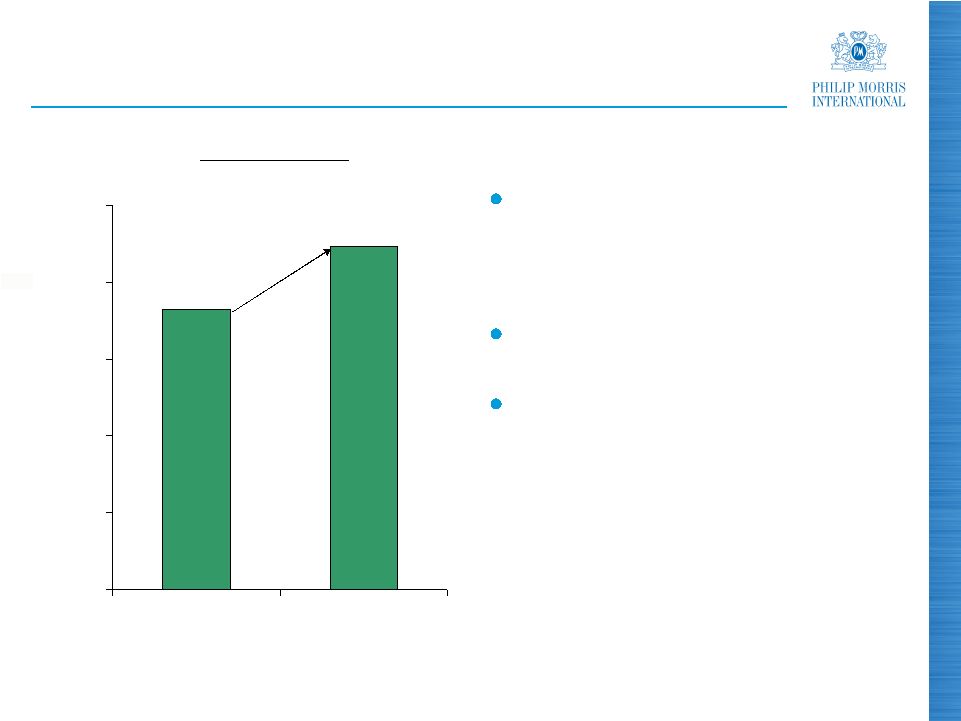
Free Cash Flow
(a)
Free cash flow equals net cash provided by operating activities less capital
expenditures Source: PMI Financials
Free Cash Flow
(a)
($ million)
+22.6%
Increase driven by higher
net earnings, lower
pension contributions and
lower cash exit costs
We continue to focus on
reducing inventory levels
Year-end working capital
requirements remain
subject to tax/price
increases and forestalling
regulations
1,824
2,236
0
500
1,000
1,500
2,000
2,500
Q1, 2010
Q1, 2011 |
 23
Share Repurchase Program
During the first quarter, PMI spent some $1.36 billion to
purchase 22.2 million shares at an average of $61.21
Full-year 2011 share repurchases expected to total
around $5 billion |
 24
Conclusions
Strong first-quarter results
Business outlook is favorable
Positive impact of Japan difficult to measure
Increased investment behind our portfolio of leading
brands
Slightly more conservative pricing assumptions
2011 reported diluted EPS guidance raised by 20 cents to
$4.55 to $4.65:
-
Ten cents to reflect our positive business momentum
-
Ten cents to reflect more favorable exchange rates
We will continue to use our strong cash flow to generously
reward our shareholders |
 25
Questions & Answers
2011 First-Quarter Results |
 26
PHILIP MORRIS INTERNATIONAL INC. and Subsidiaries
Reconciliation of Non-GAAP Measures
Adjustments for the Impact of Currency and Acquisitions
For the Quarters Ended March 31,
($ in millions)
(Unaudited)
(1)
Represents the business combination in the Philippines
Reported Net
Revenues
Less
Excise
Taxes
Reported Net
Revenues
excluding
Excise Taxes
Less
Currency
Reported Net
Revenues
excluding
Excise Taxes &
Currency
Less
Acquisi-
tions
Reported Net
Revenues
excluding
Excise Taxes,
Currency &
Acquisitions
Reported Net
Revenues
Less
Excise
Taxes
Reported Net
Revenues
excluding
Excise Taxes
Reported
Reported
excluding
Currency
Reported
excluding
Currency &
Acquisitions
6,415
$
4,414
$
2,001
$
(106)
$
2,107
$
-
$
2,107
$
European Union
6,748
$
4,564
$
2,184
$
(8.4)%
(3.5)%
(3.5)%
3,671
1,984
1,687
(29)
1,716
-
1,716
EEMA
3,356
1,610
1,746
(3.4)%
(1.7)%
(1.7)%
4,288
1,965
2,323
128
2,195
105
(1)
2,090
Asia
3,562
1,689
1,873
24.0%
17.2%
11.6%
2,156
1,376
780
24
756
-
756
Latin America & Canada
1,921
1,228
693
12.6%
9.1%
9.1%
16,530
$
9,739
$
6,791
$
17
$
6,774
$
105
$
6,669
$
PMI Total
15,587
$
9,091
$
6,496
$
4.5%
4.3%
2.7%
Reported
Operating
Companies
Income
Less
Currency
Reported
Operating
Companies
Income
excluding
Currency
Less
Acquisi-
tions
Reported
Operating
Companies
Income
excluding
Currency &
Acquisitions
Reported
Operating
Companies
Income
Reported
Reported
excluding
Currency
Reported
excluding
Currency &
Acquisitions
1,006
$
(21)
$
1,027
$
-
$
1,027
$
European Union
1,062
$
(5.3)%
(3.3)%
(3.3)%
722
(12)
734
-
734
EEMA
770
(6.2)%
(4.7)%
(4.7)%
1,093
102
991
23
(1)
968
Asia
724
51.0%
36.9%
33.7%
251
1
250
-
250
Latin America & Canada
217
15.7%
15.2%
15.2%
3,072
$
70
$
3,002
$
23
$
2,979
$
PMI Total
2,773
$
10.8%
8.3%
7.4%
% Change in Reported Net Revenues
excluding Excise Taxes
2011
2010
% Change in Reported Operating
Companies Income
2011
2010 |
 27
PHILIP MORRIS INTERNATIONAL INC. and Subsidiaries
Reconciliation of Non-GAAP Measures
Reconciliation of Reported Operating Companies Income to Adjusted Operating
Companies Income & Reconciliation of Adjusted Operating Companies Income
Margin, excluding Currency and Acquisitions For the Quarters Ended March
31, ($ in millions)
(Unaudited)
(1)
Represents the business combination in the Philippines
(2)
For the calculation of net revenues excluding excise taxes, currency and
acquisitions refer to previous slide Reported
Operating
Companies
Income
Less
Asset Impairment
& Exit Costs
Adjusted
Operating
Companies
Income
Less
Currency
Adjusted
Operating
Companies
Income
excluding
Currency
Less
Acquisi-
tions
Adjusted
Operating
Companies
Income
excluding
Currency &
Acquisitions
Reported
Operating
Companies
Income
Less
Asset
Impairment &
Exit Costs
Adjusted
Operating
Companies
Income
Adjusted
Adjusted
excluding
Currency
Adjusted
excluding
Currency &
Acquisitions
1,006
$
(11)
$
1,017
$
(21)
$
1,038
$
-
$
1,038
$
European Union
1,062
$
-
$
1,062
$
(4.2)%
(2.3)%
(2.3)%
722
(2)
724
(12)
736
-
736
EEMA
770
-
770
(6.0)%
(4.4)%
(4.4)%
1,093
(2)
1,095
102
993
23
(1)
970
Asia
724
-
724
51.2%
37.2%
34.0%
251
(1)
252
1
251
-
251
Latin America & Canada
217
-
217
16.1%
15.7%
15.7%
3,072
$
(16)
$
3,088
$
70
$
3,018
$
23
$
2,995
$
PMI Total
2,773
$
-
$
2,773
$
11.4%
8.8%
8.0%
% Points Change
Adjusted
Operating
Companies
Income
excluding
Currency
Net Revenues
excluding Excise
Taxes &
Currency
(2)
Adjusted
Operating
Companies
Income
Margin
excluding
Currency
Adjusted
Operating
Companies
Income
excluding
Currency &
Acquisitions
Net Revenues
excluding Excise
Taxes, Currency
& Acquisitions
(2)
Adjusted
Operating
Companies
Income Margin
excluding
Currency &
Acquisitions
Adjusted
Operating
Companies
Income
Net Revenues
excluding Excise
Taxes
(2)
Adjusted
Operating
Companies
Income
Margin
Adjusted
Operating
Companies
Income
Margin
excluding
Currency
Adjusted
Operating
Companies
Income Margin
excluding
Currency &
Acquisitions
1,038
$
2,107
$
49.3%
1,038
$
2,107
$
49.3%
European Union
1,062
$
2,184
$
48.6%
0.7
0.7
736
1,716
42.9%
736
1,716
42.9%
EEMA
770
1,746
44.1%
(1.2)
(1.2)
993
2,195
45.2%
970
2,090
46.4%
Asia
724
1,873
38.7%
6.5
7.7
251
756
33.2%
251
756
33.2%
Latin America & Canada
217
693
31.3%
1.9
1.9
3,018
$
6,774
$
44.6%
2,995
$
6,669
$
44.9%
PMI Total
2,773
$
6,496
$
42.7%
1.9
2.2
2010
2011
2010
2011
% Change in Adjusted Operating
Companies Income |
 28
PHILIP MORRIS INTERNATIONAL INC. and Subsidiaries
Reconciliation of Non-GAAP Measures
Reconciliation of Reported Diluted EPS to Adjusted Diluted EPS and Adjusted
Diluted EPS, excluding Currency For the Quarters Ended March 31,
(Unaudited)
2011
2010
% Change
Reported Diluted EPS
1.06
$
0.90
$
17.8%
Adjustments:
Tax items
(0.01)
-
Asset impairment and exit costs
0.01
-
Adjusted Diluted EPS
1.06
$
0.90
$
17.8%
Less:
Currency impact
0.03
Adjusted Diluted EPS, excluding Currency
1.03
$
0.90
$
14.4% |
 29
PHILIP MORRIS INTERNATIONAL INC. and Subsidiaries
Reconciliation of Non-GAAP Measures
Reconciliation
of
Operating
Cash
Flow
to
Free
Cash
Flow
and
Free
Cash
Flow,
excluding
Currency
For the Quarters Ended March 31,
($ in millions)
(Unaudited)
(a) Operating Cash Flow
2011
2010
% Change
Net
cash
provided
by
operating
activities
(a)
2,395
$
1,974
$
21.3%
Less:
Capital expenditures
159
150
Free cash flow
2,236
$
1,824
$
22.6%
Less:
Currency impact
28
Free cash flow, excluding currency
2,208
$
1,824
$
21.1% |
 30
2011 First-Quarter Results
April 21, 2011 |