Attached files
| file | filename |
|---|---|
| 8-K - FORM 8-K - AMERISAFE INC | d8k.htm |
 Exhibit 99.1
Sidoti & Company, LLC
15
th
Annual New York Conference
March 22, 2011
G. Janelle Frost
Chief Financial Officer
C. Allen Bradley
Chairman & Chief Executive Officer |
 Forward Looking
Statements Statements made in this presentation that are not historical facts, including
statements accompanied by words such as “will,”
“believe,”
“anticipate,”
“expect,”
“estimate,”
“preliminary,”
or similar words are forward-looking statements within
the meaning of the Private Securities Litigation Reform Act of 1995 regarding
AMERISAFE’s plans and performance. These statements are based on
management’s estimates, assumptions, and projections as of the date of this
presentation and are not guarantees of future performance. Actual results may
differ materially from the results expressed or implied in these
statements as the
result of risks, uncertainties, and other factors, including the
factors set forth in the
Company’s filings with the Securities and Exchange Commission, including
in Item
1A “Risk Factors”
in AMERISAFE’s Annual Report on Form 10-K for the year ended
December 31, 2010. AMERISAFE cautions you not to place undue reliance on the
forward-looking statements contained in this presentation. AMERISAFE does not
undertake any obligation to publicly update or revise any forward-looking
statements to reflect future events, information, or circumstances that arise after
the date of this presentation.
2 |
 3
Market data as of March 15, 2011; Financial data as of December 31, 2010
Nasdaq: AMSF
Market Statistics:
Stock Price
$21.82
52 week range
$15.50 - $22.19
Shares Outstanding
18.2 M
Market Cap
$397 M
Book Value per Share
$17.72
Price-to-Book
1.23 |
 Overview
AMERISAFE has a 25-year operating history as a specialty
provider
of
workers’
compensation
insurance
for
small
to
mid-sized employers engaged in high hazard industries
4
2010 Highlights
GPW: $228.4 million
Combined ratio: 93.3%
Operating ROE: 9.9%
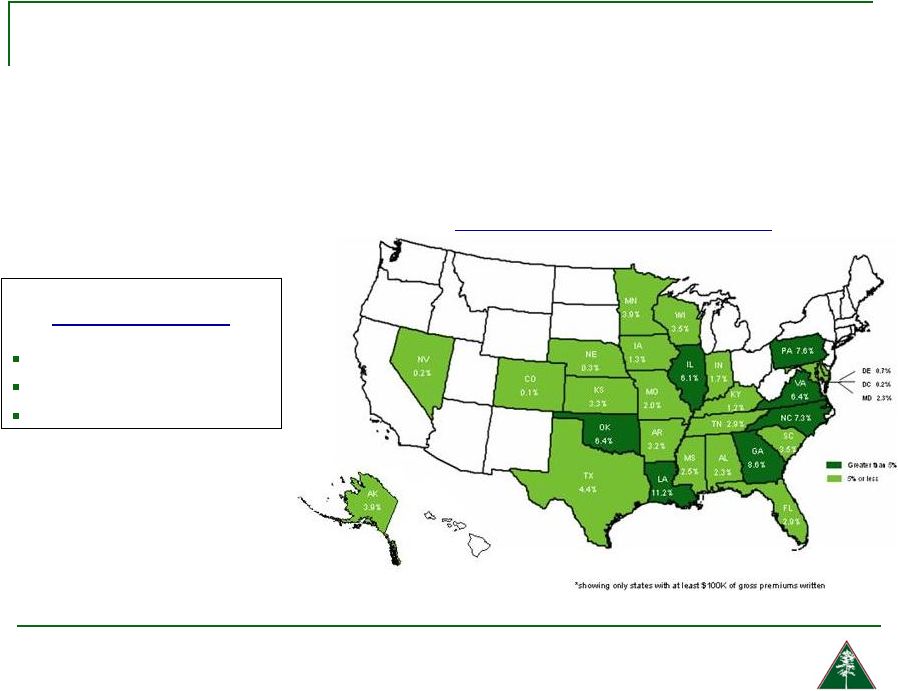
Premium Distribution by State
AMERISAFE
actively
markets
insurance
in
33
states
and
Washington
D.C. |
 Premium
Distribution 5
Premium Distribution by Industry as of 12/31/10
Historical Premium Distribution
of Major Industry Groups
(in $ millions)
150
100
50
0
2008
Construction
2009
2010
Trucking
Agriculture
Oil and Gas
Construction
Trucking
Agriculture
24.1%
6.8%
Logging
4.2%
Other
26.9%
4.0%
34.0% |
 AMERISAFE
Differentiators 6
Focus on High Hazard Industries Niche
Focus on Small to Mid-Sized Employers
Specialized Underwriting Expertise
Comprehensive Safety Services
Intensive Claims Management
Integrated High-Touch Service |
 High Hazard Niche
Focus High hazard industry workers’
comp rates are more
than 3 times the national average
Difficult to serve industry sub-segments
Less impacted by soft market cycles
Represents a broad spectrum of risk quality; favors
expertise in risk selection and pricing
Higher severity losses require unique claims
handling skills and processes
7 |
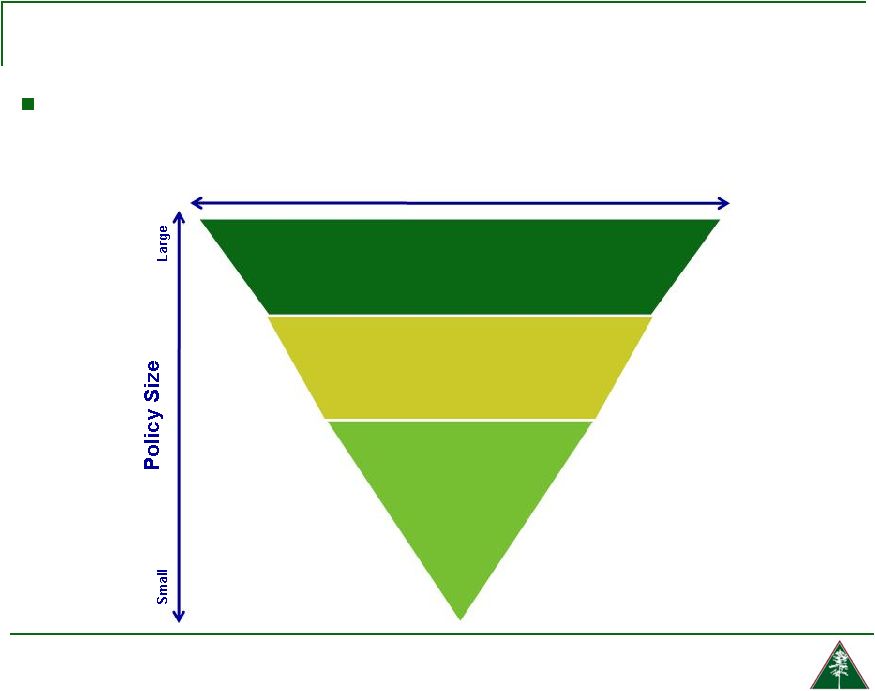 Small
to Mid-Sized Employers 1
Competition is fragmented, and favors multi-state writers
of small to mid-sized employers
8
Intensity of Competition
Annual
premium
> $100,000
Annual
premium
$35,000 to
$100,000
Annual
premium
< $35,000
Large Competitors (major national firms);
Represents 3% of AMSF policies;
22% of premiums
Mid-sized Competitors (regional and
smaller national firms);
Represents 19% of AMSF policies;
36% of premiums
Small Competitors (single-state
writers, self-insured funds);
Represents 78% of
AMSF policies;
42% of
Premiums
1
As of 12/31/2010 |
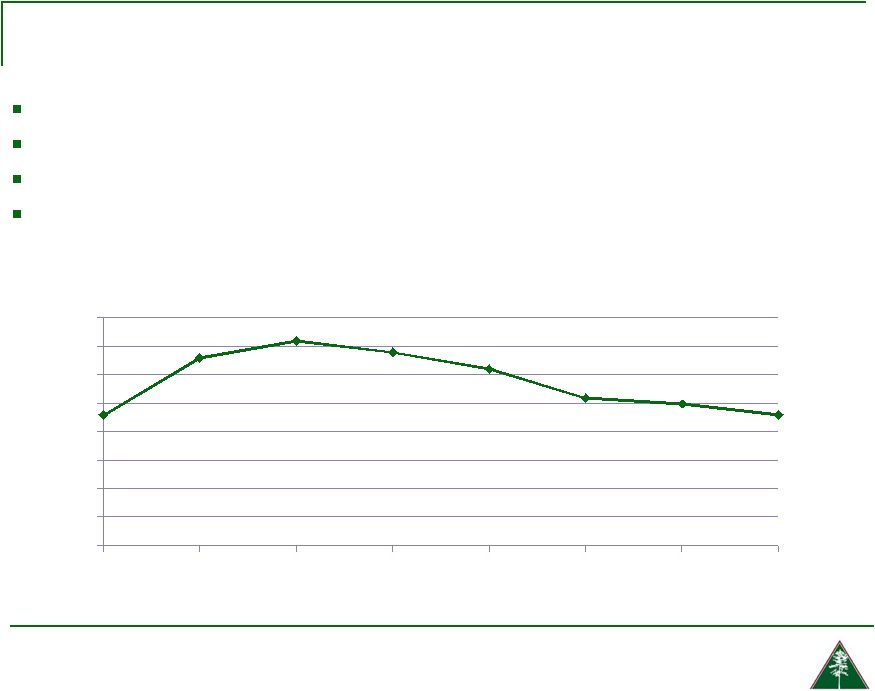 Specialized
Underwriting Expertise Industry-specific risk analysis and proprietary
rating tools developed over 25-year history Underwriters
have
in-depth
knowledge
of
insureds’
industry
practices
and
loss
exposures
No delegation of underwriting authority to agents or MGA’s
Track record of maintaining pricing discipline and low loss experience
9
1.43
1.53
1.56
1.54
1.51
1.46
1.45
1.43
1.20
1.25
1.30
1.35
1.40
1.45
1.50
1.55
1.60
2003
2004
2005
2006
2007
2008
2009
2010
Policy Year ELCM |
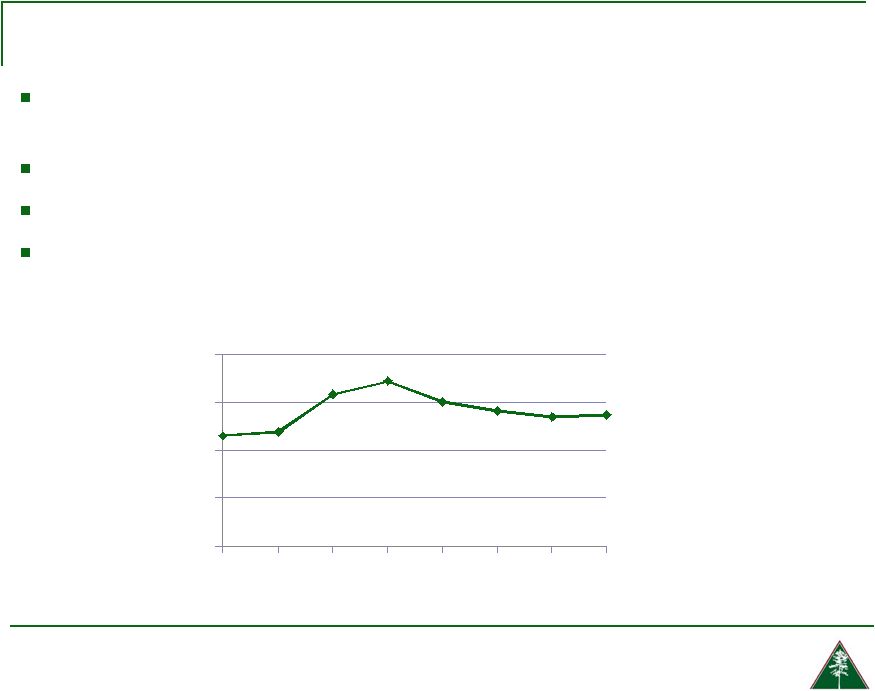 Comprehensive
Safety Services Pre-quotation, worksite safety inspections were performed
on approximately 90% of new voluntary policyholders in 2010
Voluntary policies inspected prior to renewal
Detailed safety reports provided to underwriters after safety visits
Field Safety Professionals have in-depth knowledge of our high hazard
industries
10
60%
70%
80%
90%
100%
2003
2004
2005
2006
2007
2008
2009
2010
Safety Inspection Ratio |
 Intensive Claims
Management Field Case Managers (FCMs) located in service areas; visit
claimants personally
On average, only 56 indemnity claims per FCM as of 12/31/10
FCMs focus on timely resolution of claims
11
4,000
4,500
5,000
5,500
6,000
6,500
2003
2004
2005
2006
2007
2008
2009
2010
Total Open Claims at Period End |
 Strong Financial
Performance 12
-9.2%
13.6%
20.7%
21.0%
11.3%
4.7%
14.3%
15.3%
14.5%
12.1%
9.6%
8.4%
$7.42
$9.23
$11.66
$13.86
$16.00
$17.72
-10.0%
0.0%
10.0%
20.0%
30.0%
40.0%
50.0%
60.0%
2005
2006
2007
2008
2009
2010
$(3.00)
$-
$3.00
$6.00
$9.00
$12.00
$15.00
$18.00
Pre-tax Underwriting ROE
Pre-tax Investing ROE
BVPS |
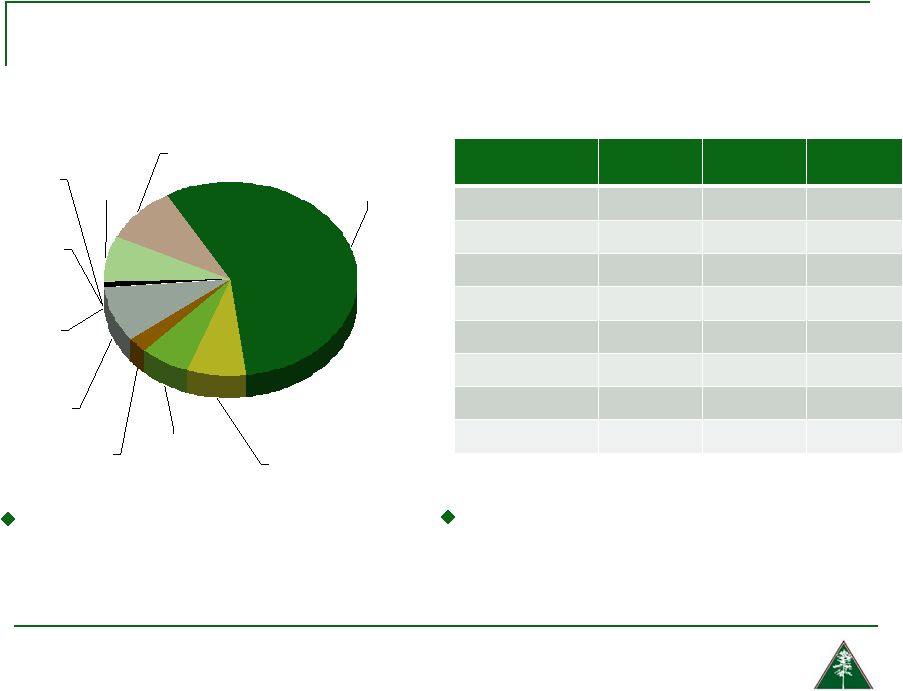 13
Investment Portfolio
Carrying value of cash and
investments was $826.5 million at
December 31, 2010
Investment
Book Value
($millions)
Fair Value
($millions)
Unrealized
Gain (Loss)
Municipals
$466.9
$479.1
$12.2
U.S. Agency MBS
$62.1
$65.9
$3.8
Commercial MBS
$51.5
$54.1
$2.6
U.S. Treasuries
$14.8
$15.8
$1.0
Corporate Bonds
$60.8
$62.2
$1.4
ABS
$6.4
$5.5
$(0.9)
Long-term CD
$0.8
$0.8
-
Total
$663.3
$683.4
$20.1
As of 12/31/2010, fixed-maturity
securities have an average
composite credit rating of “AA”
Value of Fixed-Maturity Securities
Classified as Held-to-Maturity
(as of
12/31/2010) Portfolio Allocation
(as of
12/31/2010) Municipals
56.5%
U.S. Agency
MBS
7.5%
Commerical
MBS
6.2%
U.S.
Treasuries/
agencies
2.5%
Corporates
9.3%
Asset-
backed
securities
0.8%
Long-term
CD
0.1%
Equities
0.2%
Cash & cash
equilvalents
7.4%
Short-term
investments
9.5% |
 Combined
Ratio 14
71.9%
74.2%
79.5%
66.6%
64.7%
60.9%
65.1%
71.9%
27.3%
24.8%
24.7%
23.8%
21.3%
19.3%
21.5%
21.0%
99.6%
99.5%
104.2%
92.4%
85.9%
81.4%
86.9%
93.3%
0%
20%
40%
60%
80%
100%
120%
2003
2004
2005
2006
2007
2008
2009
2010
Loss
Expense
Dividend |
 Current
Workers Compensation
Market Conditions
15 |
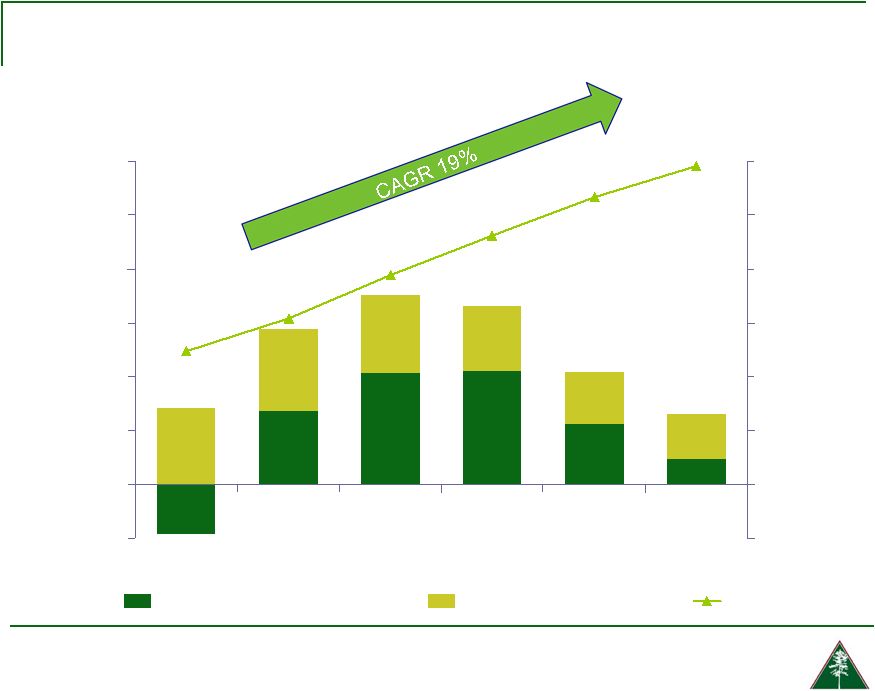
 WC Premiums
Continue Declines ($ Billions)
P Preliminary
Source: NCCI Holdings, Inc. 2010 State of the Workers Compensation
Line 16
0.0
10.0
20.0
30.0
40.0
50.0
1990
1991
1992
1993
1994
1995
1996
1997
1998
1999
2000
2001
2002
2003
2004
2005
2006
2007
2008
2009p
Net Written Premium
31.0
31.3
29.8
30.5
29.1
26.3
28.2
26.9
25.9
25.0
28.6
32.1
37.7
42.3
46.5
47.8
46.5
44.3
39.3
34.1 |
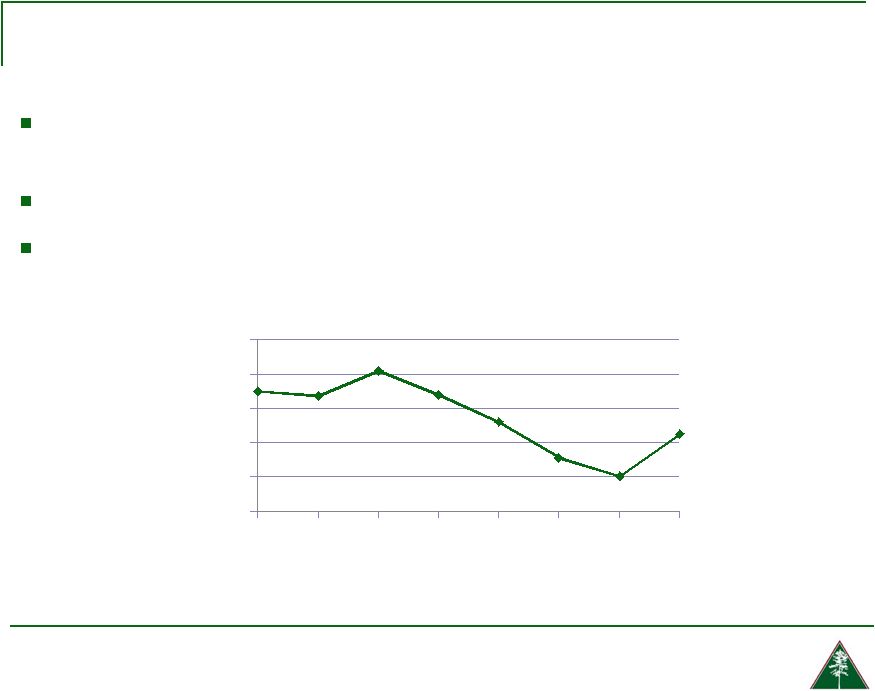
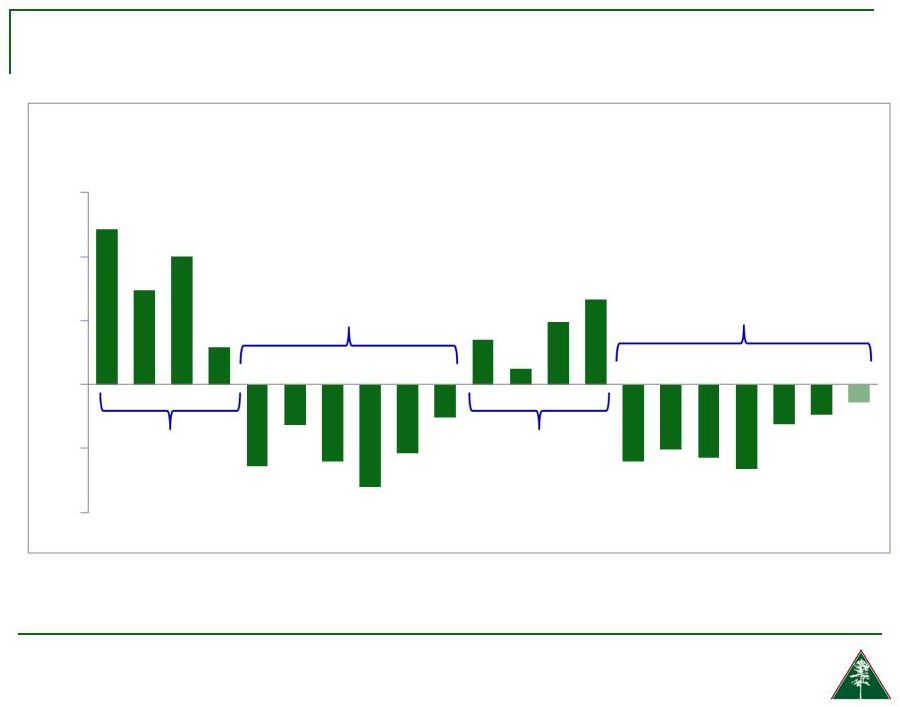 History of
Rates/Loss Cost Changes Source: NCCI Holdings, Inc. 2010 State of the
Workers Compensation Line Cumulative
1990-1993
+36.3%
Cumulative
2004-2010
-26.7%
Cumulative
1994-1999
-27.8%
Cumulative
2000-2003
+17.1%
Calendar Year
*States approved through 4/23/2010
Countrywide approved changes in advisory rates, loss costs, and assigned risk rates
as filed by the applicable rating organization 17
12.1
7.4
10.0
2.9
-6.4
-3.2
-6.0
-8.0
-5.4
-2.6
3.5
1.2
4.9
6.6
-6.0
-5.1
-5.7
-6.6
-3.1
-2.4
-1.4
-10
-5
0
5
10
15
1990
1991
1992
1993
1994
1995
1996
1997
1998
1999
2000
2001
2002
2003
2004
2005
2006
2007
2008
2009
2010*
Average Approved WC Bureau Rate/Loss Cost Level Changes |
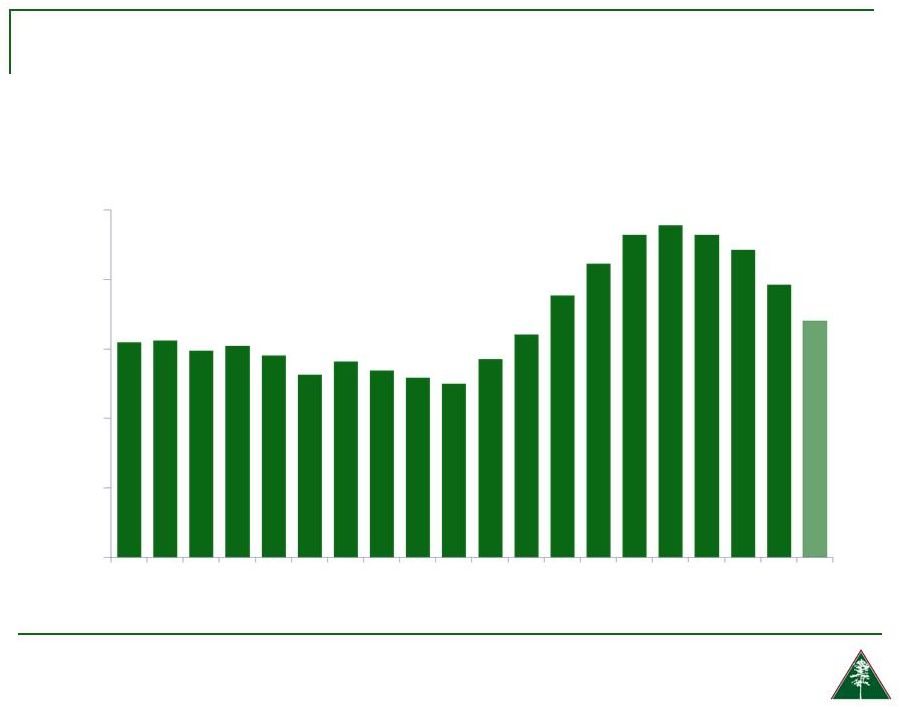
 Effect of
Recessions* on Payroll (Workers Comp Exposure)
*Data is an estimate and represents maximum recorded decline over 12-month
period using annualized quarterly wage and salary accrual data
Source: Insurance Information Institute research; Federal Reserve Bank of St. Louis
(wage and salary data); National Bureau of Economic Research (recession
dates). -4.4%
-2.0%
-1.1%
1.1%
3.7%
4.6%
8.5%
3.5%
2.1%
-0.5%
-3.6%
-6%
-4%
-2%
0%
2%
4%
6%
8%
10%
1948-
1949
1953-
1954
1957-
1958
1960-
1961
1969-
1970
1973-
1975
1980
1981-
1982
1990-
1991
2001
2007-
2009
Recessions
in
the
1970s
and
1980s
saw smaller exposure impacts
because of continued wage
inflation, a factor not present
during the 2007-2009 recession
The Dec. 2007 to mid-
2009 recession
caused the largest
impact on WC
exposure in 60 years
(Percent
Change)
(All Post WWII Recessions)
Recession Dates (Beginning/Ending Years)
18 |
 Calendar Year
Reserve Deficiencies ($ Billions)
Source: NCCI Holdings, Inc. 2010 State of the Workers Compensation
Line 19
Workers Compensation Loss and LAE Reserve Deficiency
Private Carriers
2009 Tabular Discount is $5.3 Billion
Calendar Year |
 WC Required
Returns Percent
* Based on NCCI’s
2009 Internal Rate of Return model
Source: NCCI Holdings, Inc. 2010 State of the Workers Compensation
Line 20
Workers Compensation Combined Ratios for Given Cost of Capital*
Assumptions:
3.4% Pre-Tax Investment Yield
2.7% After-Tax Investment Yield
WC Reserve to Surplus Ratio = 2.05
Cost of Capital
75
80
85
90
95
100
105
5%
6%
7%
8%
9%
10%
11%
12%
13%
14%
15%
103
100
98
96
94
93
91
90
88
87
86 |
 WC Industry
Combined Ratio 118%
122%
111%
110%
107%
103%
98%
104%
104%
110%
94%
106%
104%
100%
100%
104%
92%
86%
81%
87%
93%
110%
60%
70%
80%
90%
100%
110%
120%
130%
2000
2001
2002
2003
2004
2005
2006
2007
2008
2009
2010
WC Ind.
AMSF
Workers Comp Underwriting Results Are
Deteriorating Markedly
Sources: A.M. Best; Insurance Information Institute.
21 |
 Investment
Considerations 22
Consistent growth in book value
Strong and growing balance sheet
Consistent high returns
Efficient expense structure
Specialized underwriting expertise developed
over 25-year history
Prudent reserving policy |
 Appendix
23 |
 Selected Balance
Sheet Data 24
(in thousands)
2008
2009
2010
Investments, Cash and cash equivalents
799,973
800,485
826,503
Amounts recoverable from reinsurers
67,763
81,878
95,133
Premiums receivable, net
156,567
151,570
122,618
Deferred income taxes
33,580
28,489
31,512
Deferred policy acquisition costs
20,289
18,128
17,400
Total Assets
1,107,833
1,118,809
1,128,134
Reserves for loss and loss adjustment expenses
531,293
534,655
532,204
Unearned premiums
137,100
122,500
111,494
Insurance-related assessments
42,505
40,072
33,898
Subordinated debt securities
36,090
36,090
36,090
Redeemable preferred stock
25,000
-
-
Shareholders’ equity
253,272
302,417
325,223
Metrics
Book Value Per Share 1
$13.86
$16.00
$17.72
Debt to Capital 1
11.5%
10.7%
10.0%
1 Includes redeemable preferred stock for 2008 |
 Income
Statement 25
(in thousands)
2009
2010
Revenues:
Gross premiums written
$256,454
$228,424
Ceded premiums written
(20,158)
(20,549)
Net premiums written
$236,296
$207,875
Net premiums earned
$250,896
$218,881
Net investment income
28,014
26,242
Net realized gains on investments
2,033
2,449
Fee and other income
1,268
584
Total revenues
282,211
248,156
Expenses:
Loss and loss adjustment expenses incurred
163,316
157,388
Underwriting and other operating costs
53,957
45,959
Interest expense
1,810
1,548
Policyholder dividends
770
834
Total expenses
219,853
205,729
Income before taxes
62,358
42,427
Income tax expense
15,927
9,074
Net income
$46,431
$33,353 |
 Return on Equity
Drivers 26
Year to Date
12/31/2010
Loss Ratio
71.9%
+
Expense Ratio
21.0%
+
Policyholder Dividend Ratio
0.4%
=
Combined Ratio
93.3%
Underwriting Profit
6.7%
x
Operating Leverage
0.7
=
ROE from Underwriting
4.7%
Pre-tax Investment Yield
3.2%
x
Investment Leverage
2.59
=
ROE from Investing
8.4%
ROE from Other Income (Expense)
0.4%
Pre-tax ROE (tax-equilvalent basis)
13.5%
Effective Tax Rate
21.4%
After-tax Return on Fully Converted Equity
10.6% |