Attached files
| file | filename |
|---|---|
| 8-K - 8-K FOR 3RDQ 2010 EARNINGS - TEMPLE INLAND INC | tin8k20101020.htm |
| EX-99.1 - 3RDQ 2010 EARNINGS RELEASE - TEMPLE INLAND INC | tin8kex99120101020.htm |

1
Our job is to be the best
Third Quarter 2010
14

2
This presentation contains “forward-looking statements” within the meaning of the federal
securities laws. These statements reflect management’s current views with respect to future
events and are subject to risk and uncertainties. We note that a variety of factors and uncertainties
could cause our actual results to differ significantly from the results discussed in the forward-
looking statements. Factors and uncertainties that might cause such differences include, but are
not limited to: general economic, market, or business conditions; the opportunities (or lack
thereof) that may be presented to us and that we may pursue; fluctuations in costs and expenses
including the costs of raw materials, purchased energy, and freight; changes in interest rates;
demand for new housing; accuracy of accounting assumptions related to impaired assets,
pension and postretirement costs, contingency reserves and income taxes; competitive actions by
other companies; changes in laws or regulations; our ability to execute certain strategic and
business improvement initiatives; the accuracy of certain judgments and estimates concerning the
integration of acquired operations; and other factors, many of which are beyond our control.
Except as required by law, we expressly disclaim any obligation to publicly revise any forward-
looking statements contained in this presentation to reflect the occurrence of events after the date
of this presentation.
This presentation includes non-GAAP financial measures. The required reconciliations to
GAAP financial measures are included on our website, www.templeinland.com.
GAAP financial measures are included on our website, www.templeinland.com.
15

3
Third Quarter 2010 Consolidated Results
• Special items (after-tax)
– $0.75 per share tax benefit related to cellulosic biofuel credit
– $0.03 per share charge primarily related to Box Plant
Transformation II
|
|
Q3
2010
|
Q2
2010
|
Q3
2009
|
|
Net income per share
|
$ 1.13
|
$ 0.18
|
$ 0.61
|
|
Special items
|
(0.72)
|
0.01
|
(0.37)
|
|
Net income per share excluding special
items |
$ 0.41
|
$ 0.19
|
$ 0.24
|
|
|
|
|
|
16

4
Corrugated Packaging
($ in Millions)
|
|
Q3
2010
|
Q2
2010
|
Q3
2009
|
|
Revenues
|
$ 809
|
$ 786
|
$ 734
|
|
Costs and expenses
|
(688)
|
(723)
|
(640)
|
|
Segment operating income
|
$ 121
|
$ 63
|
$ 94
|
• Record earnings and 24% ROI
• Key drivers
– Mill performance
– Box plant transformation
– Higher box prices
– Lower input costs
– Less mill downtime
17
5
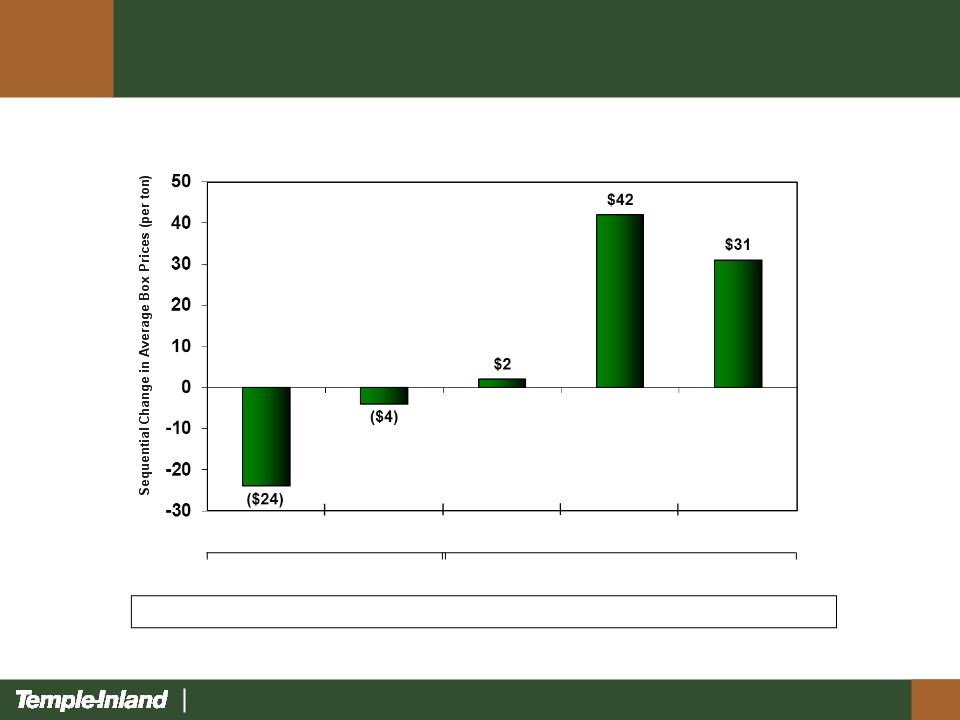
Corrugated Packaging
TIN Average Box Price *
September 2010 box prices $93 higher than February 2010 box prices
2009
Q3 Q4 Q1 Q2 Q3
2010
* Average box price realization includes the impact of mix of business
18
6
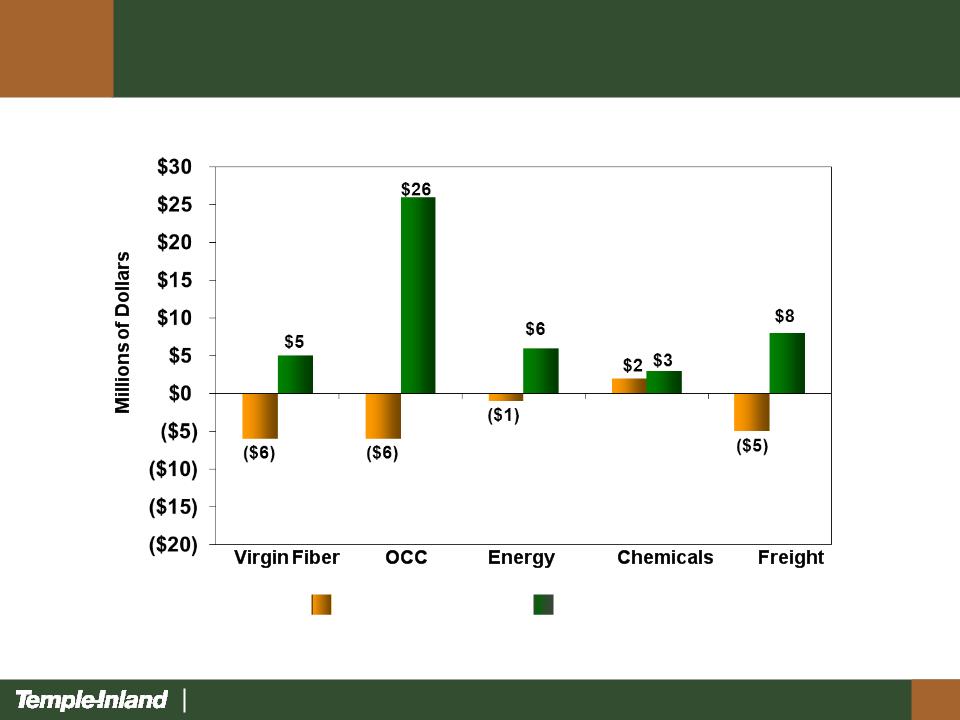
Corrugated Packaging
Key Input Cost Changes
Q3 2010 vs. Q2 2010 Q3 2010 vs. Q3 2009
19
7
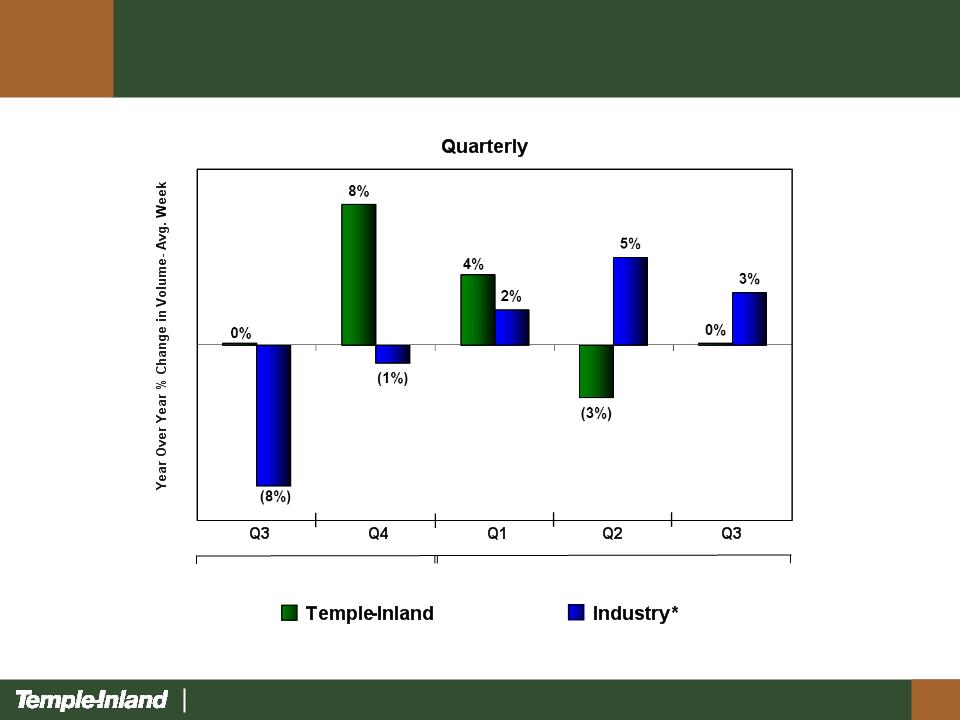
Corrugated Packaging
Box Shipments
* Source: Fibre Box Association
2009
2010
20

8
Corrugated Packaging
• Q3 2010 maintenance downtime
– 4,000 tons at New Johnsonville
• Q4 2010 maintenance downtime
– 13,000 tons at Orange
21

Looking Forward
• 4th Quarter
– Higher prices
– Lower seasonal volume
– Higher input costs
9
22

10
Building Products
($ in Millions)
|
|
Q3
2010
|
Q2
2010
|
Q3
2009
|
|
Revenues
|
$ 157
|
$ 190
|
$ 151
|
|
Costs and expenses
|
(167)
|
(175)
|
(155)
|
|
Segment operating income (loss)
|
$( 10)
|
$ 15
|
$( 4)
|
23

11
Building Products
Lumber
Price
2009
2010
Q3 Q4 Q1 Q2 Q3
Volume
2009
2010
24
12
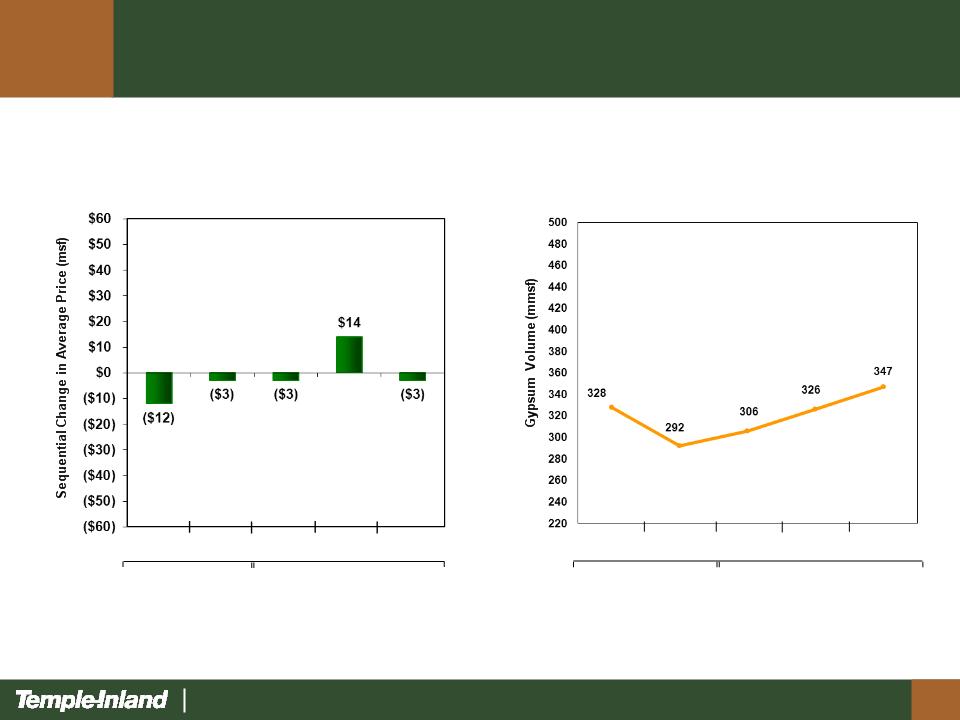
Building Products
Gypsum
Volume
2009
2010
Q3 Q4 Q1 Q2 Q3
Price
Q3 Q4 Q1 Q2 Q3
2009
2010
25
13
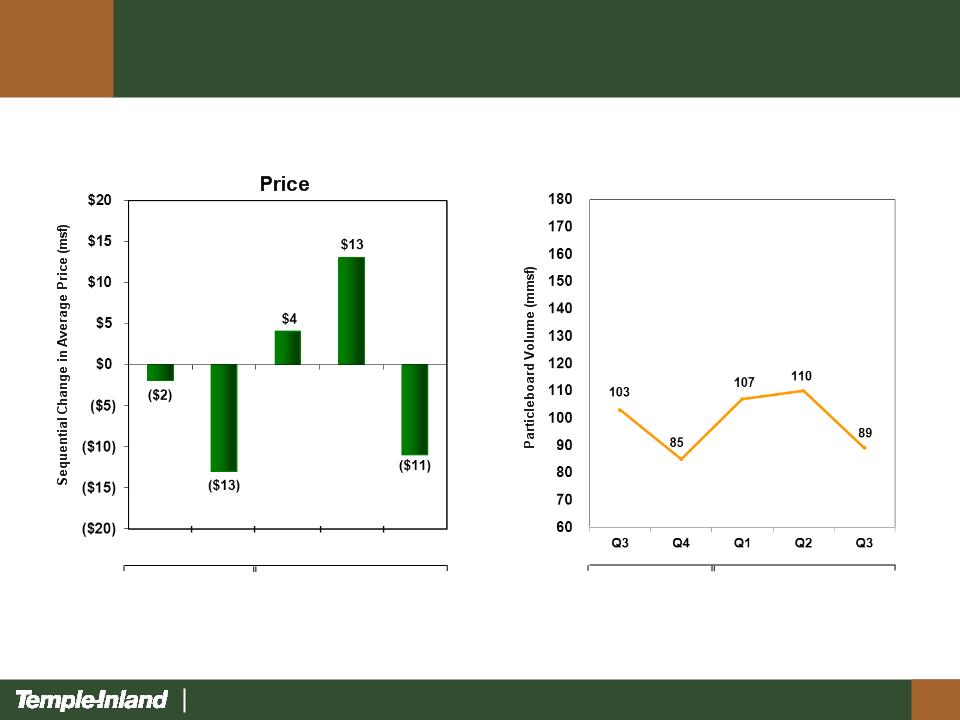
Particleboard
Volume
Building Products
2009
2010
Q3 Q4 Q1 Q2 Q3
2009
2010
26

14
Housing Starts
TIN EBITDA
2006
2007
2008
2009
2010
27

15
Third Quarter 2010 Financial Highlights
• Cash provided by operations $109 million in third quarter
– Operations provided $114 million
– Working capital was a use of $5 million
• Balance sheet
– Long-term debt $709 million at third quarter-end, down $36
million from second quarter-end
million from second quarter-end
• Expense related items
– Interest expense $13 million in third quarter and $39 million year
-to-date, down 7% and 22% respectively vs. year ago
-to-date, down 7% and 22% respectively vs. year ago
– General and administrative expenses $17 million in third quarter
and $54 million year-to-date, consistent with prior guidance
and $54 million year-to-date, consistent with prior guidance
• Cellulosic Biofuel
28

16
Our job is to be the best
29