Attached files
| file | filename |
|---|---|
| 8-K - FORM 8-K - PDC ENERGY, INC. | pdc8k08092010.htm |
| EX-99.1 - EX 99.1 - PDC ENERGY, INC. | pdcrelease2010_0809.htm |

Second Quarter 2010 Results Teleconference
August 9, 2010

Disclaimer
The following information contains forward-looking statements within the meaning of the Private Securities Litigation Reform Act of 1995. These
forward-looking statements are based on Management’s current expectations and beliefs, as well as a number of assumptions concerning future
events.
forward-looking statements are based on Management’s current expectations and beliefs, as well as a number of assumptions concerning future
events.
These statements are based on certain assumptions and analyses made by Management in light of its experience and its perception of historical
trends, current conditions and expected future developments as well as other factors it believes are appropriate in the circumstances. However,
whether actual results and developments will conform with Management’s expectations and predictions is subject to a number of risks and
uncertainties, general economic, market or business conditions; the opportunities (or lack thereof) that may be presented to and pursued by PDC
Energy; actions by competitors; changes in laws or regulations; and other factors, many of which are beyond the control of PDC Energy.
You are cautioned not to put undue reliance on such forward-looking statements because actual results may vary materially from those expressed
or implied, as more fully discussed in our safe harbor statements found in our SEC filings, including, without limitation, the discussion under the
heading “Risk Factors” in the Company’s 2009 annual report on Form 10-K and in subsequent Form 10-Qs. All forward-looking statements are
based on information available to Management on this date and PDC Energy assumes no obligation to, and expressly disclaims any obligation to,
update or revise any forward looking statements, whether as a result of new information, future events or otherwise.
The SEC permits oil and gas companies to disclose in their filings with the SEC proved reserves, probable reserves and possible reserves. SEC
regulations define “proved reserves” as those quantities of oil or gas which, by analysis of geosciences and engineering data, can be estimated
with reasonable certainty to be economically producible in future years from known reservoirs under existing economic conditions, operating
methods and government regulations; “probable reserves” as unproved reserves which, together with proved reserves, are as likely as not to be
recovered; and “possible reserves” as unproved reserves which are less certain to be recovered than probable reserves. Estimates of probable
and possible reserves which may potentially be recoverable through additional drilling or recovery techniques are by nature more uncertain than
estimates of proved reserves and accordingly are subject to substantially greater risk of not actually being realized by the Company. In addition,
the Company’s reserves and production forecasts and expectations for future periods are dependent upon many assumptions, including
estimates of production decline rates from existing wells and the undertaking and outcome of future drilling activity, which may be affected by
significant commodity price declines or drilling cost increases.
This material also contains certain non-GAAP financial measures as defined under the Securities and Exchange Commission rules.
2
8/9/2010

Rick McCullough
Chairman and Chief Executive Officer
3
8/9/2010

Second Quarter 2010 Highlights
8/9/2010
4
• Gas and oil revenues up 22% over same period 2009
• Q2 2010 realized prices of $6.66 per Mcfe compared to Q2 2009 realized prices of $5.97
per Mcfe
per Mcfe
• Net loss from continuing operations was $0.02 per diluted share for the second quarter
2010, compared to a net loss of $2.25 per diluted share in the same 2009 period
2010, compared to a net loss of $2.25 per diluted share in the same 2009 period
• Production of 9.0 Bcfe was above guidance due to continued strong performance in
Wattenberg; production of 36.4 Bcfe expected for full year 2010
Wattenberg; production of 36.4 Bcfe expected for full year 2010
• Second quarter oil and gas operating margin per Mcfe improved 56% over second quarter
2009 to $3.84 per Mcfe from $2.47 per Mcfe predominantly due to a higher percentage of
oil production and improved pricing in Q2 2010
2009 to $3.84 per Mcfe from $2.47 per Mcfe predominantly due to a higher percentage of
oil production and improved pricing in Q2 2010
• Drilled 44.1 net wells vs. 19.7 net wells in Q2 2009
• G&A expense reflects 33% and 24% year-over-year improvement for the second quarter
2010 and year-to-date 2010, respectively
2010 and year-to-date 2010, respectively
• Liquidity improved to $268.7million

Bart Brookman
Senior Vice President - Exploration and Production
5
8/9/2010

Q1 2010 Production:
8.1
Bcfe
8.1
Bcfe
Rocky Mountains
Q1 2010 Production:
0.6
Bcfe
0.6
Bcfe
Q2 2010 Production:
0.6
Bcfe
0.6
Bcfe
2010E Production:
2.5
Bcfe
2.5
Bcfe
Appalachian Basin (PDCM)
Q1 2010 Production:
0.3
Bcfe
0.3
Bcfe
Q2 2010 Production
9.0 Bcfe (8.6 Bcfe*)
Michigan
Basin (4%)
Basin (4%)
Appalachian Basin (7%)
Rocky
Mountains (90%)
Mountains (90%)
Rocky
Mountains (89%)
Mountains (89%)
8/9/2010
6
Core Operating Regions
Area of operations starting
August 2010
August 2010
Permian Basin (2H 2010)
*8.6 Bcfe excludes 0.4 Bcfe of Michigan production classified as discontinued operations in Q2 2010.

Quarterly Net Production
7
8/9/2010
• First horizontal Marcellus well
connected to sales in late June
connected to sales in late June
• Outstanding Wattenberg
production
production
• Remote telemetry enhancing
well management
well management
• Improved frac designs
• Production includes large oil
and liquids component
and liquids component
• Piceance production in line with
guidance
guidance
• PDC Mountaineer JV production
below original budget; in line
with updated guidance
below original budget; in line
with updated guidance
• Drilling delays
• Difficulty in scheduling fracs
Michigan
(reflected as discontinued operations)

Quarterly Drilling Activity
8
8/9/2010
• Two rigs operating in Wattenberg
• Add third rig in Q4
• First horizontal Niobrara well in Q4
• One Flex rig operating in
Piceance
Piceance
• Significant improvement in spud to
spud time
spud time
• Marcellus horizontal drilling
• Promising results from first three wells
• One rig returning in September 2010
• Expected additional Q4 drilling:
• Spud Beekmantown/Rose Run
prospect in Ohio
prospect in Ohio
• Spud Permian Basin operations
• NECO program under evaluation
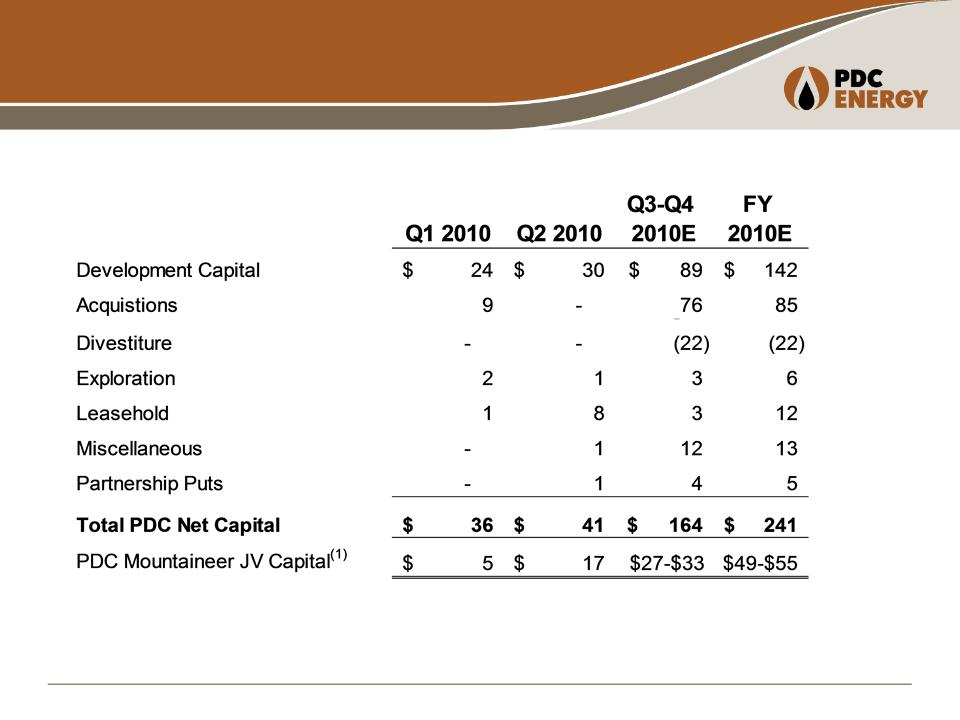
Capital Expenditure Update
$ in Millions
9
8/9/2010
Note: Excludes $36.4 million of potential partnership repurchases.
(1) PDC carried by JV partner.

8/9/2010
10
2010 Production by Area
Billion Cubic Feet Equivalent (Bcfe)
|
Area
|
Q1 2010
Actual |
Q2 2010
Actual |
FY 2010E
|
|
Wattenberg
|
4.0
|
4.0
|
15.9
|
|
Piceance
|
3.0
|
2.8
|
11.9
|
|
NECO
|
1.1
|
1.1
|
4.4
|
|
Michigan*
|
0.3
|
0.4
|
0.7
|
|
West Texas
|
0.0
|
0.0
|
0.6
|
|
Other
(ND, TX, WY)
|
0.1
|
0.1
|
0.4
|
|
Appalachia (PDCM)
|
0.6
|
0.6
|
2.5
|
|
TOTAL
|
9.1
|
9.0
|
36.4
|
* Michigan production through 6/30/10 reflected as discontinued operations.

Lifting Costs
|
|
Q1 2010
Actual
|
Q2 2010
Actual
|
FY 2010E
|
|
Direct Costs ($/Mcfe)
|
$0.75
|
$0.98
|
$0.73 - $0.87
|
|
Indirect Costs ($/Mcfe)
|
$0.29
|
$0.26
|
$0.27 - $0.31
|
|
Total Lifting Cost ($/Mcfe)
|
$1.04
|
$1.24
|
$1.00 - $1.18
|
|
Production (MMcfe/d)
|
101
|
98
|
100
|
11
8/9/2010
• Q2 2010 per unit costs increased as a result of:
• Increased workovers - production enhancement based projects (primarily Piceance)
• Regulatory and environmental expenses - accrual of facility upgrades in Piceance and Wattenberg
• Piceance water disposal expenses anticipated to improve in Q4 2010
• 2009 per unit costs included an operating cost reimbursement credit which reduced the per unit costs by
approximately $0.15. Second quarter 2010 per unit costs were higher than 2009 second quarter per unit
costs due to: lower production and the addition of approximately $0.29 per unit due to the incurrence of
approximately $1.3 million of environmental maintenance expenses, and well workover expenses of
approximately $1.2 million. When amounts are adjusted for these items the comparison was $.95 per unit in
2010 compared to an adjusted $.79 per unit in 2009. Most of the difference in per unit costs was related to
lower production volumes in 2010.

Q2 2010 Operations Highlights
• Production, activity, and CAPEX in line with guidance
• Planning for Q4 CAPEX and production increases
• Wattenberg
– Expanding drilling program
– Anticipate drilling of first horizontal Niobrara well in October 2010
• Piceance
– 2010 CAPEX drilling (10 wells) online and initial production results are
encouraging
encouraging
– Executed 2 mega-fracs
• Marcellus
– Three horizontal completions with promising results
– Full time drilling rig activity commencing in late Q3 2010
• Permian
– Operational team in place
– Drilling commencement scheduled for October 2010
8/9/2010
12

Gysle Shellum
Chief Financial Officer
13
8/9/2010

Summary Financial Results
8/9/2010
14
In Millions, Except for Per Share Data
|
|
Three Months Ended
|
Six Months Ended
|
||
|
June 30,
|
June 30,
|
|||
|
Measure
|
2010
|
2009
|
2010
|
2009
|
|
O&G Revenues
|
$49.4
|
$40.4
|
$108.1
|
$78.6
|
|
O&G Production & Well Operations Costs
|
$16.4
|
$13.7
|
$31.5
|
$29.5
|
|
O&G Operating Margin(1)
|
$33.0
|
$26.7
|
$76.6
|
$49.1
|
|
Adjusted cash flow from operations(2)
|
$28.8
|
$37.7
|
$78.2
|
$77.4
|
|
Adjusted EBITDA(2)
|
$30.0
|
$36.3
|
$82.1
|
$81.0
|
|
Adjusted EBITDA (per diluted share)(2)
|
$1.56
|
$2.45
|
$4.26
|
$5.47
|
|
DD&A
|
$27.1
|
$33.3
|
$54.8
|
$67.1
|
|
G&A
|
$9.9
|
$14.8
|
$20.5
|
$26.9
|
(1) O&G operating margin is defined as O&G revenue less O&G production and well operations costs.
(2) See appendix for Non-GAAP reconciliation of Adjusted Cash Flow from Operations and Adjusted EBITDA.

Summary Financial Results
8/9/2010
15
|
|
Three Months Ended
|
Six Months Ended
|
||
|
June 30,
|
June 30,
|
|||
|
Measure
|
2010
|
2009
|
2010
|
2009
|
|
Operating income (loss)
|
$7.1
|
($44.6)
|
$52.0
|
($46.9)
|
|
Net Income (loss) attributable to
.shareholders |
($2.7)
|
($33.1)
|
$21.0
|
($38.8)
|
|
Diluted earnings (loss) per share
.attributable to shareholders |
($0.15)
|
($2.24)
|
$1.09
|
($2.62)
|
|
|
Three Months Ended
|
Six Months Ended
|
||
|
June 30,
|
June 30,
|
|||
|
Measure
|
2010
|
2009
|
2010
|
2009
|
|
Adjusted net income (loss) from continuing
operations(1) |
($3.0)
|
($3.9)
|
$7.4
|
($0.8)
|
|
Adjusted earnings (loss) per share from
continuing operations(1)
|
($0.15)
|
($0.27)
|
$0.38
|
($0.06)
|
(1) See appendix for Non-GAAP reconciliation of Adjusted Net Income.
In Millions, Except for Per Share Data

Michigan Basin Property Swap
for Wolfberry Permian Basin
for Wolfberry Permian Basin
• Closed July 30, 2010 with an effective date of May 1, 2010
• $ 75 million purchase price for Wolfberry properties
– Paid $52.5 million and traded Michigan properties valued at $22.5 million
– Gain is tax deferred via ‘Like Kind Exchange’ treatment
• Financial results related to Michigan properties reflected as discontinued
operations for all periods presented
operations for all periods presented
– Net operating income from May 1, 2010 effective date and July 30, 2010 closing
date treated as a purchase price adjustment
date treated as a purchase price adjustment
8/9/2010
16

Debt Maturity Schedule
8/9/2010
17
• Maturity schedule reflects:
– Mitigation of liquidity risk
– Diversification of funding
sources
sources
• As of June 30, 2010:
– $37 million drawn balance
– $19 million undrawn L.O.C
– $19 million cash balance
– $269 million available liquidity
$305
$203
$37
$ in Millions

Quarterly Realized Hedge Price
8/9/2010
18
As of 6/30/10
Note: Weighted average for full year 2010 is $7.39/Mcfe.

Oil and Gas Per Unit Costs
8/9/2010
19
|
|
Three Months Ended
|
Six Months Ended
|
||
|
June 30,
|
June 30,
|
|||
|
Measure
|
2010
|
2009
|
2010
|
2009
|
|
Average Lifting Costs(1)
|
$1.24
|
$0.64
|
$1.14
|
$0.78
|
|
DD&A (O&G Properties Only)
|
$2.94
|
$2.89
|
$2.95
|
$2.91
|
(1) Lifting costs represent natural gas and oil lease operating expenses, exclusive of production taxes, on a per unit basis.
Per Mcfe
• 2009 per unit costs included an operating cost reimbursement credit which reduced the per unit costs by
approximately $0.15. Second quarter 2010 per unit costs were higher than 2009 second quarter per unit costs
due to: lower production and the addition of approximately $0.29 per unit due to the incurrence of
approximately $1.3 million of environmental maintenance expenses, and well workover expenses of
approximately $1.2 million. When amounts are adjusted for these items the comparison was $.95 per unit in
2010 compared to an adjusted $.79 per unit in 2009. Most of the difference in per unit costs was related to
lower production volumes in 2010.

Appendix
20
8/9/2010

Adjusted Net Income (Loss) from
Continuing Operations Reconciliation
Continuing Operations Reconciliation
Note: Amounts may not foot due to rounding.
|
|
Three Months Ended
|
Six Months Ended
|
||
|
June 30,
|
June 30,
|
|||
|
|
2010
|
2009
|
2010
|
2009
|
|
Net income (loss) from continuing operations
|
($0.3)
|
($33.3)
|
$22.9
|
($39.6)
|
|
Unrealized (gain) loss on derivatives, net (1)
|
(4.2)
|
47.6
|
(24.7)
|
60.8
|
|
Provision for underpayment of gas sales
|
-
|
-
|
-
|
2.6
|
|
Tax effect of above adjustments
|
1.6
|
(18.2)
|
9.3
|
(24.6)
|
|
Adjusted net income (loss) from continuing
operations |
($3.0)
|
($3.9)
|
$7.4
|
($0.8)
|
|
Weighted average diluted shares outstanding
|
19.2
|
14.8
|
19.3
|
14.8
|
|
Adjusted diluted earnings (loss) per share
from continuing operations |
($0.15)
|
($0.27)
|
$0.38
|
($0.06)
|
21
In Millions, Except for Per Share Data
8/9/2010

Adjusted Cash Flow Reconciliation
|
|
Three Months Ended
|
Six Months Ended
|
||
|
June 30,
|
June 30,
|
|||
|
|
2010
|
2009
|
2010
|
2009
|
|
Net Cash provided by operating activities
|
$44.0
|
$24.8
|
$95.4
|
$60.7
|
|
Changes in assets and liabilities
|
(15.2)
|
12.9
|
(17.2)
|
16.7
|
|
Adjusted cash flow from operations
|
$28.8
|
$37.7
|
$78.2
|
$77.4
|
|
Weighted average diluted shares outstanding
|
19.2
|
14.8
|
19.3
|
14.8
|
|
Adjusted cash flow per share
|
$1.50
|
$2.54
|
$4.05
|
$5.23
|
22
In Millions, Except for Per Share Data
8/9/2010

Adjusted EBITDA Reconciliation
|
|
Three Months Ended
|
Six Months Ended
|
||
|
June 30,
|
June 30,
|
|||
|
|
2010
|
2009
|
2010
|
2009
|
|
Net Income (loss) from continuing operations
|
($0.3)
|
($33.3)
|
$22.9
|
($39.6)
|
|
Unrealized (gain) loss on derivatives, net
|
(4.2)
|
47.6
|
(24.7)
|
60.8
|
|
Interest, net
|
7.6
|
9.4
|
15.4
|
17.8
|
|
Income taxes expense (benefit)
|
(0.2)
|
(20.7)
|
13.8
|
(25.1)
|
|
Depreciation, depletion & amortization
|
27.1
|
33.3
|
54.8
|
67.1
|
|
Adjusted EBITDA
|
$30.0
|
$36.3
|
$82.1
|
$81.0
|
|
Weighted average diluted shares outstanding
|
19.2
|
14.8
|
19.3
|
14.8
|
|
Adjusted EBITDA per share
|
$1.56
|
$2.45
|
$4.26
|
$5.47
|
23
In Millions, Except for Per Share Data
8/9/2010

Contact Information
Investor Relations
• Peter Schreck, Vice President - Finance and Treasurer
pschreck@petd.com
• Marti Dowling, Manager Investor Relations
mdowing@petd.com
• Heather Davis, Investor Relations Coordinator
hdavis@petd.com
Corporate Headquarters
• PDC Energy
1775 Sherman Street
Suite 3000
Denver, CO 80203
303-860-5800
Website
• www.petd.com
24
8/9/2010