Attached files
| file | filename |
|---|---|
| 8-K - HELIX ENERGY SOLUTION FORM 8-K DATED 7-28-10 - HELIX ENERGY SOLUTIONS GROUP INC | form8k.htm |
| EX-99.1 - PRESS RELEASE DATED 7-28-10 - HELIX ENERGY SOLUTIONS GROUP INC | exh99-1.htm |
July 29, 2010
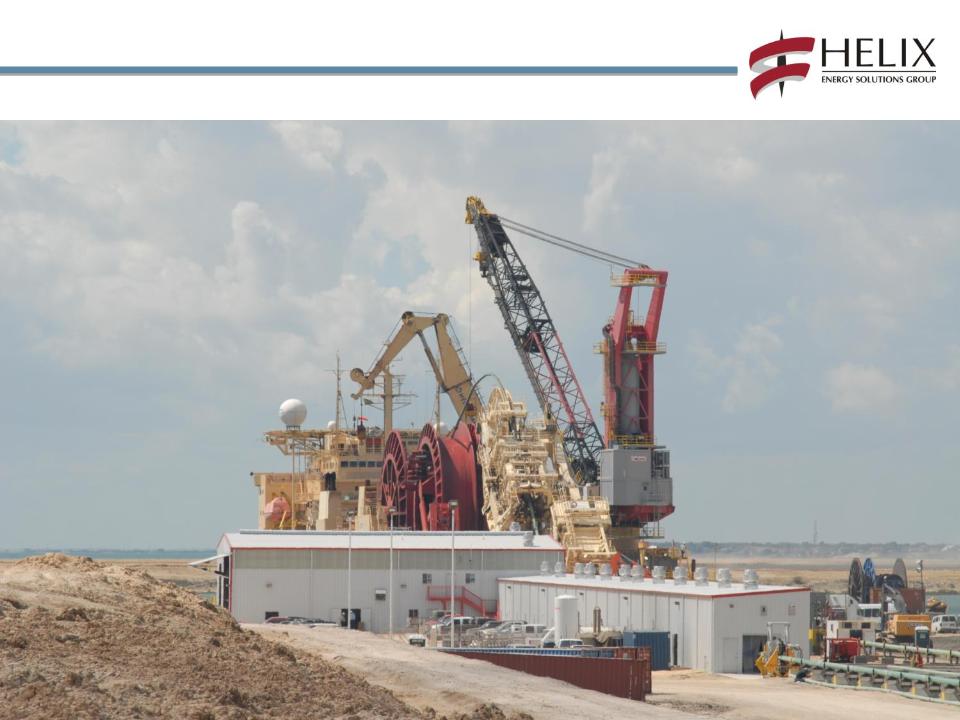
Second Quarter 2010 Conference Call
Helix Producer I operating at BP Macondo spill site

Changing the way you succeed.
Forward-Looking Statements
2
This presentation contains forward-looking statements within the meaning of Section 27A of the Securities Act of
1933 and Section 21E of the Securities Exchange Act of 1934. All such statements, other than statements of
historical fact, are “forward-looking statements” within the meaning of the Private Securities Litigation Reform Act of
1995, including, without limitation, any projections of financial items; future production volumes, results of
exploration, exploitation, development, acquisition and operations expenditures, and prospective reserve levels of
properties or wells; any statements of the plans, strategies and objectives of management for future operations; any
statements concerning developments, performance or industry rankings; and any statements of assumptions
underlying any of the foregoing. These statements involve certain assumptions we made based on our experience
and perception of historical trends, current conditions, expected future developments and other factors we believe
are reasonable and appropriate under the circumstances. The forward-looking statements are subject to a number
of known and unknown risks, uncertainties and other factors that could cause our actual results to differ materially.
The risks, uncertainties and assumptions referred to above include the performance of contracts by suppliers,
customers and partners; employee management issues; local, national and worldwide economic conditions;
uncertainties inherent in the exploration for and development of oil and gas and in estimating reserves; complexities
of global political and economic developments; geologic risks, volatility of oil and gas prices and other risks described
from time to time in our reports filed with the Securities and Exchange Commission (“SEC”), including the Company’s
Annual Report on Form 10-K for the year ended December 31, 2009, and any subsequent quarterly report on Form
10-Q. You should not place undue reliance on these forward-looking statements which speak only as of the date of
this presentation and the associated press release. We assume no obligation or duty and do not intend to update
these forward-looking statements except as required by the securities laws.
References to quantities of oil or gas include amounts we believe will ultimately be produced, and may include
“proved reserves” and quantities of oil or gas that are not yet classified as “proved reserves” under SEC definitions.
Statements of oil and gas reserves are estimates based on assumptions and may be imprecise. Investors are urged
to consider closely the disclosure regarding reserves in our 2009 Form 10-K.

Changing the way you succeed.
Presentation Outline
3
• Executive Summary
Summary of Q2 2010 Results (pg. 4)
2010 Outlook (pg. 8)
• Operational Highlights by Segment
Contracting Services (pg. 11)
Oil & Gas (pg. 17)
• Key Balance Sheet Metrics (pg. 20)
• Non-GAAP Reconciliations (pg. 22)
• Questions & Answers
Q4000 flaring oil and gas at BP Macondo spill site

Changing the way you succeed.
Executive Summary
4
($ in millions, except per share data)
(A) Results of Cal Dive, our former Shelf Contracting business, were consolidated through June 10, 2009, at which time our ownership interest dropped below 50%; thereafter, our remaining
interest was accounted for under the equity method of accounting until September 23, 2009, when we reduced our holdings with the sale of a substantial portion of our remaining interest in
Cal Dive. Revenues from our Shelf Contracting business totaled $197.7 million and $404.7 million in the three and six months ended June 30, 2009.
(B) Included revenues of $73.5 million of previously disputed accrued royalties in first quarter 2009.
(C) After $53.4 million of non-cash charges related to convertible preferred stock in first quarter 2009.
(D) See non-GAAP reconciliations on slides 22-23.
(E) EBITDAX excludes Cal Dive contribution in all periods presented.
(B)
(C)
(A)

Changing the way you succeed.
Executive Summary
5
Second quarter results included the following matters:
• Non-cash impairment charges of $159.9 million ($1.00 per diluted share, after taxes) primarily
associated with a reduction in carrying values of 15 Gulf of Mexico (“GOM”) shelf oil and gas
properties due to a revision in mid-year proved reserve estimates resulting from the
reassessment of field economics.
associated with a reduction in carrying values of 15 Gulf of Mexico (“GOM”) shelf oil and gas
properties due to a revision in mid-year proved reserve estimates resulting from the
reassessment of field economics.
• In addition, we recorded incremental depletion expense of $18.8 million as a result of a reduction
in mid-year proved reserves for our deepwater Bushwood field.
in mid-year proved reserves for our deepwater Bushwood field.

Changing the way you succeed.
Executive Summary
6
• Contracting Services
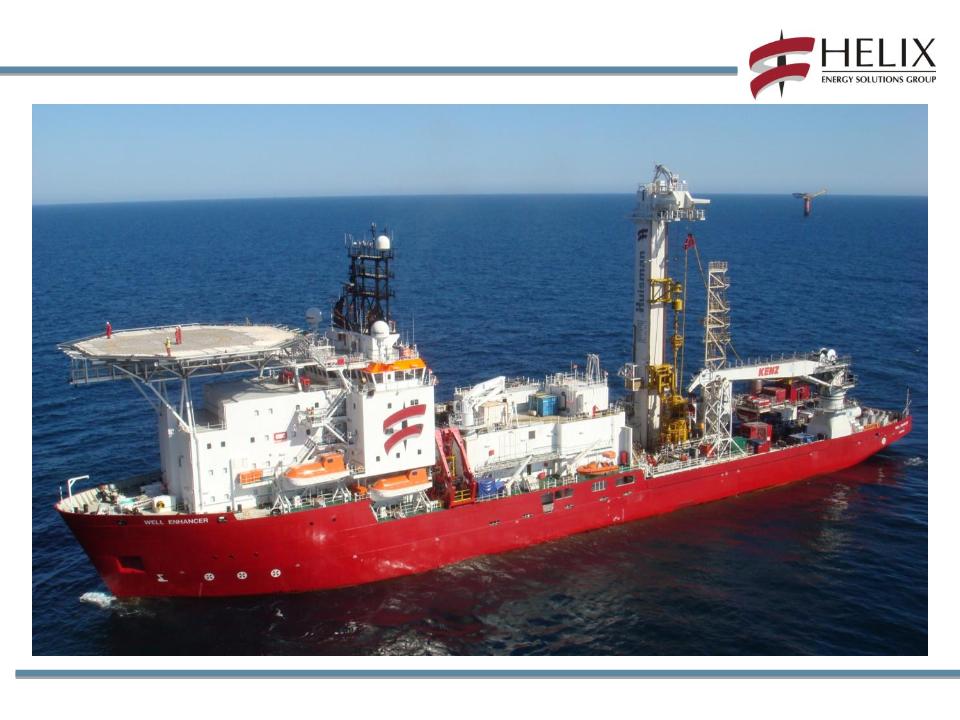
o High utilization of Well Ops vessels; Well Enhancer and Seawell in the North Sea and Q4000 in
the Gulf of Mexico
the Gulf of Mexico
o Helix Producer I placed into service and contracted to BP
o Caesar placed into service and commenced GOM pipeline installation
• Oil and Gas
o Mid-year GOM reserve report finalized, with proved reserves of approximately 400 Bcfe
o Estimated PV-10 value of approximately $1.3 billion
o Downward revision of approximately 140 Bcfe from year end
o Proved developed- 43%
o Proved undeveloped- 57%
o Oil- 40%, Gas- 60%
o Second quarter average production rate of approximately 131 Mmcfe/d
o July average production rate of approximately 110 Mmcfe/d through the 27th
o Phoenix production to start upon return of Helix Producer I from BP spill containment operations

Changing the way you succeed.
Executive Summary
7
• Oil and gas production totaled 11.9 Bcfe for Q2 2010 versus 11.3 Bcfe in Q1 2010
o Avg realized price for oil of $72.59 / bbl ($71.82 / bbl in Q1 2010), inclusive of hedges
o Avg realized price for gas of $6.10 / Mcf ($5.75 / Mcf in Q1 2010), inclusive of hedges
• Balance sheet remains strong (see slide 20)
o Net debt balance of $1.09 billion at June 30, 2010
o Liquidity* of $647 million at June 30, 2010
*Liquidity as we define it is equal to cash and cash equivalents ($270 million), plus available capacity under our revolving credit facility ($377 million).
Oil and Gas (continued)

Changing the way you succeed.
2010 Outlook
8
• Contracting Services activity in Q3 2010 expected to stay consistent with Q2
o Q4 activity forecasted to decline due to seasonal and other factors
o Well intervention activity particularly robust
• Oil and gas revised downward
o Deferred start-up of Phoenix production due to HPI / BP operations
o Higher DD&A rates due to Bushwood reserve revisions; DD&A rates comparable to
Q2, 2010
Q2, 2010
• Capital expenditures of approximately $190 million expected for 2010
o $80 million relates to completion of major vessel projects
o Oil and Gas capital expenditures of approximately $70 million, excluding P&A of
approximately $60 million
approximately $60 million

Changing the way you succeed.
2010 Outlook
9
|
Broad Metrics
|
2010 Higher End
|
2010 Lower End
|
2009
|
|
Production Range
|
45 Bcfe
|
40 Bcfe
|
44 Bcfe
|
|
EBITDA
|
$450 million
|
$400 million
|
$490 million
|
|
CAPEX
|
$190 million
|
$190 million
|
$328 million
|
|
Commodity Price
Deck |
2010 Higher End
|
2010 Lower End
|
2009
|
|
|
Hedged
|
Oil
|
$75.43/ bbl
|
$75.51 / bbl
|
$67.11 / bbl
|
|
Gas
|
$5.82 / mcf
|
$5.94 / mcf
|
$7.75 / mcf
|
|
Changing the way you succeed.
10
Operations Highlights

Changing the way you succeed.
11
($ in millions, except percentages)
(A) Results of Cal Dive, our former
Shelf Contracting business, were
consolidated through June 10,
2009, at which time our ownership
interest dropped below 50%;
thereafter, our remaining interest
was accounted for under the equity
method of accounting until
September 23, 2009, when we
reduced our holdings with the sale
of a substantial portion of our
remaining interest in Cal Dive.
(B) See non-GAAP reconciliation on
slides 22-23. Amounts are prior to
intercompany eliminations.
slides 22-23. Amounts are prior to
intercompany eliminations.
(C) Includes both charter fee to Phoenix
field and BP.
field and BP.
(D) Amounts primarily represent equity
in earnings of Marco Polo and
Independence Hub investments, net
of our share of losses ($4.3 million
and $1.4 million in the second
quarter and first quarter of 2010,
respectively) associated with the
startup of the CloughHelix JV in
Australia.
in earnings of Marco Polo and
Independence Hub investments, net
of our share of losses ($4.3 million
and $1.4 million in the second
quarter and first quarter of 2010,
respectively) associated with the
startup of the CloughHelix JV in
Australia.
Contracting Services
Changing the way you succeed.
Contracting Services Q2 2010 Utilization
Intrepid
Express
Caesar (placed in service end of May)
Express
Caesar (placed in service end of May)
Olympic Canyon
Olympic Triton
Island Pioneer
Seawell
Well Enhancer
Q4000
Well Enhancer
Q4000
40 ROVs
2 ROV Drill Units
5 Trenchers
Deep Cygnus
Normand Fortress
Normand Fortress
12

Changing the way you succeed.
13
Macondo Containment (MC252)
Helix Containment Vessels

Changing the way you succeed.
14
Q4000 as command vessel for top kill operations
Q4000 burning oil & gas
New buoy for HPI under construction
HPI in MC252 processing Macondo production
Helix vessels at work in MC252
Helix is well positioned to support GOM Producers

Changing the way you succeed.
15
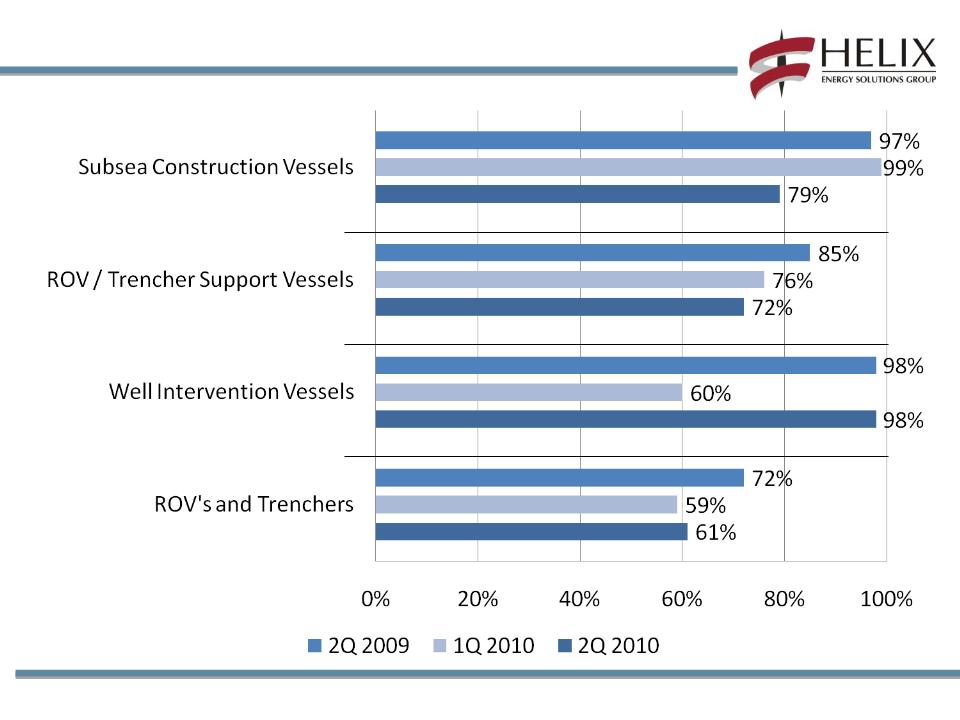
Contracting Services - Subsea Construction
Subsea Construction
• Caesar commenced installation
of 46 mile / 20 inch pipeline in
GOM
of 46 mile / 20 inch pipeline in
GOM
• Express and Intrepid enjoyed
high utilization in the quarter
high utilization in the quarter
• Expect third quarter utilization
for subsea construction fleet to
be >90%
for subsea construction fleet to
be >90%
ROV - Robotics
• Enjoyed high utilization for five chartered ROV support
vessels. Seacor Canyon has been returned to owners
vessels. Seacor Canyon has been returned to owners
• Island Pioneer and Deep Cygnus with Canyon trenchers
T750 and I-Trencher active in North Sea and offshore
Norway
T750 and I-Trencher active in North Sea and offshore
Norway
• Olympic Triton worked for Technip on the Jubilee project
offshore Ghana
offshore Ghana
• All ROV support vessels operated outside of the GOM in Q2
Canyon ROV working on Jubilee project offshore Ghana
Changing the way you succeed.
16
Contracting Services - Well Ops
North America
• Q4000 worked for Newfield on deepwater well
intervention job in April and on BP Macondo
containment, top kill and burn-off in May and June
intervention job in April and on BP Macondo
containment, top kill and burn-off in May and June
• Healthy backlog for remainder of 2010
North Sea
• Seawell and Well Enhancer enjoyed 99% utilization in
the quarter with strong performance on well intervention
projects in the North Sea
the quarter with strong performance on well intervention
projects in the North Sea
• Progressing Statoil Cat B FEED study for new well
intervention semi-submersible for offshore Norway
intervention semi-submersible for offshore Norway
• Healthy backlog for remainder of 2010
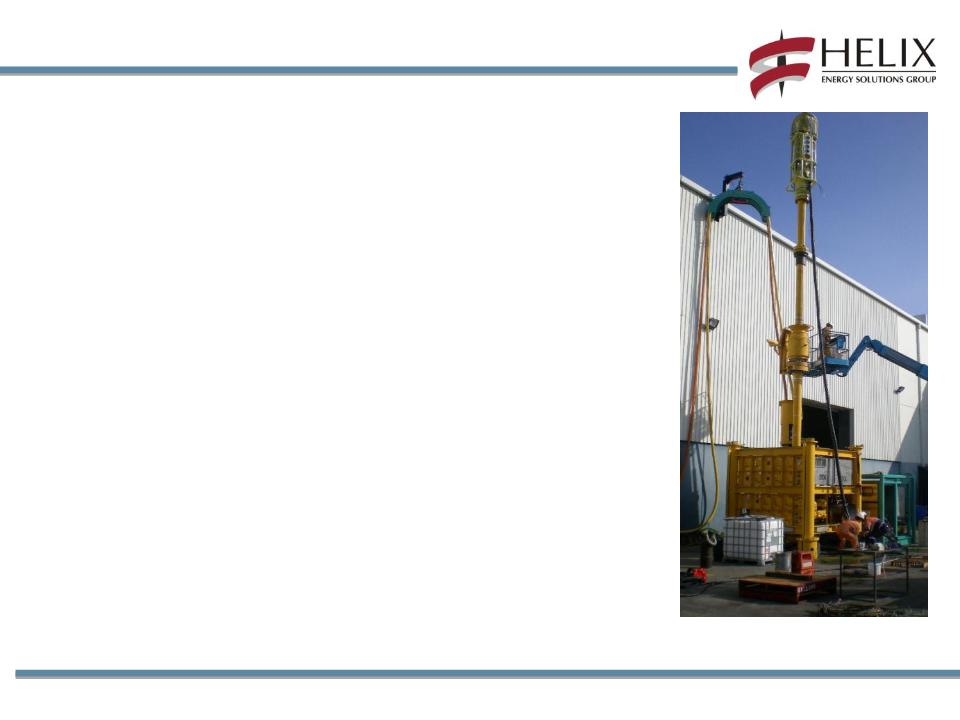
Asia Pacific
• Executed contract with China National Offshore Oil
Company (CNOOC) for Lufeng well intervention project
in South China Sea using the Normand Clough
Company (CNOOC) for Lufeng well intervention project
in South China Sea using the Normand Clough
• Work commenced in Q3, 2010
Well Ops APAC Subsea Intervention Lubricator being
tested for Well Ops Lufeng project
tested for Well Ops Lufeng project

Changing the way you succeed.
17
(A) Reflects hurricane insurance
proceeds less related costs. In
Q2 2009 proceeds totaled $97.7
million, offset by $7.4 million of
hurricane-related repair costs
and $51.5 million of additional
hurricane-related impairment
charges, including an estimated
$43.8 million increase to our
asset retirement obligations for
hurricane-affected properties.
(B) Second quarter 2010
impairments primarily associated
with the reduction in carrying
values of 15 GOM properties due
to a revision in mid-year
reserves. Second quarter 2009
impairments related to reduction
in carrying values of certain oil
and gas properties due to
reserve revisions. First quarter
2010 impairments related to
deterioration in certain field
economics due to lower natural
gas prices in the period.
(C) Including effect of settled hedges
and mark-to-market derivative
contracts.
and mark-to-market derivative
contracts.
Oil & Gas
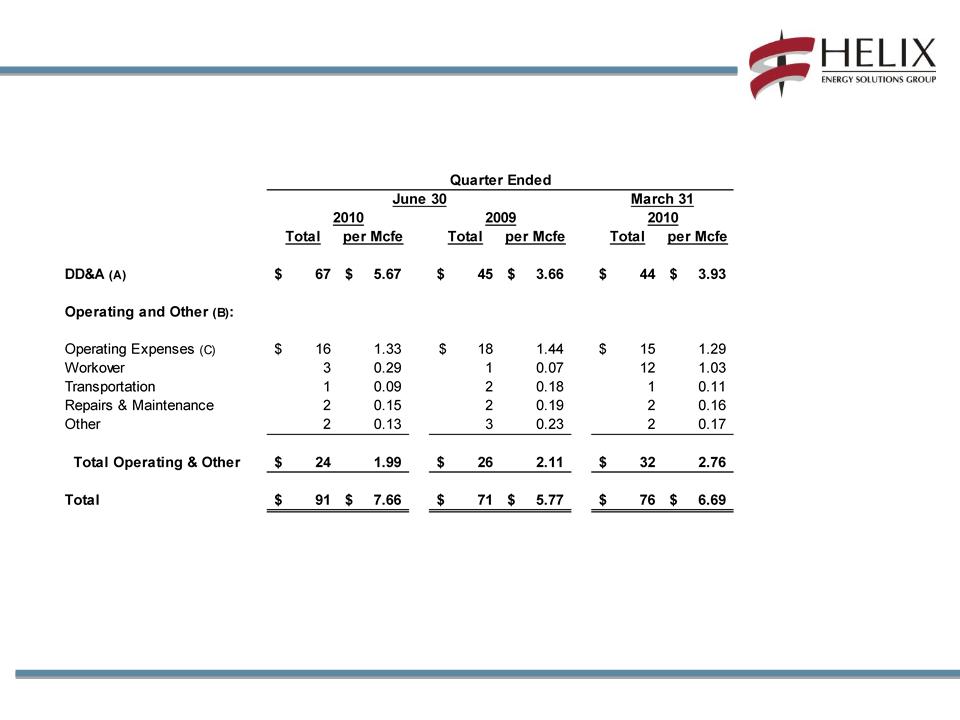
Changing the way you succeed.
Oil & Gas
18
(A) Included accretion expense and an incremental $18.8 million in the quarter ended June 30, 2010 for our Bushwood field.
(B) Excluded hurricane-related repairs of $1.6, $(90.3) and $2.1 million, net of insurance recoveries, for the quarters ended June 30, 2010, June 30, 2009 and
March 31, 2010, respectively.
March 31, 2010, respectively.
(C) Excluded exploration expenses of $1.2, $1.5 and $0.2 million, and abandonment costs of $0.4, $0.8 and $0.8 million for the quarters ended June 30, 2010,
June 30, 2009 and March 31, 2010, respectively.
June 30, 2009 and March 31, 2010, respectively.
Operating Costs ($ in millions, except per Mcfe data)

Changing the way you succeed.
Summary of July 2010 - Dec 2011 Hedging Positions
19
Changing the way you succeed.
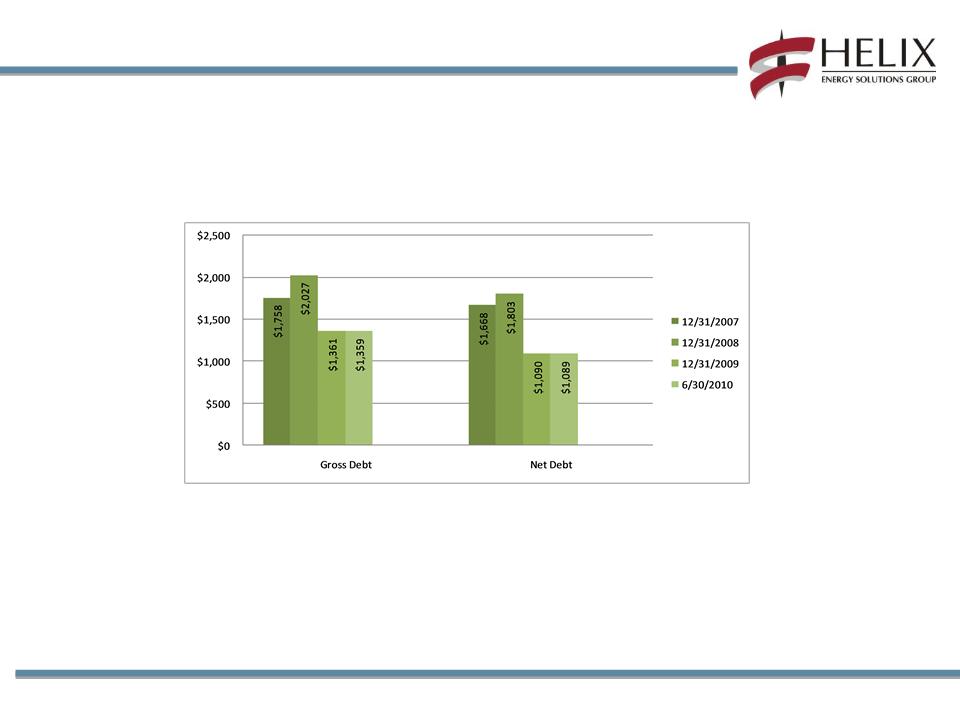
Key Balance Sheet Metrics
20
Debt (A)
Liquidity (B) of $647 million at 6/30/10
(A) Includes impact of unamortized debt discount under our Convertible Senior Notes.
(B) Liquidity as we define it is equal to cash and cash equivalents ($270 million), plus
available capacity under our revolving credit facility ($377 million).
available capacity under our revolving credit facility ($377 million).
Changing the way you succeed.
21
Non-GAAP
Reconciliations
Reconciliations

Changing the way you succeed.
Non GAAP Reconciliations
22
Adjusted EBITDAX ($ in millions)
We calculate adjusted EBITDAX as earnings before net interest expense, taxes, depreciation and amortization,
and exploration expense. Further, we do not include earnings from our former interest in Cal Dive in any periods presented in our adjusted
EBITDAX calculation. These non-GAAP measures are useful to investors and other internal and external users of our financial statements in
evaluating our operating performance because they are widely used by investors in our industry to measure a company's operating
EBITDAX calculation. These non-GAAP measures are useful to investors and other internal and external users of our financial statements in
evaluating our operating performance because they are widely used by investors in our industry to measure a company's operating
performance without regard to items which can vary substantially from company to company and help investors meaningfully compare our results
from period to period. Adjusted EBITDAX should not be considered in isolation or as a substitute for, but instead is supplemental to, income from
operations, net income or other income data prepared in accordance with GAAP. Non-GAAP financial measures should be viewed in addition to,
and not as an alternative to our reported results prepared in accordance with GAAP. Users of this financial information should consider the types
of events and transactions which are excluded.
Changing the way you succeed.
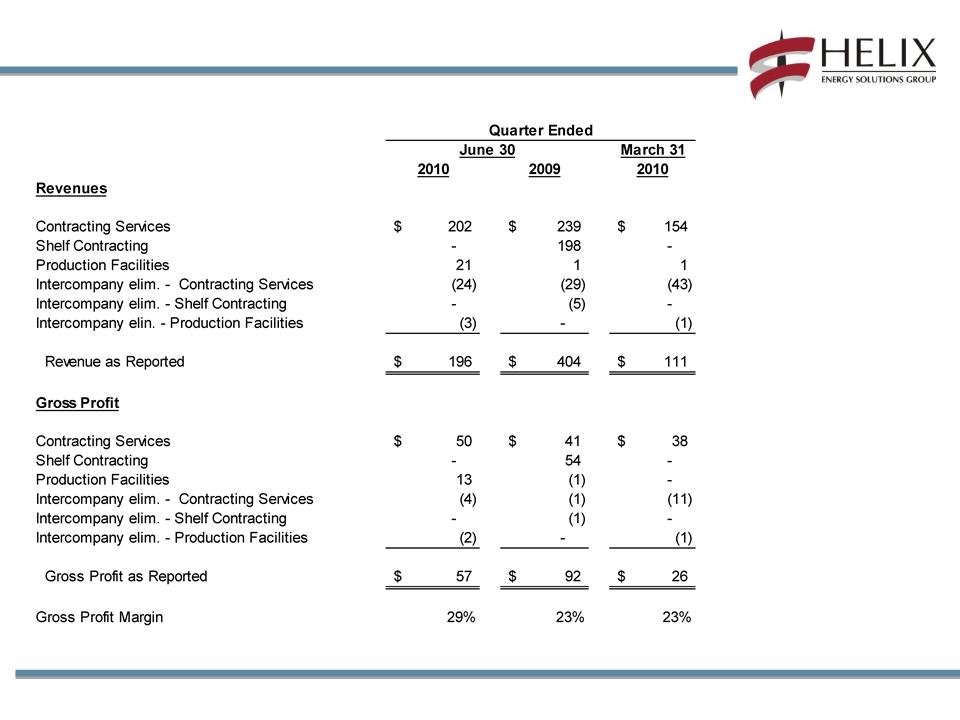
Revenue and Gross Profit As Reported ($ in millions)
23
Non GAAP Reconciliations
Changing the way you succeed.