Attached files
| file | filename |
|---|---|
| 10-K - ANNUAL REPORT - CLIFTON SAVINGS BANCORP INC | clifton10kjune-10.htm |
| EX-32.0 - SECTION 1350 CERTIFICATION OF CHIEF EXECUTIVE OFFICER AND CHIEF FINANCIAL OFFICER - CLIFTON SAVINGS BANCORP INC | clifton10kjune-10ex32.htm |
| EX-31.1 - RULE 13A-14(A)/15D-14(A) CERTIFICATION OF CHIEF EXECUTIVE OFFICER - CLIFTON SAVINGS BANCORP INC | clifton10kjune-10ex31.htm |
| EX-21.0 - LIST OF SUBSIDIARIES - CLIFTON SAVINGS BANCORP INC | clifton10kjune-10ex21.htm |
| EX-23.0 - CONSENT OF PARENTEBEARD LLC - CLIFTON SAVINGS BANCORP INC | clifton10kjune-10ex23.htm |
| EX-31.2 - RULE 13A-14(A)/15D-14(A) CERTIFICATION OF CHIEF FINANCIAL OFFICER - CLIFTON SAVINGS BANCORP INC | clifton10kjune-10ex312.htm |
Exhibit 13.0 Annual Report to Shareholders
Selected Consolidated Financial and Other Data
The following table sets forth certain consolidated summary historical financial information concerning the financial position of Clifton Savings Bancorp, Inc. including its subsidiary, Clifton Savings Bank and Clifton Savings Bank’s subsidiary, Botany Inc., for the dates indicated. The financial data is derived in part from, and should be read in conjunction with, the consolidated financial statements and related notes of Clifton Savings Bancorp, Inc. appearing later in this annual report.
|
At March 31,
|
||||||||||||||||||||
|
2010
|
2009
|
2008
|
2007
|
2006
|
||||||||||||||||
|
(Dollars in thousands)
|
||||||||||||||||||||
|
Financial Condition Data:
|
||||||||||||||||||||
|
Total assets
|
$ | 1,067,707 | $ | 959,770 | $ | 899,056 | $ | 805,042 | $ | 834,880 | ||||||||||
|
Loans receivable, net
|
477,516 | 468,500 | 420,619 | 418,616 | 403,682 | |||||||||||||||
|
Cash and cash equivalents
|
33,461 | 51,126 | 52,231 | 41,105 | 22,623 | |||||||||||||||
|
Securities
|
507,913 | 394,374 | 380,878 | 305,860 | 387,850 | |||||||||||||||
|
Deposits
|
758,152 | 633,582 | 576,722 | 567,459 | 571,962 | |||||||||||||||
|
FHLB advances
|
123,737 | 144,272 | 142,306 | 45,346 | 57,874 | |||||||||||||||
|
Total stockholders’ equity
|
175,992 | 173,164 | 172,355 | 184,598 | 197,748 | |||||||||||||||
|
Year Ended March 31,
|
||||||||||||||||||||
|
2010
|
2009
|
2008
|
2007
|
2006
|
||||||||||||||||
|
(Dollars in thousands, except per share data)
|
||||||||||||||||||||
|
Operating Data:
|
||||||||||||||||||||
|
Interest income
|
$ | 44,956 | $ | 44,401 | $ | 38,570 | $ | 37,520 | $ | 35,352 | ||||||||||
|
Interest expense
|
22,966 | 25,939 | 24,485 | 21,600 | 17,572 | |||||||||||||||
|
Net interest income
|
21,990 | 18,462 | 14,085 | 15,920 | 17,780 | |||||||||||||||
|
Provision for loan losses
|
433 | 260 | 90 | 90 | 160 | |||||||||||||||
|
Net interest income after
|
||||||||||||||||||||
|
provision for loan losses
|
21,557 | 18,202 | 13,995 | 15,830 | 17,620 | |||||||||||||||
|
Noninterest income
|
1,136 | 1,150 | 1,138 | 373 | 265 | |||||||||||||||
|
Noninterest expenses
|
13,250 | 11,852 | 12,125 | 12,380 | 12,094 | |||||||||||||||
|
Income before income taxes
|
9,443 | 7,500 | 3,008 | 3,823 | 5,791 | |||||||||||||||
|
Income taxes
|
3,146 | 2,364 | 636 | 1,351 | 2,124 | |||||||||||||||
|
Net income
|
$ | 6,297 | $ | 5,136 | $ | 2,372 | $ | 2,472 | $ | 3,667 | ||||||||||
|
Basic and diluted earnings per share
|
$ | 0.24 | $ | 0.20 | $ | 0.09 | $ | 0.09 | $ | 0.13 | ||||||||||
5
|
At or For the Year Ended March 31,
|
||||||||||||||||||||
|
2010
|
2009
|
2008
|
2007
|
2006
|
||||||||||||||||
|
Performance Ratios:
|
||||||||||||||||||||
|
Return on average assets
|
0.62 | % | 0.56 | % | 0.29 | % | 0.30 | % | 0.43 | % | ||||||||||
|
Return on average equity
|
3.60 | % | 3.01 | % | 1.34 | % | 1.29 | % | 1.83 | % | ||||||||||
|
Interest rate spread (1)
|
1.96 | % | 1.59 | % | 1.09 | % | 1.23 | % | 1.52 | % | ||||||||||
|
Net interest margin (2)
|
2.31 | % | 2.12 | % | 1.82 | % | 2.01 | % | 2.16 | % | ||||||||||
|
Noninterest expense to average assets
|
1.30 | % | 1.29 | % | 1.49 | % | 1.51 | % | 1.43 | % | ||||||||||
|
Efficiency ratio (3)
|
57.29 | % | 60.43 | % | 79.65 | % | 75.98 | % | 67.02 | % | ||||||||||
|
Average interest-earning assets to
|
||||||||||||||||||||
|
average interest-bearing liabilities
|
1.14 | x | 1.18 | x | 1.23 | x | 1.29 | x | 1.30 | x | ||||||||||
|
Average equity to average assets
|
17.10 | % | 18.51 | % | 21.65 | % | 23.49 | % | 23.76 | % | ||||||||||
|
Basic and diluted earnings per share
|
$ | 0.24 | $ | 0.20 | $ | 0.09 | $ | 0.09 | $ | 0.13 | ||||||||||
|
Dividends per share (4)
|
$ | 0.20 | $ | 0.20 | $ | 0.20 | $ | 0.20 | $ | 0.20 | ||||||||||
|
Dividend payout ratio (4)
|
28.98 | % | 36.45 | % | 86.97 | % | 96.48 | % | 67.96 | % | ||||||||||
|
Capital Ratios (5):
|
||||||||||||||||||||
|
Tangible capital
|
14.52 | % | 15.61 | % | 16.71 | % | 18.27 | % | 17.28 | % | ||||||||||
|
Core capital
|
14.52 | % | 15.61 | % | 16.71 | % | 18.27 | % | 17.34 | % | ||||||||||
|
Risk-based capital
|
41.45 | % | 42.04 | % | 45.02 | % | 46.70 | % | 47.02 | % | ||||||||||
|
|
||||||||||||||||||||
|
Asset Quality Ratios:
|
||||||||||||||||||||
|
Allowance for loan losses as a percent of
|
||||||||||||||||||||
|
total gross loans
|
0.43 | % | 0.36 | % | 0.34 | % | 0.32 | % | 0.31 | % | ||||||||||
|
Allowance for loan losses as a percent of
|
||||||||||||||||||||
|
nonperforming loans
|
83.27 | % | 195.40 | % | 543.40 | % | 523.26 | % | 12600.00 | % | ||||||||||
|
Net charge-offs to average outstanding
|
||||||||||||||||||||
|
loans during the period
|
0.02 | % | 0.00 | % | 0.00 | % | 0.00 | % | 0.00 | % | ||||||||||
|
Nonperforming loans as a percent of
|
||||||||||||||||||||
|
total gross loans
|
0.51 | % | 0.19 | % | 0.06 | % | 0.06 | % | 0.00 | % | ||||||||||
|
Nonperforming assets as a percent of
|
||||||||||||||||||||
|
total assets
|
0.23 | % | 0.09 | % | 0.03 | % | 0.03 | % | 0.00 | % | ||||||||||
|
Other Data:
|
||||||||||||||||||||
|
Number of:
|
||||||||||||||||||||
|
Real estate loans outstanding
|
2,376 | 2,373 | 2,250 | 2,284 | 2,266 | |||||||||||||||
|
Deposit accounts
|
33,277 | 32,249 | 32,633 | 34,410 | 35,658 | |||||||||||||||
|
Full service customer service facilities
|
11 | 10 | 10 | 10 | 10 | |||||||||||||||
____________________________________
|
(1)
|
Represents the difference between the weighted average yield on average interest-earning assets and the weighted average cost of interest-bearing liabilities.
|
|
(2)
|
Represents net interest income as a percent of average interest-earning assets.
|
|
(3)
|
Represents noninterest expense divided by the sum of net interest income and noninterest income, excluding gains or losses on the sale of assets.
|
(4) Reflects only shares of common stock held by stockholders other than Clifton MHC.
(5) Bank only.
6
Management’s Discussion and Analysis of
Financial Condition and Results of Operations
The objective of this section is to help you understand our views on our results of operations and financial condition. You should read this discussion in conjunction with the consolidated financial statements and notes to the consolidated financial statements that appear later in this annual report.
This section contains certain “forward-looking statements” within the meaning of the federal securities laws. These statements are not historical facts, but rather are statements based on Clifton Savings Bancorp, Inc.’s current expectations regarding its business strategies, intended results and future performance. Forward-looking statements are preceded by terms such as “expects,” “believes,” “anticipates,” “intends” and similar expressions.
Management’s ability to predict results or the effect of future plans or strategies is inherently uncertain. Factors which could affect actual results include interest rate trends, the general economic climate in the market area in which Clifton Savings Bancorp operates, as well as nationwide, Clifton Savings Bancorp’s ability to control costs and expenses, competitive products and pricing, loan delinquency rates and changes in federal and state legislation and regulation. These factors should be considered in evaluating the forward-looking statements and undue reliance should not be placed on such statements. Clifton Savings Bancorp assumes no obligation to update any forward-looking statements.
Overview
Income. We have two primary sources of pre-tax income. The first is net interest income. Net interest income is the difference between interest income (which is the income that we earn on our loans and investments) and interest expense (which is the interest that we pay on our deposits and borrowings).
To a much lesser extent, we also recognize pre-tax income from fee and service charge income – the compensation we receive from providing products and services, and the increase in the cash surrender value of bank owned life insurance. Most of our fee and service charge income comes from service charges on deposit accounts and fees for late loan payments. We also earn fee and service charge income from ATM charges and other fees and charges. The cash surrender value of bank owned life insurance is recorded in the consolidated statement of financial condition as an asset and the change in cash surrender value is recorded as non-interest income.
Expenses. The expenses we incur in operating our business consist of salary and employee benefits expenses, occupancy expenses, equipment expenses, directors’ compensation, advertising expenses, legal expenses, federal deposit insurance premiums and other miscellaneous expenses.
Salary and employee benefits expenses consist primarily of the salaries and wages paid to our employees, payroll taxes and expenses for retirement and other employee benefits.
Occupancy expenses, which are the fixed and variable costs of building and related equipment, consist primarily of lease payments, real estate taxes, depreciation charges, maintenance and costs of utilities.
Equipment expenses include fees paid to our third-party data processing service, telephone expense and expenses and depreciation charges related to premises and banking equipment. Depreciation of premises and banking equipment is computed using the straight-line method based on the useful lives of the related assets. Estimated lives are 5 to 40 years for building and improvements, 5 to 20 years for land improvements and 2 to 10 years for furniture and equipment. Leasehold improvements are amortized over the shorter of the useful life of the asset or term of the lease.
Directors’ compensation expense includes stock option and restricted stock expense, retirement benefits and directors’ fees.
Advertising expenses include costs relating to marketing, promotional items and related expenses.
7
Legal expenses include attorneys’ fees related to litigation, corporate, securities, regulatory and other legal matters.
Federal insurance premiums are payments we make to the Federal Deposit Insurance Corporation for the insurance of customer deposit accounts.
Other expenses include expenses for accountants and consultants, charitable contributions, insurance, office supplies, printing, postage and other miscellaneous operating expenses.
Critical Accounting Policies
We consider accounting policies involving significant judgments and assumptions by management that have, or could have, a material impact on the carrying value of certain assets or on income, to be critical accounting policies. Material estimates that are particularly susceptible to significant changes relate to the determination of the allowance for loan losses, the assessment of prepayment risks associated with mortgage-backed securities, the identification of other-than-temporary impairment of securities, determination of the liability and expense on our defined benefit plans, and the determination of the amount of deferred income tax assets which are more likely than not to be realized.
Allowance for Loan Losses. Determining the amount of the allowance for loan losses necessarily involves a high degree of judgment. Management reviews the level of the allowance on a monthly basis and establishes the provision for loan losses based on the composition of the loan portfolio, delinquency levels, loss experience, economic conditions and other factors related to the collectability of the loan portfolio.
Although we believe that we use the best information available to establish the allowance for loan losses, future additions to the allowance may be necessary based on estimates that are susceptible to change as a result of changes in economic conditions and other factors. In addition, the Office of Thrift Supervision, as an integral part of its examination process, periodically reviews our allowance for loan losses. That agency may require us to recognize adjustments to the allowance based on its judgments about information available to it at the time of its examination.
Mortgage-Backed Securities. Assessments of prepayment risks related to mortgage-backed securities are based upon current market conditions which are subject to frequent change. We believe that the prepayment risks associated with mortgage-backed securities are properly recognized.
Deferred Income Taxes. We use the asset and liability method of accounting for income taxes. Under this method, deferred tax assets and liabilities are recognized for the future tax consequences attributable to differences between the financial statement carrying amounts of existing assets and liabilities and their respective tax bases. If current available information raises doubt as to the realization of the deferred tax assets, a valuation allowance is established. Deferred tax assets and liabilities are measured using enacted tax rates expected to apply to taxable income in the years in which those temporary differences are expected to be recovered or settled. We exercise significant judgment in evaluating the amount and timing of recognition of the resulting tax assets and liabilities. These judgments require us to make projections of future taxable income. The judgments and estimates we make in determining our deferred tax assets, which are inherently subjective, are reviewed on a continual basis as regulatory and business factors change. Any reduction in estimated future taxable income may require us to record a valuation allowance against our deferred tax assets. A valuation allowance would result in additional income tax expense in the period in which it is recognized, which would negatively affect earnings. Management believes, based upon current facts, that it is more likely than not that there will be sufficient taxable income in future years to realize the deferred tax assets.
The Company accounts for uncertainty in income taxes recognized in the consolidated financial statements in accordance with ASC Topic 740, “Income Taxes,” which prescribes a recognition threshold and measurement attribute for the financial statement recognition and measurement of a tax position taken or expected to be taken in a tax return, and also provides guidance on derecognition, classification, interest and penalties, accounting in interim periods, disclosure and transition. As a result of the Company’s evaluation, no significant income tax uncertainties have been identified. Therefore, the Company recognized no adjustment for unrecognized income tax benefits for the years ended March 31, 2010, 2009 and 2008. Our policy is to recognize interest and penalties on unrecognized tax benefits in income taxes expense in the consolidated statement of income. The Company did not recognize any interest and penalties for the years ended March 31, 2010, 2009, and 2008. The tax years subject to examination by the taxing authorities are the years ended December 31, 2009, 2008, and 2007 for federal and the years ended December 31, 2009, 2008, 2007 and 2006 for New Jersey.
8
Defined Benefit Plans. The liability and expense for our defined benefit plans are based upon actuarial assumptions of future events, including interest rates, rates of increase in compensation and the length of time we will have to provide those benefits. Actual results may differ from these assumptions. These assumptions are reviewed and updated annually and management believes the estimates are reasonable.
Other-Than-Temporary Impairment. An individual security is considered impaired when the fair value of such security is less than its amortized cost. Management evaluates all securities with unrealized losses quarterly to determine if such impairments are temporary or “other-than-temporary” in accordance with applicable accounting guidance. The Company accounts for temporary impairments based upon security classification as either available for sale or held to maturity. Temporary impairments on available for sale securities are recognized on a tax-effected basis, through other comprehensive income (loss) with offsetting entries adjusting the carrying value of the securities and the balance of deferred income taxes. Temporary impairments of held to maturity securities are not recognized in the consolidated financial statements. Information concerning the amount and duration of impairments on securities is disclosed in the notes to the consolidated financial statements.
Other-than-temporary impairments on debt securities that the Company has decided to sell or will more likely than not be required to sell prior to the full recovery of their fair value to a level to, or exceeding, amortized cost are recognized in earnings. Otherwise, the other-than-temporary impairment is bifurcated into credit related and noncredit-related components. The credit related impairment generally represents the amount by which the present value of the cash flows expected to be collected on a debt security falls below its amortized cost. The noncredit-related component represents the remaining portion of the impairment not otherwise designated as credit-related. Credit related other-than-temporary impairments are recognized in earnings while noncredit-related other-than-temporary impairments are recognized, net of deferred income taxes, in other comprehensive income (loss).
Operating Strategy
Our mission is to continue to operate and grow a profitable community-oriented financial institution serving primarily retail customers in our market area. We plan to achieve this by:
|
|
•
|
operating as an independent community-oriented financial institution;
|
|
|
•
|
pursuing opportunities to increase our loan portfolio by purchasing New Jersey loans;
|
|
|
•
|
continuing to use conservative underwriting practices to maintain the high quality of our loan portfolio;
|
|
|
•
|
managing our investment and borrowing portfolios and
|
|
|
•
|
increasing deposits.
|
9
|
|
Operating as an independent community-oriented financial institution
|
We have a long tradition of focusing on the needs of consumers in our community and being an active corporate citizen. Unlike some large banks, our decisions are made locally. We have many long time branch employees, and customers have access to senior management. In recent years we have expanded our customer service initiatives. In addition to standard conveniences such as ATMs, we offer extended hours and telephone and internet banking. We deliver personalized service and respond with flexibility to customer needs. We believe our community orientation is attractive to our customers and distinguishes us from the large regional banks and other financial institutions that operate in our market area. We intend to maintain this focus as we grow.
Pursuing opportunities to increase our loan portfolio by purchasing New Jersey loans
We will pursue the purchase of New Jersey loans originated by third parties while continuing to originate such loans in accordance with our conservative underwriting guidelines. Purchased loan packages are subject to the same stringent guidelines established for our own origination process. By purchasing loans we supplement loan demand in our lending areas and minimize overhead costs.
Continuing to use conservative underwriting practices to maintain the high quality of our loan portfolio
We believe that high asset quality is a key to long-term financial success. We have sought to maintain a high level of asset quality and moderate credit risk by using underwriting standards which we believe are conservative. At March 31, 2010, our nonperforming loans (loans which are 90 or more days delinquent) were 0.51% of our total loan portfolio and 0.23% of our total assets. We intend to continue our philosophy of managing large loan exposures of all loan types through our conservative approach to lending.
Managing our investment and borrowing portfolios
Our liquidity, income and interest rate risk are largely affected by the management of our investment and borrowings portfolios. During the year ended March 31, 2010, we purchased a mix of mortgage-backed securities and short and intermediate-term callable U.S. Government agency obligations in an effort to increase yield while managing our liquidity and interest rate sensitivity. The majority of the mortgage-backed securities generally matures within a range of fifteen years to thirty years but have substantially higher yields than agency securities. We also purchased short-term callable U.S. Government obligations to provide an additional source of liquidity during the next one to five years. In addition we purchased intermediate-term callable U.S. Government agency obligations with higher yields and rates that increase after certain intervals and generally mature within fifteen years. We will continue to monitor market conditions to determine the best method of generating a favorable return without incurring undue additional risk.
Increasing deposits
Our primary source of funds is our deposit accounts. Deposits increased $124.6 million, or 19.7%, since March 31, 2009 as we have been successful in attracting deposits by consistently pricing our products slightly higher than that of local competition. We intend to increase our future deposits by continuing to offer exceptional customer service, competitive rates, as well as enhancing and expanding our branch network.
10
Results of Operations for the Years Ended March 31, 2010, 2009 and 2008
Overview.
|
2010
|
2009
|
2008
|
% Change
2010/2009
|
% Change
2009/2008
|
||||||||
|
(Dollars in thousands)
|
||||||||||||
|
Net earnings
|
$6,297
|
$5,136
|
$2,372
|
22.61%
|
116.53%
|
|||||||
|
Return on average assets
|
0.62
|
%
|
0.56
|
%
|
0.29
|
%
|
10.71%
|
93.10%
|
||||
|
Return on average equity
|
3.60
|
%
|
3.01
|
%
|
1.34
|
%
|
19.60%
|
124.63%
|
||||
2010 v. 2009. Net earnings increased primarily due to an increase in net interest income as a result of an increase in the interest rate spread from 1.59% in 2009 to 1.96% in 2010, partially offset by increases in provision for loan losses, non-interest expense and income tax expense.
2009 v. 2008. Net earnings increased primarily due to an increase in net interest income as a result of an increase in the interest rate spread from 1.09% in 2008 to 1.59% in 2009, partially offset by increases in the provision for loan losses and income taxes.
Net Interest Income.
2010 v. 2009. Net interest income increased $3.5 million, or 18.9%, to $22.0 million for 2010. The increase in net interest income for 2010 was attributable to a 37 basis points increase in the interest rate spread which was due to a decrease of 76 basis points in the cost of interest-bearing liabilities, partially offset by a decrease of 39 basis points in the yield earned on interest-earning assets.
Total interest income increased $555,000 or 1.2%, to $45.0 million for 2010, resulting from an increase in the balance of interest-earning assets, as the average yield on these assets decreased for the period. During 2010, the balance of average interest-earning assets increased $83.4 million, or 9.6%, while the average yield on interest-earning assets decreased 39 basis points to 4.72%. The composition of interest-earning assets generally consists of loans, securities and interest-earning deposits. The increase in average interest-earning assets was primarily due to increases of $25.6 million in loans, $28.1 million in mortgage-backed securities, and $35.1 million in investment securities, partially offset by a decrease of $5.4 million in other interest-earning assets. Interest on loans and mortgage-backed securities increased by 3.1% due to the redeployment of calls and maturities of investment securities and the decrease in other interest-earning assets into higher yielding assets. Interest on investment securities and other interest-earning assets decreased by 16.5% due to a significant decrease in yield.
Total interest expense decreased $3.0 million, or 11.5%, to $23.0 million for 2010 due to a decrease in the average interest rate paid on interest-bearing liabilities of 76 basis points to 2.76%, partially offset by an increase of $95.1 million, or 12.9% in the balance on average interest-bearing liabilities.
2009 v. 2008. Net interest income increased $4.4 million, or 31.2%, to $18.5 million for 2009. The increase in net interest income for 2009 was attributable to a 50 basis points increase in the interest rate spread which was due to an increase of 12 basis points in the yield earned on interest-earning assets coupled with a decrease of 38 basis points in the cost of interest-bearing liabilities.
Total interest income increased $5.8 million or 15.0%, to $44.4 million for 2009, resulting from an increase in the rate earned on average interest-earning assets coupled with an increase in the balance of average interest-earning assets. During 2009, the average yield on interest-earning assets increased 12 basis points to 5.11%, coupled with an increase of $97.0 million, or 12.6%, in the balance of average interest-earning assets to $869.6 million. The composition of interest-earning assets generally consists of loans, securities and interest-earning deposits. The increase in average interest-earning assets was primarily due to increases of $29.7 million in loans and $132.1 million in mortgage-backed securities, partially offset by decreases of $59.6 million in investment securities and $5.2 million in other interest-earning assets. Interest on loans and mortgage-backed securities increased by 31.1% due to the redeployment of calls and maturities of investment securities and the decrease in other interest-earning assets into higher yielding assets. Interest on investment securities and other interest-earning assets decreased by 46.9% due to the significant decreases in both the yield and average balances.
11
Total interest expense increased $1.4 million, or 5.7%, to $25.9 million for 2009 due to an increase of $109.6 million, or 17.5% in the balance on average interest-bearing liabilities, partially offset by a decrease in the average interest rate paid on interest-bearing liabilities of 38 basis points to 3.52%.
Average Balances and Yields. The following table presents information regarding average balances of assets and liabilities, as well as the total dollar amounts of interest income and dividends from average interest-earning assets and interest expense on average interest-bearing liabilities and the resulting average yields and costs. The yields and costs for the periods indicated are derived by dividing income or expense by the average balances of assets or liabilities, respectively, for the periods presented. For purposes of this table, average balances have been calculated using the average of month-end balances, and nonaccrual loans are included in average balances; however, accrued interest income has been excluded from these loans. Loan fees (costs) are included in interest income on loans and are insignificant. Yields are not presented on a tax-equivalent basis. Any adjustments necessary to present yields on a tax equivalent basis are insignificant.
12
|
Year Ended March 31,
|
|||||||||||||||||||||||||||||||||||||
|
2010
|
2009
|
2008
|
|||||||||||||||||||||||||||||||||||
|
Average
Balance
|
Interest
and
Dividends
|
Yield/
Cost
|
Average
Balance
|
Interest
and
Dividends
|
Yield/
Cost
|
Average
Balance
|
Interest
and
Dividends
|
Yield/ Cost | |||||||||||||||||||||||||||||
|
(Dollars in thousands)
|
|||||||||||||||||||||||||||||||||||||
|
Assets:
|
|||||||||||||||||||||||||||||||||||||
|
Interest-earning assets:
|
|||||||||||||||||||||||||||||||||||||
|
Loans
receivable
|
$ | 478,740 | $ | 24,550 | 5.13 | % | $ | 453,137 | $ | 23,966 | 5.29 | % | $ | 423,477 | $ | 22,148 | 5.23 | % | |||||||||||||||||||
|
Mortgage-backed securities
|
336,039 | 16,905 | 5.03 | % | 307,941 | 16,240 | 5.27 | % | 175,826 | 8,521 | 4.85 | % | |||||||||||||||||||||||||
|
Investment
securities
|
112,398 | 3,037 | 2.70 | % | 77,306 | 3,515 | 4.55 | % | 136,912 | 6,403 | 4.68 | % | |||||||||||||||||||||||||
|
Other interest-earning assets
|
25,854 | 464 | 1.79 | % | 31,229 | 680 | 2.18 | % | 36,389 | 1,498 | 4.12 | % | |||||||||||||||||||||||||
|
Total interest-earning assets
|
953,031 | 44,956 | 4.72 | % | 869,613 | 44,401 | 5.11 | % | 772,604 | 38,570 | 4.99 | % | |||||||||||||||||||||||||
|
Noninterest-earning assets
|
69,143 | 51,406 | 42,110 | ||||||||||||||||||||||||||||||||||
|
Total assets
|
$ | 1,022,174 | $ | 921,019 | $ | 814,714 | |||||||||||||||||||||||||||||||
|
Liabilities and equity:
|
|||||||||||||||||||||||||||||||||||||
|
Interest-bearing liabilities:
|
|||||||||||||||||||||||||||||||||||||
|
Demand
accounts
|
$ | 50,713 | 481 | 0.95 | % | $ | 49,952 | 835 | 1.67 | % | $ | 48,818 | 1,199 | 2.46 | % | ||||||||||||||||||||||
|
Savings and Club accounts
|
96,761 | 1,009 | 1.04 | % | 90,258 | 996 | 1.10 | % | 94,570 | 1,076 | 1.14 | % | |||||||||||||||||||||||||
|
Certificates
of deposits
|
547,159 | 16,188 | 2.96 | % | 447,801 | 18,260 | 4.08 | % | 419,967 | 19,791 | 4.71 | % | |||||||||||||||||||||||||
|
Total interest-bearing deposits
|
694,633 | 17,678 | 2.54 | % | 588,011 | 20,091 | 3.42 | % | 563,355 | 22,066 | 3.92 | % | |||||||||||||||||||||||||
|
FHLB
Advances
|
137,965 | 5,288 | 3.83 | % | 149,468 | 5,848 | 3.91 | % | 64,527 | 2,419 | 3.75 | % | |||||||||||||||||||||||||
|
Total interest-bearing liabilities
|
832,598 | 22,966 | 2.76 | % | 737,479 | 25,939 | 3.52 | % | 627,882 | 24,485 | 3.90 | % | |||||||||||||||||||||||||
|
Noninterest-bearing liabilities:
|
|||||||||||||||||||||||||||||||||||||
|
Noninterest-bearing deposits
|
5,818 | 4,830 | 3,478 | ||||||||||||||||||||||||||||||||||
|
Other noninterest-bearing liabilities
|
9,012 | 8,270 | 6,947 | ||||||||||||||||||||||||||||||||||
|
Total noninterest-bearing
liabilities
|
14,830 | 13,100 | 10,425 | ||||||||||||||||||||||||||||||||||
|
Total
liabilities
|
847,428 | 750,579 | 638,307 | ||||||||||||||||||||||||||||||||||
|
Stockholders'
equity
|
174,746 | 170,440 | 176,407 | ||||||||||||||||||||||||||||||||||
|
Total liabilities and stockholders’
equity
|
$ | 1,022,174 | $ | 921,019 | $ | 814,714 | |||||||||||||||||||||||||||||||
|
Net interest
income
|
$ | 21,990 | $ | 18,462 | $ | 14,085 | |||||||||||||||||||||||||||||||
|
Interest rate
spread
|
1.96 | % | 1.59 | % | 1.09 | % | |||||||||||||||||||||||||||||||
|
Net interest
margin
|
2.31 | % | 2.12 | % | 1.82 | % | |||||||||||||||||||||||||||||||
|
Average interest-earning assets
|
|||||||||||||||||||||||||||||||||||||
|
to average interest-bearing
|
|||||||||||||||||||||||||||||||||||||
|
liabilities
|
1.14 | x | 1.18 | x | 1.23 | x | |||||||||||||||||||||||||||||||
13
Rate/Volume Analysis. The following table sets forth the effects of changing rates and volumes on our net interest income. The rate column shows the effects attributable to changes in rate (changes in rate multiplied by prior volume). The volume column shows the effects attributable to changes in volume (changes in volume multiplied by prior rate). The net column represents the sum of the prior columns. For purposes of this table, changes attributable to changes in both rate and volume that cannot be segregated have been allocated proportionately based on the changes due to rate and the changes due to volume.
|
2010 Compared to 2009
|
2009 Compared to 2008
|
|||||||||||||||||||||||
|
Increase (Decrease) Due to
|
Increase (Decrease) Due to
|
|||||||||||||||||||||||
|
Volume
|
Rate
|
Net
|
Volume
|
Rate
|
Net
|
|||||||||||||||||||
|
(In thousands)
|
||||||||||||||||||||||||
|
Interest income:
|
||||||||||||||||||||||||
|
Loans receivable
|
$ | 1,325 | $ | (741 | ) | $ | 584 | $ | 1,562 | $ | 256 | $ | 1,818 | |||||||||||
|
Mortgage-backed securities
|
1,430 | (765 | ) | 665 | 6,921 | 798 | 7,719 | |||||||||||||||||
|
Investment securities
|
1,257 | (1,735 | ) | (478 | ) | (2,715 | ) | (173 | ) | (2,888 | ) | |||||||||||||
|
Other interest-earning assets
|
(106 | ) | (110 | ) | (216 | ) | (189 | ) | (629 | ) | (818 | ) | ||||||||||||
|
Total interest income
|
3,906 | (3,351 | ) | 555 | 5,579 | 252 | 5,831 | |||||||||||||||||
|
Interest expense:
|
||||||||||||||||||||||||
|
Demand deposits
|
12 | (366 | ) | (354 | ) | 27 | (391 | ) | (364 | ) | ||||||||||||||
|
Savings and Club accounts
|
69 | (56 | ) | 13 | (45 | ) | (35 | ) | (80 | ) | ||||||||||||||
|
Certificates of deposit
|
3,557 | (5,629 | ) | (2,072 | ) | 1,246 | (2,777 | ) | (1,531 | ) | ||||||||||||||
|
Total deposit expense
|
3,638 | (6,051 | ) | (2,413 | ) | 1,228 | (3,203 | ) | (1,975 | ) | ||||||||||||||
|
FHLB advances
|
(442 | ) | (118 | ) | (560 | ) | 3,321 | 108 | 3,429 | |||||||||||||||
|
Total interest expense
|
3,196 | (6,169 | ) | (2,973 | ) | 4,549 | (3,095 | ) | 1,454 | |||||||||||||||
|
Net interest income
|
$ | 710 | $ | 2,818 | $ | 3,528 | $ | 1,030 | $ | 3,347 | $ | 4,377 | ||||||||||||
Provision for Loan Losses.
2010 v. 2009. We recorded a provision for loan losses of $433,000 during the year ended March 31, 2010, compared to $260,000 during the year ended March 31, 2009. The increase in the provision for loan losses was a result of both increases in non-performing loans and, to a much lesser extent, the loan portfolio balance. Gross loans increased 2.2% during the period. Non-performing loans increased from $870,000 to $2.5 million, or 183.0%, from March 31, 2009 to 2010.
2009 v. 2008. We recorded a provision for loan losses of $260,000 during the year ended March 31, 2009, compared to $90,000 during the year ended March 31, 2008. The increase in the provision for loan losses was a result of both increases in non-performing loans and the loan portfolio balance. Gross loans increased 11.4% during the period. Non-performing loans increased from $265,000 to $870,000, or 228.3%, from March 31, 2008 to 2009.
An analysis of the changes in the allowance for loan losses is presented under “Risk Management— Analysis of Nonperforming and Classified Assets.”
Non-interest Income. The following table shows the components of non-interest income and the percentage changes from 2010 versus 2009 and from 2009 versus 2008.
|
2010
|
2009
|
2008
|
% Change
2010/2009
|
%Change
2009/2008
|
|||||||||||||||||
|
(Dollars in thousands)
|
|||||||||||||||||||||
|
Fees and service charges
|
$ | 223 | $ | 204 | $ | 210 | 9.31 | % | (2.86 | )% | |||||||||||
|
Bank owned life insurance
|
887 | 914 | 905 | (2.95 | ) | 0.99 | |||||||||||||||
|
Other
|
26 | 32 | 23 | (18.75 | ) | 39.13 | |||||||||||||||
|
Total
|
$ | 1,136 | $ | 1,150 | $ | 1,138 | (1.22 | )% | 1.05 | % | |||||||||||
14
2010 v. 2009. Non-interest income decreased primarily due to decreases in income from the cash surrender value of bank owned life insurance and other non-interest income, partially offset by an increase in fees and service charges on loans and deposits during the year ended March 31, 2010.
2009 v. 2008. Non-interest income increased due to increases in income from the cash surrender value of bank owned life insurance and other non-interest income during the year ended March 31, 2009.
Non-interest Expense. The following table shows the components of non-interest expense and the percentage changes from 2010 versus 2009 and from 2009 versus 2008.
|
2010
|
2009
|
2008
|
% Change
2010/2009
|
%Change
2009/2008
|
|
||||||||||||||||
|
(Dollars in thousands)
|
|||||||||||||||||||||
|
Salaries and employee benefits
|
$ | 6,810 | $ | 6,842 | $ | 6,957 | (0.47 | )% | (1.65 | )% | |||||||||||
|
Occupancy expense of premises
|
1,249 | 1,052 | 1,032 | 18.73 | 1.94 | ||||||||||||||||
|
Equipment
|
952 | 863 | 886 | 10.31 | (2.60 | ) | |||||||||||||||
|
Directors’ compensation
|
796 | 943 | 1,000 | (15.59 | ) | (5.70 | ) | ||||||||||||||
|
Advertising
|
253 | 269 | 316 | (5.95 | ) | (14.87 | ) | ||||||||||||||
|
Legal
|
254 | 85 | 307 | 198.82 | (72.31 | ) | |||||||||||||||
|
Federal insurance premium
|
1,183 | 328 | 68 | 260.67 | 382.35 | ||||||||||||||||
|
Other
|
1,753 | 1,470 | 1,559 | 19.25 | (5.71 | ) | |||||||||||||||
|
Total
|
$ | 13,250 | $ | 11,852 | $ | 12,125 | 11.80 | % | (2.25 | )% | |||||||||||
2010 v. 2009. Occupancy expense of premises increased due to expenses associated with the opening of an additional branch during the year, and the renovation and repairs of other branch premises. Federal deposit insurance premiums increased due to an increase in the quarterly assessment rates for all financial institutions, along with a special emergency assessment imposed by the Federal Deposit Insurance Corporation in order to cover the losses of the Deposit Insurance Fund that were incurred from failed financial institutions, as well as anticipated future losses. Legal expenses increased mainly due to a $92,000 insurance recovery in fiscal 2009 which caused that year’s expense to decrease, coupled with additional expenses in fiscal 2010 related to several matters including the leasing of new branch locations. The increase in other expenses was mainly due to an increase of $153,000 in consulting fees, as $49,000 of previously expensed consulting fees relating to litigation reimbursement were recovered in fiscal 2009, coupled with an increase of $84,000 in consulting fees in fiscal 2010 due to costs associated with information systems testing, an insurance coverage adequacy review, financial advisory fees, a compensation review, and branch feasibility studies. Other expenses also increased due to a $38,000 increase in correspondent bank service fees, as well as increases of $32,000 in stationary, printing and supplies and $21,000 in federal supervisory fees.
2009 v. 2008. Salaries and employee benefits decreased due to a decrease in stock option and employee stock ownership plan expenses. Directors’ compensation decreased mostly due to a decrease in stock option expense. Advertising expenses decreased as a result of a reduction in the number of newspaper advertisements during the 2009 period. Legal fees decreased as a result of a $92,000 insurance recovery of previously expensed fees relating to litigation and a corresponding decrease in litigation costs. The increase of $260,000 in federal deposit insurance premiums was primarily attributable to an increase in assessment rates along with a new assessment on certain noninterest-bearing transaction accounts under the FDIC’s Temporary Liquidity Guarantee Program. Other expenses decreased mainly due to a $49,000 recovery of previously expensed consulting fees relating to litigation and the elimination of $47,000 in State of New Jersey bank supervisory fees due to Clifton Savings Bank’s charter conversion to a federal savings bank.
15
Income Taxes.
2010 v. 2009. Income taxes increased due to an increase in pre-tax income coupled with a slight increase in the effective income tax rate. The overall effective tax rate for 2010 was 33.3%, compared to 31.5% for 2009.
2009 v. 2008. Income taxes increased due to an increase in pre-tax income coupled with an increase in the effective income tax rate, as non-taxable income represents a smaller portion of overall income in 2009. The overall effective tax rate for 2009 was 31.5%, compared to 21.2% for 2008.
Balance Sheet
Loans. Our primary lending activity is the origination of loans secured by real estate. We originate real estate loans secured by one- to four-family homes, and to a much lesser extent, multi-family and commercial real estate and construction loans. At March 31, 2010, real estate mortgage and construction loans totaled $466.5 million, or 97.2% of total loans compared to $453.7 million, or 96.6% at March 31, 2009, and $406.0 million, or 96.3% of total loans at March 31, 2008. Loans increased during the year ended March 31, 2010 due to continued competitive pricing and consistent loan origination volume, along with the purchase of $2.9 million in loans, all of which are secured by residential real estate properties located within the State of New Jersey.
The largest segment of our mortgage loan portfolio is one- to four-family loans. At March 31, 2010, one- to four-family loans totaled $441.0 million and represented 94.5% of total real estate loans and 91.9% of total loans. One- to four-family mortgage loans increased $10.0 million, or 2.3%, during the year ended March 31, 2010.
To a much lesser extent, we originate multi-family and commercial real estate loans, which portfolio was $24.6 million, and represented 5.1% of total loans as of March 31, 2010. Multi-family and commercial real estate loans increased $2.7 million, or 12.3%, during the year ended March 31, 2010.
We also originate consumer loans which include second mortgage loans, loans secured by passbook or certificate accounts and home equity lines of credit. Consumer loans totaled $13.4 million and represented 2.8% of total loans at March 31, 2010.
16
The following table sets forth the composition of our loan portfolio at the dates indicated.
|
At March 31,
|
||||||||||||||||||||||||
|
2010
|
2009
|
2008
|
||||||||||||||||||||||
|
Amount
|
Percent
|
Amount
|
Percent
|
Amount
|
Percent
|
|||||||||||||||||||
|
(Dollars in thousands)
|
||||||||||||||||||||||||
|
Real estate loans:
|
||||||||||||||||||||||||
|
One- to four-family
|
$ | 441,018 | 91.90 | % | $ | 431,055 | 91.82 | % | $ | 388,378 | 92.15 | % | ||||||||||||
|
Multi-family and commercial
|
24,575 | 5.12 | 21,886 | 4.66 | 15,993 | 3.79 | ||||||||||||||||||
|
Construction
|
863 | 0.18 | 750 | 0.16 | 1,630 | 0.39 | ||||||||||||||||||
|
Total real estate loans
|
466,456 | 97.20 | 453,691 | 96.64 | 406,001 | 96.33 | ||||||||||||||||||
|
Consumer loans:
|
||||||||||||||||||||||||
|
Second mortgage loans
|
10,454 | 2.18 | 13,055 | 2.78 | 13,458 | 3.19 | ||||||||||||||||||
|
Passbook or certificate loans
|
1,004 | 0.21 | 1,149 | 0.25 | 1,110 | 0.26 | ||||||||||||||||||
|
Equity lines of credit
|
1,684 | 0.35 | 1,259 | 0.27 | 617 | 0.15 | ||||||||||||||||||
|
Other consumer loans
|
300 | 0.06 | 295 | 0.06 | 295 | 0.07 | ||||||||||||||||||
|
Total consumer loans
|
13,442 | 2.80 | 15,758 | 3.36 | 15,480 | 3.67 | ||||||||||||||||||
|
Total gross loans
|
479,898 | 100.00 | % | 469,449 | 100.00 | % | 421,481 | 100.00 | % | |||||||||||||||
|
Loans in process
|
(537 | ) | (143 | ) | (349 | ) | ||||||||||||||||||
|
Net premiums and discounts and
deferred loan fees (costs)
|
205 | 894 | 927 | |||||||||||||||||||||
|
Allowance for loan losses
|
(2,050 | ) | (1,700 | ) | (1,440 | ) | ||||||||||||||||||
|
Total loans receivable, net
|
$ | 477,516 | $ | 468,500 | $ | 420,619 | ||||||||||||||||||
17
|
At March 31,
|
|||||||||
|
2007
|
2006
|
||||||||
|
Amount
|
Percent
|
Amount
|
Percent
|
||||||
|
(Dollars in thousands)
|
|||||||||
|
Real estate loans:
|
|||||||||
|
One- to four-family
|
$388,603
|
92.73%
|
$378,500
|
93.36%
|
|||||
|
Multi-family and commercial
|
13,890
|
3.31
|
12,877
|
3.17
|
|||||
|
Construction
|
1,994
|
0.48
|
3,769
|
0.93
|
|||||
|
Total real estate loans
|
404,487
|
96.52
|
395,146
|
97.46
|
|||||
|
Consumer loans:
|
|||||||||
|
Second mortgage loans
|
12,187
|
2.91
|
7,567
|
1.87
|
|||||
|
Passbook or certificate loans
|
1,251
|
0.30
|
996
|
0.25
|
|||||
|
Equity lines of credit
|
859
|
0.20
|
1,430
|
0.35
|
|||||
|
Other consumer loans
|
290
|
0.07
|
290
|
0.07
|
|||||
|
Total consumer loans
|
14,587
|
3.48
|
10,283
|
2.54
|
|||||
|
Total gross loans
|
419,074
|
100.00%
|
405,429
|
100.00%
|
|||||
|
Loans in process
|
(227)
|
(1,512)
|
|||||||
|
Net premiums and discounts and
deferred loan fees (costs)
|
1,119
|
1,025
|
|||||||
|
Allowance for loan losses
|
(1,350)
|
(1,260)
|
|||||||
|
Total loans receivable, net
|
$418,616
|
$403,682
|
|||||||
18
The following table sets forth certain information at March 31, 2010 regarding the dollar amount of principal repayments becoming due during the periods indicated for loans. The table does not include any estimate of prepayments which significantly shorten the average life of all loans and may cause our actual repayment experience to differ from that shown below. Demand loans having no stated schedule of repayments and no stated maturity are reported as due in one year or less.
|
One- to Four-
Family
Real Estate
|
Multi-Family
and Commercial
Real Estate
|
Construction
|
Consumer
Loans
|
Total
Loans
|
||||||||||||||||
|
(In thousands)
|
||||||||||||||||||||
|
Amounts due in:
|
||||||||||||||||||||
|
One year or less
|
$ | 61 | $ | — | $ | 863 | $ | 1,300 | $ | 2,224 | ||||||||||
|
More than one to three years
|
705 | — | — | 246 | 951 | |||||||||||||||
|
More than three to five years
|
2,019 | — | — | 636 | 2,655 | |||||||||||||||
|
More than five to ten years
|
61,826 | 632 | — | 3,323 | 65,781 | |||||||||||||||
|
More than ten to fifteen years
|
74,386 | 9,691 | — | 3,161 | 87,238 | |||||||||||||||
|
More than fifteen years
|
302,021 | 14,252 | — | 4,776 | 321,049 | |||||||||||||||
|
Total
|
$ | 441,018 | $ | 24,575 | $ | 863 | $ | 13,442 | $ | 479,898 | ||||||||||
The following table sets forth the dollar amount of all loans at March 31, 2010 that are due after March 31, 2011 and have either fixed interest rates or floating or adjustable interest rates. The amounts shown below exclude applicable loans in process and net premiums and discounts and deferred loan fees (costs), and includes $2.5 million of nonperforming loans.
|
Fixed-Rates
|
Floating or
Adjustable-Rates
|
Total
|
||||||||||
|
(In thousands)
|
||||||||||||
|
Real estate loans:
|
||||||||||||
|
One- to four-family
|
$ | 334,277 | $ | 106,680 | $ | 440,957 | ||||||
|
Multi-family and commercial
|
8,206 | 16,369 | 24,575 | |||||||||
|
Consumer loans
|
10,458 | 1,684 | 12,142 | |||||||||
|
Total
|
$ | 352,941 | $ | 124,733 | $ | 477,674 | ||||||
19
Securities. Our securities portfolio consists primarily of Federal agency debt securities with maturities of fifteen years or less and mortgage-backed securities with stated final maturities of thirty years or less. Securities increased $113.5 million, or 28.8%, in the year ended March 31, 2010 as the increase in deposits was mainly invested into these securities. All of our mortgage-backed securities were issued by either Ginnie Mae, Fannie Mae or Freddie Mac.
The following table sets forth the amortized cost and fair value of our securities portfolio at the dates indicated.
|
At March 31,
|
||||||||||||||||||||||||
|
2010
|
2009
|
2008
|
||||||||||||||||||||||
|
Amortized
Cost
|
Fair
Value
|
Amortized
Cost
|
Fair
Value
|
Amortized
Cost
|
Fair
Value
|
|||||||||||||||||||
|
(In thousands)
|
||||||||||||||||||||||||
|
Securities available-for-sale:
|
||||||||||||||||||||||||
|
Federal agency debt securities
|
$ | 15,000 | $ | 15,062 | $ | 10,000 | $ | 10,037 | $ | -- | $ | -- | ||||||||||||
|
Federal National Mortgage Association (1)
|
30,378 | 32,121 | 41,695 | 43,299 | 49,215 | 49,940 | ||||||||||||||||||
|
Federal Home Loan Mortgage Corporation (1)
|
23,561 | 24,960 | 33,357 | 34,823 | 39,667 | 40,279 | ||||||||||||||||||
|
|
68,939 | 72,143 | 85,052 | 88,159 | 88,882 | 90,219 | ||||||||||||||||||
|
Securities held-to-maturity:
|
||||||||||||||||||||||||
|
Federal agency debt securities
|
159,969 | 159,511 | 74,997 | 75,754 | 109,993 | 112,086 | ||||||||||||||||||
|
Federal National Mortgage Association (1)
|
104,023 | 107,229 | 59,317 | 61,774 | 35,201 | 35,872 | ||||||||||||||||||
|
Federal Home Loan Mortgage Corporation (1)
|
112,501 | 118,054 | 136,570 | 141,969 | 136,366 | 137,819 | ||||||||||||||||||
|
Governmental National Mortgage Association (1)
|
59,277 | 60,253 | 35,331 | 36,430 | 9,099 | 8,995 | ||||||||||||||||||
|
|
$ | 435,770 | 445,047 | 306,215 | 315,927 | 290,659 | 294,772 | |||||||||||||||||
|
Total
|
$ | 504,709 | $ | 517,190 | $ | 391,267 | $ | 404,086 | $ | 379,541 | $ | 384,991 | ||||||||||||
_________________________________
|
(1)
|
Mortgage-backed securities.
|
At March 31, 2010, we did not own any securities, other than U.S. Government and agency securities, that had an aggregate book value in excess of 10% of our total capital at that date.
20
The following table sets forth the contractual maturities and weighted average yields of securities at March 31, 2010. Certain mortgage-backed securities have interest rates that are adjustable and will reprice annually within the various maturity ranges. These annual repricings are not reflected in the table below. At March 31, 2010, the amortized cost of mortgage-backed securities with adjustable rates totaled $16.7 million. We had no tax-exempt securities at March 31, 2010.
|
Less Than
One Year
|
More than
One Year to
Five Years
|
More than
Five Years to
Ten Years
|
More than
Ten Years
|
Total
|
||||||||||||||||||||||||||||||||||||
|
Amortized
Cost
|
Weighted
Average
Yield
|
Amortized
Cost
|
Weighted
Average
Yield
|
Amortized
Cost
|
Weighted
Average
Yield
|
Amortized
Cost
|
Weighted
Average
Yield
|
Amortized
Cost
|
Weighted
Average
Yield
|
|||||||||||||||||||||||||||||||
|
Securities available
for sale:
|
||||||||||||||||||||||||||||||||||||||||
|
Federal agency
securities
|
$ | — | — | % | $ | 15,000 | 2.13 | % | $ | — | — | % | $ | — | — | % | $ | 15,000 | 2.13 | % | ||||||||||||||||||||
|
Fannie Mae (1)
|
— | — | — | — | 6,471 | 4.51 | 23,907 | 5.28 | 30,378 | 5.12 | ||||||||||||||||||||||||||||||
|
Freddie Mac (1)
|
— | — | — | — | 6,808 | 5.01 | 16,753 | 5.48 | 23,561 | 5.34 | ||||||||||||||||||||||||||||||
| — | — | 15,000 | 2.13 | 13,279 | 4.76 | 40,660 | 5.36 | 68,939 | 4.54 | |||||||||||||||||||||||||||||||
|
Securities held to
maturity:
|
||||||||||||||||||||||||||||||||||||||||
|
Federal agency
securities
|
— | — | 60,000 | 2.11 | 64,983 | 2.87 | 34,986 | 3.77 | 159,969 | 2.78 | ||||||||||||||||||||||||||||||
|
Fannie Mae (1)
|
— | — | 83 | 6.02 | 2,581 | 5.14 | 101,359 | 4.81 | 104,023 | 4.82 | ||||||||||||||||||||||||||||||
|
Freddie Mac (1)
|
23 | 7.00 | 66 | 6.63 | 15,040 | 4.65 | 97,372 | 5.15 | 112,501 | 5.09 | ||||||||||||||||||||||||||||||
|
Ginnie Mae (1)
|
5 | 6.25 | — | — | 114 | 4.38 | 59,158 | 4.63 | 59,277 | 4.63 | ||||||||||||||||||||||||||||||
| 28 | 6.88 | 60,149 | 2.12 | 82,718 | 3.27 | 292,875 | 4.76 | 435,770 | 4.11 | |||||||||||||||||||||||||||||||
|
Total
|
$ | 28 | 6.88 | % | $ | 75,149 | 2.12 | % | $ | 95,997 | 3.51 | % | $ | 333,535 | 4.84 | % | $ | 504,709 | 4.12 | % | ||||||||||||||||||||
|
(1)
|
Mortgage-backed securities.
|
Bank Owned Life Insurance. Bank owned life insurance increased approximately $887,000 in the year ended March 31, 2010 as a result of an increase in the cash surrender value which is recognized in non-interest income.
Premises and Equipment. Premises and equipment increased approximately $306,000 in the year ended March 31, 2010 primarily due to expenditures of $405,000 relating to a branch renovation coupled with $288,000 relating to the opening of a new branch office, partially offset by total depreciation for all premises and equipment of $482,000.
Other Assets. Other assets increased approximately $2.4 million in the year ended March 31, 2010 primarily due to an increase of $2.3 million in prepaid FDIC insurance.
Deposits. Our primary source of funds is our deposit accounts. The deposit base is comprised of non-interest-bearing demand, NOW accounts, which include high yield (Crystal) checking, passbook and statement savings, club, money market and time deposits. These deposits are provided primarily by individuals within our market area. We do not use brokered deposits as a source of funding. Deposits increased $124.6 million, or 19.7%, in the year ended March 31, 2010.
21
The following table indicates the amount of jumbo certificates of deposit by time remaining until maturity as of March 31, 2010. Jumbo certificates of deposit require minimum deposits of $100,000.
|
Maturity Period
|
Jumbo
Certificates
of Deposit
|
|||
|
(In thousands)
|
||||
|
Three months or less
|
$ | 29,699 | ||
|
Over three through six months
|
21,483 | |||
|
Over six through twelve months
|
67,064 | |||
|
Over twelve months
|
69,292 | |||
|
Total
|
$ | 187,538 | ||
Borrowings. To supplement deposits as a source for lending and investment activities, the Bank may borrow funds from the Federal Home Loan Bank of New York, Bank of America or PNC Capital Markets. Historically, the cash flows from deposit and other daily activities have been sufficient to meet day-to-day funding obligations, with only the occasional need to borrow on a short term basis from our established lines of credit with the Federal Home Loan Bank. However, as part of our leveraging strategy, which was originally implemented during the year ended March 31, 2005, we again began to borrow from the Federal Home Loan Bank in November 2007 through June 2008 to use those funds to simultaneously invest into higher yielding mortgage-backed securities. All the outstanding borrowings as of March 31, 2010 were made in connection with those previous leverage strategies.
The following table presents certain information regarding our Federal Home Loan Bank of New York advances during the periods and at the dates indicated. We had no other outstanding borrowings at March 31, 2010, 2009 and 2008.
|
Year Ended March 31,
|
||||||||||||
|
2010
|
2009
|
2008
|
||||||||||
|
(Dollars in thousands)
|
||||||||||||
|
Maximum amount of advances outstanding at any
month end during the period
|
$ | 143,588 | $ | 162,329 | $ | 142,306 | ||||||
|
Average advances outstanding during the period
|
$ | 137,965 | $ | 149,468 | $ | 64,527 | ||||||
|
Weighted average interest rate during the period
|
3.83 | % | 3.91 | % | 3.75 | % | ||||||
|
Balance outstanding at end of period
|
$ | 123,737 | $ | 144,272 | $ | 142,306 | ||||||
|
Weighted average interest rate at end of period
|
3.86 | % | 3.85 | % | 3.89 | % | ||||||
Equity. Total equity increased by $2.8 million, or 1.6%, to $176.0 at March 31, 2010 from $173.2 million at March 31, 2009. The increase in 2010 resulted primarily from net income of $6.3 million, employee stock ownership plan shares committed to be released of $730,000, and $741,000 for stock option and restricted stock awards earned under the Company’s 2005 Equity Incentive Plan and related tax benefits, partially offset by the repurchase of approximately 337,000 shares of Company common stock for $3.2 million, and cash dividends paid of $1.8 million. Our average equity to average assets ratio was 17.1% at March 31, 2010, compared to 18.5% at March 31, 2009.
Risk Management
Overview. Managing risk is an essential part of successfully managing a financial institution. Our most prominent risk exposures are credit risk, interest rate risk and market risk. Credit risk is the risk of not collecting the interest and/or the principal balance of a loan or investment when it is due. Interest rate risk is the potential reduction of interest income as a result of changes in interest rates. Market risk arises from fluctuations in interest rates that may result in changes in the values of financial instruments, such as available-for-sale securities that are accounted for on a mark-to-market basis. Other risks that we face are operational risks, liquidity risks and reputation risk. Operational risks include risks related to fraud, regulatory compliance, processing errors, technology and disaster recovery. Liquidity risk is the possible inability to fund obligations to depositors, lenders or borrowers. Reputation risk is the risk that negative publicity or press, whether true or not, could cause a decline in our customer base or revenue.
22
Credit Risk Management. Our strategy for credit risk management focuses on having well-defined credit policies and uniform underwriting criteria and providing prompt attention to potential problem loans. Our strategy also emphasizes the origination of one- to four-family mortgage loans, which typically have lower default rates than most other types of loans and are secured by collateral that generally tends to appreciate in value.
When a borrower fails to make a required loan payment, we take a number of steps to have the borrower cure the delinquency and restore the loan to current status. The following describes our general collection procedures. We mail a late charge notice when the loan becomes 15 days past due. We make initial contact with the borrower when the loan becomes 30 days past due. If payment is not then received by the 45th day of delinquency, additional letters and phone calls generally are made. After the 90th day of delinquency, we will send the borrower a final demand for payment and refer the loan to legal counsel to commence foreclosure proceedings. If a foreclosure action is instituted and the loan is not brought current, paid in full, or refinanced before the foreclosure sale, the real property securing the loan generally is sold at foreclosure. We may consider loan workout arrangements with certain borrowers under certain circumstances.
Analysis of Nonperforming and Classified Assets. When a loan becomes 90 days delinquent, or when other factors indicate that the collection of such amounts is doubtful, the loan is placed on nonaccrual status at which time an allowance for uncollected interest is recorded in the current period for previously accrued and uncollected interest. Interest on such loans, if appropriate, is recognized as income when payments are received. A loan is returned to accrual status when interest or principal payments are no longer ninety days or more in arrears on a contractual basis and factors indicating doubtful collectability no longer exist.
We consider repossessed assets and loans that are 90 days or more past due to be nonperforming assets. Real estate that we acquire as a result of foreclosure or by deed-in-lieu of foreclosure is classified as real estate owned until it is sold. When property is acquired it is recorded at the fair market value at the date of foreclosure. Holding costs and declines in fair value after acquisition of the property result in charges against income. At March 31, 2010 and 2009, we had no real estate owned.
Under current accounting guidelines, a loan is defined as impaired when, based on current information and events, it is probable that a creditor will be unable to collect all amounts due under the contractual terms of the loan agreement. We consider one- to four-family mortgage loans and consumer installment loans to be homogeneous and, therefore, do not separately evaluate them for impairment, unless they are considered troubled debt restructurings, as discussed below. All other loans are evaluated for impairment on an individual basis. At March 31, 2010 and 2009, we had $2.2 million and $432,000, respectively in loans that were considered impaired.
For economic reasons and to maximize the recovery of a loan, we work with borrowers experiencing financial difficulties, and will consider modifications to a borrower’s existing loan terms and conditions that we would not otherwise consider, commonly referred to as troubled debt restructurings. The Bank records an impairment loss, if any, based on the present value of expected future cash flows discounted at the original loan’s effective interest rate. The Bank will report the loan as a troubled debt restructuring until the borrower has performed for twelve consecutive months, in accordance with the terms of the restructuring.
The following table provides information with respect to our nonperforming assets at the dates indicated. At March 31, 2010, 2009 and 2008 we had impaired loans of $2.2 million, $432,000 and $-0-, respectively. There was one restructured loan with a balance of approximately $11,000 which was past due 90 days or more and in a nonaccrual status at March 31, 2010. Interest income recognized during the period of impairment on these loans totaled approximately $62,000, $1,000 and $-0-, respectively, for the years ended March 31, 2010, 2009 and 2008.
23
|
At March 31,
|
||||||||||||||||||||
|
2010
|
2009
|
2008
|
2007
|
2006
|
||||||||||||||||
|
(Dollars in thousands)
|
||||||||||||||||||||
|
Nonaccrual loans:
|
||||||||||||||||||||
|
Real estate
|
$ | 2,462 | $ | 870 | $ | 265 | $ | 258 | $ | 10 | ||||||||||
|
Total
|
2,462 | 870 | 265 | 258 | 10 | |||||||||||||||
|
Accruing loans past due 90 days or more:
|
||||||||||||||||||||
|
Consumer
|
-- | -- | -- | -- | -- | |||||||||||||||
|
Total
|
-- | -- | -- | -- | -- | |||||||||||||||
|
Total of nonaccrual and 90 days or more past due loans
|
$ | 2,462 | 870 | 265 | 258 | 10 | ||||||||||||||
|
Real estate owned
|
-- | -- | -- | -- | -- | |||||||||||||||
|
Total nonperforming assets
|
$ | 2,462 | $ | 870 | $ | 265 | $ | 258 | $ | 10 | ||||||||||
|
Total nonperforming loans to total gross loans
|
0.51 | % | 0.19 | % | 0.06 | % | 0.06 | % | 0.00 | % | ||||||||||
|
Total nonperforming loans to total assets
|
0.23 | % | 0.09 | % | 0.03 | % | 0.03 | % | 0.00 | % | ||||||||||
|
Total nonperforming assets to total assets
|
0.23 | % | 0.09 | % | 0.03 | % | 0.03 | % | 0.00 | % | ||||||||||
Non-performing loans increased from $870,000 at March 31, 2009 to $2.5 million at March 31, 2010. At March 31, 2010, non-performing loans consisted of eleven loans secured by one- to four-family residential real estate, one loan secured by commercial real estate, and one loan secured by a multi-family dwelling, while at March 31, 2009, non-performing loans consisted of seven one- to four-family residential real estate loans. During the year ended March 31, 2010 there was an $83,000 charge-off which represented a partial loss from the restructuring of one residential real estate loan. This was the first loan charge-off recorded by the Bank in more than ten years. The percentage of non-performing loans to total gross loans has been consistently low, even though it rose from 0.19% at March 31, 2009 to 0.51% at March 31, 2010. The gross loan portfolio increased $10.5 million, or 2.2%, to $479.9 million at March 31, 2010 from $469.4 million at March 31, 2009. Nonaccrual loans are in various stages of collection, workout or foreclosure and are mainly secured by New Jersey properties whose values at March 31, 2010 are estimated to equal or exceed outstanding balances due on these loans at that date. Five one-to-four family real estate loans were purchased from other institutions and continue to be serviced by others. Of the increase in nonaccrual loans five loans were reported as nonaccrual at March 31, 2009 that either reinstated or paid off during the current year.
Interest income that would have been recorded for the years ended March 31, 2010, 2009 and 2008, had nonaccruing loans been current and accruing interest according to their original terms amounted to $148,000, $56,000 and $15,000, respectively. The amount of interest related to these loans included in interest income was $58,000, $40,000 and $12,000, respectively, for the years ended March 31, 2010, 2009 and 2008.
Pursuant to federal regulations, we review and classify our assets on a regular basis. In addition, the Office of Thrift Supervision has the authority to identify problem assets and, if appropriate, require them to be classified. There are three classifications for problem assets: substandard, doubtful and loss. “Substandard assets” must have one or more defined weaknesses and are characterized by the distinct possibility that we will sustain some loss if the deficiencies are not corrected. “Doubtful assets” have the weaknesses of substandard assets with the additional characteristic that the weaknesses make collection or liquidation in full on the basis of currently existing facts, conditions and values questionable, and there is a high possibility of loss. An asset classified “loss” is considered uncollectible and of such little value that continuance as an asset of the institution is not warranted. The regulations also provide for a “special mention” category, described as assets which do not currently expose us to a sufficient degree of risk to warrant classification but do possess credit deficiencies or potential weaknesses deserving our close attention. When we classify an asset as substandard, doubtful, or as a loss, we establish specific allowances, if necessary, for loan losses in the amount of the portion of the asset classified loss or charge off such amount.
24
The following table shows the aggregate amounts of our classified assets at the dates indicated.
|
At March 31,
|
||||||||
|
2010
|
2009
|
|||||||
|
(In thousands)
|
||||||||
|
Special mention assets
|
$ | 1,652 | $ | 4,747 | ||||
|
Substandard assets
|
2,283 | 668 | ||||||
|
Doubtful assets
|
225 | 225 | ||||||
|
Loss assets
|
-- | -- | ||||||
|
Total classified assets
|
$ | 4,160 | $ | 5,640 | ||||
At each of the dates in the above table, substandard and doubtful assets consisted of all nonperforming assets and included negative escrow amounts. At March 31, 2010, we had one current loan totaling $23,000 included in the $1.7 million in special mention assets. Total classified assets decreased approximately $1.5 million, or 26.2% from March 31, 2009 to 2010.
Delinquencies. The following table provides information about delinquencies in our loan portfolio at the dates indicated.
|
At March 31,
|
||||||||||||||||||||||||
|
2010
|
2009
|
|||||||||||||||||||||||
|
30-59 Days Past Due
|
60-89 Days Past Due
|
90 Days or Greater Past Due
|
30-59 Days Past Due
|
60-89 Days Past Due
|
90 Days or Greater Past Due
|
|||||||||||||||||||
|
Real estate loans
|
$ | 1,413 | $ | 165 | $ | 2,427 | $ | 1,732 | $ | 1,030 | $ | 858 | ||||||||||||
|
Consumer loans
|
373 | 45 | 35 | 120 | 49 | 12 | ||||||||||||||||||
|
Total
|
$ | 1,786 | $ | 210 | $ | 2,462 | $ | 1,852 | $ | 1,079 | $ | 870 | ||||||||||||
At March 31, 2010 and 2009, delinquent real estate loans in the above table included $331,000 and $664,000, and $0 and $0, respectively, in multifamily and commercial real estate loans. All other loans were secured by residential real estate. There were two loans delinquent 60 to 89 days at March 31, 2010 as compared to seven loans at March 31, 2009. There were thirteen loans delinquent 90 days or greater at March 31, 2010 as compared to seven loans at March 31, 2009. There were four loans in the process of foreclosure with a total balance of $1.0 million at March 31, 2010 as compared to one loan with a balance of $34,000 at March 31, 2009.
Allowance for Loan Losses. The allowance for loan losses is a valuation allowance for probable losses inherent in the loan portfolio. We evaluate the need to establish allowances against losses on loans on a monthly basis. When additional allowances are necessary, a provision for loan losses is charged to earnings.
Clifton Savings’ methodology for assessing the appropriateness of the allowance for loan losses consists of two key elements: specific allowances for identified problem loans and a general valuation allowance on the remainder of the loan portfolio.
Specific allowances are established in cases where management has identified significant conditions or circumstances related to a credit that management believes indicate the probability that a loss has been incurred. Clifton Savings identifies loans which may require a specific allowance by reviewing all delinquent loans, significant credits, problem loans as identified by Clifton Savings’ internal grading system; loans classified as substandard, doubtful, loss, or special mention by Clifton Savings’ internal classification system, and other loans which management may have concerns about collectability, such as loans in a particular industry. For individually reviewed loans, a borrower’s inability to service a credit according to the contractual terms based on the borrower’s cash flow and/or a shortfall in collateral value would result in the recording of a specific allowance. Clifton Savings did not have any specific allowances at March 31, 2010, 2009 and 2008.
25
The general valuation allowance represents a loss allowance which has been established to recognize the inherent losses associated with lending activities, but which, unlike specific allowances, has not been allocated to particular problem assets. Risk factors are based on our historical loss experience and may be adjusted for significant current factors that, in management’s judgment, affect the collectability of the portfolio as of the evaluation date. These significant factors may include changes in lending policies and procedures, changes in existing general economic and business conditions affecting our primary lending areas, credit quality trends, collateral value, loan volumes and concentrations, seasoning of the loan portfolio, specific industry conditions within portfolio segments, recent loss experience in particular segments of the portfolio, duration of the current business cycle and bank regulatory examination results.
The Office of Thrift Supervision, as an integral part of its examination process, periodically reviews our allowance for loan losses. The Office of Thrift Supervision may require us to make additional provisions for loan losses based on judgments different from ours.
Although we believe that we use the best information available to establish the allowance for loan losses, future adjustments to the allowance for loan losses may be necessary and results of operations could be adversely affected if circumstances differ substantially from the assumptions used in making the determinations. Furthermore, while we believe we have established our allowance for loan losses in conformity with accounting principles generally accepted in the United States, there can be no assurance that regulators, in reviewing our loan portfolio, will not request us to increase our allowance for loan losses. In addition, because future events affecting borrowers and collateral cannot be predicted with certainty, there can be no assurance that the existing allowance for loan losses is adequate or that increases will not be necessary should the quality of any loans deteriorate as a result of the factors discussed above. Any material increase in the allowance for loan losses may adversely affect our financial condition and results of operations.
Summary of Loan Loss Experience. The following table sets forth an analysis of the allowance for loan losses for the periods indicated. Where specific loan loss allowances have been established, any difference between the loss allowance and the amount of loss realized has been charged or credited to current income.
|
Year Ended March 31,
|
||||||||||||||||||||
|
2010
|
2009
|
2008
|
2007
|
2006
|
||||||||||||||||
|
(Dollars in thousands)
|
||||||||||||||||||||
|
Allowance at beginning of period
|
$ | 1,700 | $ | 1,440 | $ | 1,350 | $ | 1,260 | $ | 1,100 | ||||||||||
|
Provision for loan losses
|
433 | 260 | 90 | 90 | 160 | |||||||||||||||
|
Recoveries
|
-- | -- | -- | -- | -- | |||||||||||||||
|
Charge-offs - residential mortgages
|
83 | -- | -- | -- | -- | |||||||||||||||
|
Net charge-offs
|
83 | -- | -- | -- | -- | |||||||||||||||
|
Allowance at end of period
|
$ | 2,050 | $ | 1,700 | $ | 1,440 | $ | 1,350 | $ | 1,260 | ||||||||||
|
Allowance to nonperforming loans
|
83.27 | % | 195.40 | % | 543.40 | % | 523.26 | % | 12600.00 | % | ||||||||||
|
Allowance to total gross loans
outstanding at the end of the period
|
0.43 | % | 0.36 | % | 0.34 | % | 0.32 | % | 0.31 | % | ||||||||||
|
Net charge-offs to average outstanding
loans during the period
|
0.02 | % | 0.00 | % | 0.00 | % | 0.00 | % | 0.00 | % | ||||||||||
26
The following table sets forth the breakdown of the allowance for loan losses by loan category at the dates indicated.
| At March 31, | ||||||||||||||||||||||||||||||||||||
| 2010 | 2009 | 2008 | ||||||||||||||||||||||||||||||||||
|
Amount
|
% of
Allowance
to Total
Allowance
|
% of
Loans in
Category
to Total
Loans
|
Amount
|
% of
Allowance to Total
Allowance
|
% of
Loans in
Category
to Total
Loans
|
Amount
|
% of
Allowance
to Total
Allowance
|
% of
Loans in
Category
to Total
Loans
|
||||||||||||||||||||||||||||
|
One- to four-family
|
$ | 1,746 | 85.17 | % | 91.90 | % | $ | 1,525 | 89.71 | % | 91.82 | % | $ | 1,295 | 89.93 | % | 92.15 | % | ||||||||||||||||||
|
Multi-family and commercial
real estate
|
236 | 11.51 | 5.12 | 110 | 6.47 | 4.66 | 80 | 5.55 | 3.79 | |||||||||||||||||||||||||||
|
Construction
|
1 | 0.05 | 0.18 | 1 | 0.06 | 0.16 | 61 | 4.24 | 0.39 | |||||||||||||||||||||||||||
|
Consumer
|
67 | 3.27 | 2.80 | 64 | 3.76 | 3.36 | 4 | 0.28 | 3.67 | |||||||||||||||||||||||||||
|
Unallocated
|
-- | -- | -- | -- | -- | -- | -- | -- | -- | |||||||||||||||||||||||||||
|
Total allowance for loan
Losses
|
$ | 2,050 | 100.00 | % | 100.00 | % | $ | 1,700 | 100.00 | % | 100.00 | % | $ | 1,440 | 100.00 | % | 100.00 | % | ||||||||||||||||||
|
At March 31,
|
||||||||||||||||||||||||
|
2007
|
2006
|
|||||||||||||||||||||||
|
Amount
|
% of
Allowance
to Total
Allowance
|
% of
Loans in
Category
to Total
Loans
|
Amount
|
% of
Allowance
to Total
Allowance
|
% of
Loans in
Category
to Total
Loans
|
|||||||||||||||||||
|
(Dollars in thousands)
|
||||||||||||||||||||||||
|
One- to four-family
|
$ | 1,185 | 87.78 | % | 92.73 | % | $ | 1,152 | 91.43 | % | 93.36 | % | ||||||||||||
|
Multi-family and commercial real estate
|
103 | 7.63 | 3.31 | 61 | 4.84 | 3.17 | ||||||||||||||||||
|
Construction
|
5 | 0.37 | 0.48 | 7 | 0.56 | 0.93 | ||||||||||||||||||
|
Consumer
|
57 | 4.22 | 3.48 | 40 | 3.17 | 2.54 | ||||||||||||||||||
|
Unallocated
|
-- | -- | -- | -- | -- | -- | ||||||||||||||||||
|
Total allowance for loan losses
|
$ | 1,305 | 100.00 | % | 100.00 | % | $ | 1,260 | 100.00 | % | 100.00 | % | ||||||||||||
Interest Rate Risk Management. We manage the interest rate sensitivity of our interest-bearing liabilities and interest-earning assets in an effort to minimize the adverse effects of changes in the interest rate environment. Deposit accounts typically react more quickly to changes in market interest rates than mortgage loans because of the shorter maturities of deposits. As a result, sharp increases in interest rates may adversely affect our earnings while decreases in interest rates may beneficially affect our earnings. To reduce the potential volatility of our earnings, we have sought to improve the match between asset and liability maturities and rates, while maintaining an acceptable interest rate spread. Pursuant to this strategy, we originate adjustable-rate mortgage loans for retention in our loan portfolio. The ability to originate adjustable-rate loans depends to a great extent on market interest rates and borrowers’ preferences. As an alternative to adjustable-rate mortgage loans, we offer fixed-rate mortgage loans with maturities of fifteen years or less. This product enables us to compete in the fixed-rate mortgage market while maintaining a shorter maturity. Fixed-rate mortgage loans typically have an adverse effect on interest rate sensitivity compared to adjustable-rate loans. In recent years we have used investment securities with terms of three years or less and adjustable-rate mortgage-backed securities to help manage interest rate risk. We currently do not participate in hedging programs such as interest rate swaps or other activities involving the use of derivative financial instruments.
We have a Risk Management Committee to communicate, coordinate and control all aspects involving asset/liability management. The committee establishes and monitors the volume and mix of assets and funding sources with the objective of managing assets and funding sources.
27
Net Portfolio Value Analysis. We use a combination of internal and external analyses to quantitively model, measure and monitor our Bank’s expose to interest rate risk. The external interest rate sensitivity analysis is prepared by the Office of Thrift Supervision to review our level of interest rate risk. This analysis measures interest rate risk by computing changes in net portfolio value (“NPV”) of our cash flows from assets, liabilities and off-balance sheet items in the event of a range of assumed changes in market interest rates. Net portfolio value represents the market value of portfolio equity and is equal to the market value of assets minus the market value of liabilities, with adjustments made for off-balance sheet items. This analysis assesses the risk of loss in market risk sensitive instruments in the event of a sudden and sustained 50 to 300 basis point increase or 50 to 100 basis point decreases in market interest rates with no effect given to any steps that we might take to counter the effect of that interest rate movement. Because of the low level of market interest rates, this analysis is not performed for decreases of more than 100 basis points. We measure interest rate risk by modeling the changes in net portfolio value over a variety of interest rate scenarios. The following table, which is based on information that we provide to the Office of Thrift Supervision, presents the change in our net portfolio value at March 31, 2010 that would occur in the event of an immediate change in interest rates based on Office of Thrift Supervision assumptions, with no effect given to any steps that we might take to counteract that change.
|
Basis Point (“bp”)
Change in Rates (1)
|
Net Portfolio Value
|
Net Portfolio Value as %
of
Present Value of Assets
|
||||||||
|
$ Amount
|
$ Change
|
% Change
|
NPV Ratio
|
Change
|
||||||
|
(Dollars in thousands)
|
||||||||||
|
300 bp
|
$ 83,758
|
$ (90,516)
|
(52)%
|
8.50%
|
(731) bp
|
|||||
|
200
|
116,121
|
(58,153)
|
(33)
|
11.32
|
(449)
|
|||||
|
100
|
148,462
|
(25,813)
|
(15)
|
13.91
|
(190)
|
|||||
|
50
|
161,037
|
(13,238)
|
(8)
|
14.85
|
(96)
|
|||||
|
0
|
174,275
|
—
|
—
|
15.81
|
—
|
|||||
|
(50)
|
181,785
|
7,511
|
4
|
16.31
|
50
|
|||||
|
(100)
|
187,321
|
13,047
|
7
|
16.66
|
85
|
|||||
(1) The -200 bp and -300 bp scenarios are not shown due to the low prevailing interest rate environment.
The Office of Thrift Supervision uses certain assumptions in assessing the interest rate risk of savings associations. These assumptions relate to interest rates, loan prepayment rates, deposit decay rates, and the market values of certain assets under differing interest rate scenarios, among others. As with any method of measuring interest rate risk, certain shortcomings are inherent in the method of analysis presented in the foregoing table. For example, although certain assets and liabilities may have similar maturities or periods to repricing, they may react in different degrees to changes in market interest rates. Also, the interest rates on certain types of assets and liabilities may fluctuate in advance of changes in market interest rates, while interest rates on other types may lag behind changes in market rates. Additionally, certain assets, such as adjustable-rate mortgage loans, have features that restrict changes in interest rates on a short-term basis and over the life of the asset. Further, in the event of a change in interest rates, expected rates of prepayments on loans and early withdrawals from certificates could deviate significantly from those assumed in calculating the table.
The internal quantitative analysis utilized by management measures interest rate risk from both a capital and earnings perspective. Like the Office of Thrift Supervision model, the Bank’s internal interest rate risk analysis calculates sensitivity of the Bank’s NPV ratio to movements in interest rates. Both the Office of Thrift Supervision and internal models measure the Bank’s NPV ratio in a “base case” scenario that assumes no change in interest rates as of the measurement date. Both models measure the change in the NPV ratio throughout a series of interest rate scenarios representing immediate and permanent, parallel shifts in the yield curve up 100, 200 and 300 basis points and down 100 basis points. Both models generally require that interest rates remain positive for all points along the yield curve for each rate scenario which may preclude the modeling of certain “down rate” scenarios during periods of lower market interest rates. The Bank’s interest rate risk policy as approved by the Board of Directors, establishes acceptable change levels in the NPV ratio throughout the scenarios modeled. The differences in results between the two models is primarily due to the assumptions used for loan prepayment rates and deposit decay rates.
28
The following table presents the results of the Bank’s internal NPV analysis as of March 31, 2010:
|
March 31, 2010
|
|||||||||||||
|
Net Portfolio Value as % of
|
|||||||||||||
|
bp
|
Net Portfolio Value
|
Present Value of Assets
|
|||||||||||
|
Change in Rates (1)
|
$ Amount
|
$ Change
|
% Change
|
NPV Ratio
|
Change
|
||||||||
|
(Dollars in Thousands)
|
|||||||||||||
|
300 bp
|
$ 82,493
|
$ (86,775)
|
(51)
|
%
|
8.65
|
%
|
(705)
|
bp
|
|||||
|
200
|
115,223
|
(54,045)
|
(32)
|
11.55
|
(415)
|
||||||||
|
100
|
145,532
|
(23,736)
|
(14)
|
13.99
|
(171)
|
||||||||
|
0
|
169,268
|
-
|
-
|
15.70
|
-
|
||||||||
|
-100
|
179,241
|
9,972
|
6
|
16.27
|
57
|
||||||||
|
(1) The -200 bp and -300 bp scenarios are not shown due to the low prevailing interest rate environment.
|
|||||||||||||
The table above illustrates that the Bank’s NPV would be negatively impacted by an increase in interest rates. Because the Bank’s interest-bearing liabilities which mature or reprice within short periods exceed its interest-earning assets with similar characteristics, material and prolonged increases in interest rates generally would adversely affect net interest income, while material and prolonged decreases in interest rates generally would have a positive effect on net interest income.
Certain shortcomings are inherent in the methodology used in the above interest rate risk measurements. Modeling changes in NPV require the making of certain assumptions which may or may not reflect the manner in which actual yields and costs respond to changes in market interest rates. In this regard, the NPV model presented assumes that the composition of the Bank’s interest sensitive assets and liabilities existing at the beginning of a period remains constant over the period being measured and also assumes that a particular change in interest rates is reflected uniformly across the yield curve regardless of the duration to maturity or repricing of specific assets and liabilities. Accordingly, although the NPV measurements and net interest income models provide an indication of the Bank’s interest rate risk exposure at a particular point in time, such measurements are not intended to and do not provide a precise forecast of the effect of changes in market interest rates on the Bank’s net interest income and will differ from actual results.
Liquidity Management. Liquidity is the ability to meet current and future financial obligations of a short-term nature. Our primary sources of funds consist of deposit inflows, loan and mortgage-backed securities amortization and repayments and maturities and calls of investment securities. While maturities and scheduled amortization of loans and securities are predictable sources of funds, deposit flows, mortgage and mortgage-backed securities prepayments and investment securities calls are greatly influenced by general interest rates, economic conditions and competition.
We regularly adjust our investments in liquid assets based upon our assessment of (1) expected loan demand, (2) expected deposit flows, (3) yields available on interest-earning deposits and securities, (4) repayment of borrowings and (5) the objectives of our asset/liability management program. Excess liquid assets are invested generally in short to intermediate-term U.S. Government agency obligations.
Our most liquid assets are cash and cash equivalents and interest-bearing deposits in other banks. The levels of these assets are dependent on our operating, financing, lending and investing activities during any given period. At March 31, 2010, cash and cash equivalents totaled $33.5 million, including interest-bearing deposits of $11.8 million. Securities classified as available-for-sale, which provide additional sources of liquidity, totaled $72.1 million at March 31, 2010. On March 31, 2010, we had $123.7 million in Federal Home Loan Bank advances outstanding. In addition, if the Bank requires funds beyond its ability to generate them internally, the Bank can borrow funds up to approximately $94.9 million under an overnight line of credit, and $94.9 million under a one-month overnight repricing line of credit agreement with the Federal Home Loan Bank of New York. The Bank’s membership in the Federal Home Loan Bank of New York also provides access to additional sources of borrowed funds based on the Bank’s ability to collateralize such borrowings. Additionally, the Company has the ability to borrow funds at Bank of America and PNC Capital Markets under established unsecured overnight lines of credit.
29
At March 31, 2010, we had $3.7 million in loan origination commitments outstanding, and $1.6 million in commitments to purchase participations in loans. In addition to commitments to originate and purchase loans and participations, we had $3.9 million in customer approved unused equity lines of credit, and a $5.0 million commitment to purchase a U.S. Government agency security. Certificates of deposit due within one year of March 31, 2010 totaled $396.2 million, or 52.3% of total deposits. If these deposits do not remain with us, we will be required to seek other sources of funds, including other certificates of deposit and lines of credit. Depending on market conditions, we may be required to pay higher rates on such deposits or other borrowings than we currently pay on the certificates of deposit due on or before March 31, 2011. We believe, however, based on past experience, that a significant portion of our certificates of deposit will remain with us and we have the ability to attract and retain deposits by adjusting the interest rates offered.
We have historically remained highly liquid and our liquidity position has remained stable over the past two fiscal years. We have no material commitments or demands that are likely to affect our liquidity other than set forth herein. Consequently, the Board of Directors intends to make additional investments in long-term loans and mortgage-backed securities which will decrease liquidity and increase interest income. In the event loan demand were to increase at a pace greater than expected, or any unforeseen demands or commitments were to occur, we could access our line of credits with the Federal Home Loan Bank of New York, Bank of America or PNC Capital Markets.
Clifton Savings Bancorp is a separate legal entity from Clifton Savings and must provide for its own liquidity. In addition to its operating expenses, Clifton Savings Bancorp, on a stand-alone basis, is responsible for paying any dividends declared to its shareholders. Clifton Savings Bancorp also has repurchased shares of its common stock. Clifton Savings Bancorp’s primary source of income is dividends received from Clifton Savings. The amount of dividends that Clifton Savings may declare and pay to Clifton Savings Bancorp in any calendar year, without the receipt of prior approval from the Office of Thrift Supervision but with prior notice to the Office of Thrift Supervision, cannot exceed net income for that year to date plus retained net income (as defined) for the preceding two calendar years. On a stand-alone basis, Clifton Savings Bancorp had liquid assets of $8.8 million at March 31, 2010.
The following table presents certain of our contractual obligations as of March 31, 2010.
|
Payments due by period
|
||||||||||||||||||||
|
Contractual Obligations
|
Total
|
Less than
1 year
|
1-3 years
|
3-5 years
|
More than 5 years
|
|||||||||||||||
|
(In thousands)
|
||||||||||||||||||||
|
Operating lease obligations (1)
|
$ | 2,063 | $ | 332 | $ | 675 | $ | 526 | $ | 530 | ||||||||||
|
Certificates of deposit
|
595,841 | 373,489 | 208,309 | 14,043 | — | |||||||||||||||
|
FHLB advances
|
123,737 | 28,070 | 38,459 | 14,708 | 42,500 | |||||||||||||||
|
Total
|
$ | 721,641 | $ | 401,891 | $ | 247,443 | $ | 29,277 | $ | 43,030 | ||||||||||
__________________________
|
(1)
|
Payments are for lease of real property.
|
Our primary investing activities are the origination of loans and the purchase of securities. In fiscal 2010, we originated $103.5 million of loans, purchased $2.9 million of loans, and purchased $276.8 million of securities. In fiscal 2009, we originated $106.7 million of loans, purchased $4.6 million of loans, and purchased $127.5 million of securities.
Financing activities consist primarily of activity in deposit accounts and in Federal Home Loan Bank advances. We experienced a net increase in total deposits of $124.6 million for the year ended March 31, 2010, a net increase in total deposits of $56.9 million for the year ended March 31, 2009 and a net increase in total deposits of $9.2 million for the year ended March 31, 2008. Deposit flows are affected by the overall level of interest rates, the interest rates and products offered by us and our local competitors and other factors. We generally manage the pricing of our deposits to be highly competitive and to increase core deposit relationships. Occasionally, we introduce new products or offer promotional rates on certain deposit products in order to attract deposits. Federal Home Loan Bank advances decreased $20.6 million for the year ended March 31, 2010 as a result of the repayment of long-term borrowings in accordance with their original terms. We had $123.7 million and $144.3 million in advances outstanding at March 31, 2010 and 2009, respectively, and $142.3 million in advances outstanding at March 31, 2008.
30
Capital Management
We are subject to various regulatory capital requirements administered by the Office of Thrift Supervision, including a risk-based capital measure. The risk-based capital guidelines include both a definition of capital and a framework for calculating risk-weighted assets by assigning balance sheet assets and off-balance sheet items to broad risk categories. Under these requirements the federal bank regulatory agencies have established quantitative measures to ensure that minimum thresholds for Tier 1 Capital, Total Capital and Leverage (Tier 1 Capital divided by average assets) ratios are maintained. Failure to meet minimum capital requirements can trigger certain mandatory and possibly additional discretionary, actions by regulators that could have a direct material effect on our operations and financial position. Under the capital adequacy guidelines and the regulatory framework for prompt corrective action, Clifton Savings must meet specific capital guidelines that involve quantitative measures of assets and certain off-balance sheet items as calculated under regulatory accounting practices. It is our intention to maintain “well-capitalized” risk-based capital levels. Clifton Savings Bank’s capital amounts and classifications are also subject to qualitative judgments by the federal bank regulators about components, risk weightings, and other factors. At March 31, 2010, we exceeded all of our regulatory capital requirements. As of July 9, 2009, the most recent notification from the Office of Thrift Supervision, we are considered “well capitalized” under regulatory guidelines.
Off-Balance Sheet Arrangements
In the normal course of operations, we engage in a variety of financial transactions that, in accordance with accounting principles generally accepted in the United States of America, are not recorded in our consolidated financial statements. These transactions involve, to varying degrees, elements of credit, interest rate, and liquidity risk. Such transactions are used primarily to manage customers’ requests for funding and take the form of loan commitments and lines of credit. See note 16 of the notes to the consolidated financial statements included in this annual report.
For the years ended March 31, 2010 and 2009, we engaged in no off-balance sheet transactions reasonably likely to have a material effect on our consolidated financial position, results of operations, or cash flows.
Recent Accounting Pronouncements
For a discussion of the impact of recent accounting pronouncements, see note 1 of the notes to the consolidated financial statements included in this annual report.
Effect of Inflation and Changing Prices
The consolidated financial statements and related consolidated financial data presented in this report have been prepared in accordance with accounting principles generally accepted in the United States of America, which require the measurement of financial position and operating results in terms of historical dollars without considering changes in the relative purchasing power of money over time due to inflation. The primary impact of inflation on our operations is reflected in increased operating costs. Unlike most industrial companies, virtually all the assets and liabilities of a financial institution are monetary in nature. As a result, interest rates generally have a more significant impact on a financial institution’s performance than do general levels of inflation. Interest rates do not necessarily move in the same direction or to the same extent as the prices of goods and services because such prices are affected by inflation to a larger extent than interest rates.
31
Management Report on Internal Control Over Financial Reporting
The management of Clifton Savings Bancorp, Inc. and Subsidiaries (collectively the “Company”) is responsible for establishing and maintaining adequate internal control over financial reporting. The Company’s internal control system is a process designed to provide reasonable assurance to the management and Board of Directors regarding the preparation and fair presentation of published consolidated financial statements.
The Company’s internal control over financial reporting includes policies and procedures that pertain to the maintenance of records that, in reasonable detail, accurately and fairly reflect transactions and dispositions of assets; provide reasonable assurances that transactions are recorded as necessary to permit preparation of consolidated financial statements in accordance with U.S. generally accepted accounting principles, and that receipts and expenditures are being made only in accordance with authorizations of management and the Directors of the Company; and provide reasonable assurance regarding prevention or timely detection of unauthorized acquisition, use or disposition of the Company’s assets that could have a material effect on our consolidated financial statements.
All internal control systems, no matter how well designed, have inherent limitations. Therefore, even those systems determined to be effective can provide only reasonable assurance with respect to consolidated financial statement preparation and presentation. Also, projections of any evaluation of effectiveness to future periods are subject to the risk that controls may become inadequate because of changes in conditions, or that the degree of compliance with the policies or procedures may deteriorate.
The Company’s management assessed the effectiveness of internal control over financial reporting as of March 31, 2010. In making this assessment, management used the criteria set forth by the Committee of Sponsoring Organizations of the Treadway Commission in Internal Control-Integrated Framework. Based on its assessment, management believes that, as of March 31, 2010, the Company’s internal control over financial reporting is effective based on those criteria.
The Company’s independent registered public accounting firm that audited the consolidated financial statements has issued an audit report on the effective operation of the Company’s internal control over financial reporting as of March 31, 2010, a copy of which is included in this annual report.
32
To the Board of Directors and Stockholders of
Clifton Savings Bancorp, Inc. and Subsidiaries
Clifton, New Jersey
We have audited Clifton Savings Bancorp, Inc. and Subsidiaries’ (collectively the “Company”) internal control over financial reporting as of March 31, 2010, based on criteria established in Internal Control - Integrated Framework issued by the Committee of Sponsoring Organizations of the Treadway Commission (COSO). The Company’s management is responsible for maintaining effective internal control over financial reporting and for its assessment of the effectiveness of internal control over financial reporting included in the accompanying Management Report on Internal Control Over Financial Reporting. Our responsibility is to express an opinion on the Company's internal control over financial reporting based on our audit.
We conducted our audit in accordance with the standards of the Public Company Accounting Oversight Board (United States). Those standards require that we plan and perform the audit to obtain reasonable assurance about whether effective internal control over financial reporting was maintained in all material respects. Our audit of internal control over financial reporting included obtaining an understanding of internal control over financial reporting, assessing the risk that a material weakness exists, and testing and evaluating the design and operating effectiveness of internal control based on the assessed risk. Our audit also included performing such other procedures as we considered necessary in the circumstances. We believe that our audit provides a reasonable basis for our opinion.
A company's internal control over financial reporting is a process designed to provide reasonable assurance regarding the reliability of financial reporting and the preparation of financial statements for external purposes in accordance with generally accepted accounting principles. A company's internal control over financial reporting includes those policies and procedures that (1) pertain to the maintenance of records that, in reasonable detail, accurately and fairly reflect the transactions and dispositions of the assets of the company; (2) provide reasonable assurance that transactions are recorded as necessary to permit preparation of financial statements in accordance with generally accepted accounting principles, and that receipts and expenditures of the company are being made only in accordance with authorizations of management and directors of the company; and (3) provide reasonable assurance regarding prevention or timely detection of unauthorized acquisition, use, or disposition of the company's assets that could have a material effect on the financial statements.
Because of its inherent limitations, internal control over financial reporting may not prevent or detect misstatements. Also, projections of any evaluation of effectiveness to future periods are subject to the risk that controls may become inadequate because of changes in conditions, or that the degree of compliance with the policies or procedures may deteriorate.
In our opinion, Clifton Savings Bancorp, Inc. and Subsidiaries maintained, in all material respects, effective internal control over financial reporting as of March 31, 2010, based on criteria established in Internal Control-Integrated Framework issued by the Committee of Sponsoring Organizations of the Treadway Commission (COSO).
We also have audited, in accordance with the standards of the Public Company Accounting Oversight Board (United States), the consolidated statements of financial condition and the related consolidated statements of income, changes in stockholders' equity, and cash flows of Clifton Savings Bancorp, Inc. and Subsidiaries, and our report dated June 9, 2010 expressed an unqualified opinion.
/s/ ParenteBeard LLC
Clark, New Jersey
June 9, 2010
33
Report of Independent Registered Public Accounting Firm
To the Board of Directors and Stockholders of
Clifton Savings Bancorp, Inc. and Subsidiaries
Clifton, New Jersey
We have audited the accompanying consolidated statements of financial condition of Clifton Savings Bancorp, Inc. and Subsidiaries (collectively the “Company”) as of March 31, 2010 and 2009, and the related consolidated statements of income, changes in stockholders’ equity and cash flows for each of the years in the three-year period ended March 31, 2010. The Company’s management is responsible for these consolidated financial statements. Our responsibility is to express an opinion on these consolidated financial statements based on our audits.
We conducted our audits in accordance with the standards of the Public Company Accounting Oversight Board (United States). Those standards require that we plan and perform the audits to obtain reasonable assurance about whether the consolidated financial statements are free of material misstatement. An audit includes examining, on a test basis, evidence supporting the amounts and disclosures in the consolidated financial statements. An audit also includes assessing the accounting principles used and significant estimates made by management, as well as evaluating the overall consolidated financial statement presentation. We believe that our audits provide a reasonable basis for our opinion.
In our opinion, the consolidated financial statements referred to above present fairly, in all material respects, the consolidated financial position of Clifton Savings Bancorp, Inc. and Subsidiaries as of March 31, 2010 and 2009, and the consolidated results of their operations and their cash flows for each of the years in the three-year period ended March 31, 2010, in conformity with accounting principles generally accepted in the United States of America.
We also have audited, in accordance with the standards of the Public Company Accounting Oversight Board (United States), Clifton Savings Bancorp, Inc. and Subsidiaries’ internal control over financial reporting as of March 31, 2010, based on the criteria established in Internal Control – Integrated Framework issued by the Committee of Sponsoring Organizations of the Treadway Commission (COSO), and our report dated June 9, 2010 expressed an unqualified opinion.
/s/ ParenteBeard LLC
Clark, New Jersey
June 9, 2010
34
Clifton Savings Bancorp, Inc. and Subsidiaries
Consolidated Statements of Financial Condition
|
March 31,
|
|||||||
|
2010
|
2009
|
||||||
|
(In Thousands, Except Share
|
|||||||
|
ASSETS
|
and Per Share Data)
|
||||||
|
Cash and due from banks
|
$ 21,671
|
$ 39,669
|
|||||
|
Interest-bearing deposits in other banks
|
11,790
|
11,457
|
|||||
|
Cash and Cash Equivalents
|
33,461
|
51,126
|
|||||
|
Securities available for sale, at fair value:
|
|
|
|||||
|
Investment
|
15,062
|
10,037
|
|||||
|
Mortgage-backed
|
57,081
|
78,122
|
|||||
|
Securities held to maturity, at cost:
|
|||||||
|
Investment, fair value of $159,511 and $75,754, respectively
|
159,969
|
74,997
|
|||||
|
Mortgage-backed, fair value of $285,536 and $240,173, respectively
|
275,801
|
231,218
|
|||||
|
Loans receivable
|
479,566
|
470,200
|
|||||
|
Allowance for loan losses
|
(2,050)
|
(1,700)
|
|||||
|
Net Loans
|
477,516
|
468,500
|
|||||
|
Bank owned life insurance
|
22,835
|
21,948
|
|||||
|
Premises and equipment
|
9,612
|
9,306
|
|||||
|
Federal Home Loan Bank of New York stock
|
7,157
|
7,740
|
|||||
|
Interest receivable
|
4,377
|
4,313
|
|||||
|
Other assets
|
4,836
|
2,463
|
|||||
|
Total Assets
|
$ 1,067,707
|
$ 959,770
|
|||||
|
LIABILITIES AND STOCKHOLDERS' EQUITY
|
|||||||
|
Liabilities
|
|||||||
|
Deposits:
|
|||||||
|
Non-interest bearing
|
$ 6,828
|
$ 5,263
|
|||||
|
Interest bearing
|
751,324
|
628,319
|
|||||
|
Total Deposits
|
758,152
|
633,582
|
|||||
|
Advances from Federal Home Loan Bank of New York
|
123,737
|
144,272
|
|||||
|
Advance payments by borrowers for taxes and insurance
|
5,193
|
4,825
|
|||||
|
Other liabilities and accrued expenses
|
4,633
|
3,927
|
|||||
|
Total Liabilities
|
891,715
|
786,606
|
|||||
|
Stockholders' Equity
|
|||||||
|
Preferred stock ($.01 par value), 1,000,000 shares
|
|||||||
|
authorized; shares issued or outstanding - none
|
-
|
-
|
|||||
|
Common stock ($.01 par value), 75,000,000 shares
|
|||||||
|
authorized; 30,530,470 shares issued, 26,398,079 shares outstanding at
|
|||||||
|
March 31, 2010; 26,732,607 shares outstanding at March 31, 2009
|
305
|
305
|
|||||
|
Paid-in capital
|
135,921
|
135,180
|
|||||
|
Deferred compensation obligation under Rabbi Trust
|
233
|
209
|
|||||
|
Retained earnings
|
89,361
|
84,889
|
|||||
|
Treasury stock, at cost; 4,132,391 shares at March 31, 2010;
|
|||||||
|
3,797,863 shares at March 31, 2009
|
(45,050)
|
(41,925)
|
|||||
|
Common stock acquired by Employee Stock Ownership
|
|||||||
|
Plan ("ESOP")
|
(6,411)
|
(7,144)
|
|||||
|
Accumulated other comprehensive income
|
1,820
|
1,809
|
|||||
|
Stock held by Rabbi Trust
|
(187)
|
(159)
|
|||||
|
Total Stockholders' Equity
|
175,992
|
173,164
|
|||||
|
Total Liabilities and Stockholders' Equity
|
$ 1,067,707
|
$ 959,770
|
|||||
See notes to consolidated financial statements.
35
Clifton Savings Bancorp, Inc. and Subsidiaries
Consolidated Statements of Income
|
Years Ended March 31,
|
|||||||||
|
2010
|
2009
|
2008
|
|||||||
|
(In Thousands, Except Share and Per Share Data)
|
|||||||||
|
Interest Income
|
|||||||||
|
Loans
|
$ 24,550
|
$ 23,966
|
$ 22,148
|
||||||
|
Mortgage-backed securities
|
16,905
|
16,240
|
8,521
|
||||||
|
Investments securities
|
3,037
|
3,515
|
6,403
|
||||||
|
Other interest-earning assets
|
464
|
680
|
1,498
|
||||||
|
Total Interest Income
|
44,956
|
44,401
|
|
38,570
|
|||||
|
Interest Expense
|
|
|
|
||||||
|
Deposits
|
17,678
|
20,091
|
22,066
|
||||||
|
Advances
|
5,288
|
5,848
|
2,419
|
||||||
|
Total Interest Expense
|
22,966
|
25,939
|
24,485
|
||||||
|
Net Interest Income
|
21,990
|
18,462
|
14,085
|
||||||
|
Provision for Loan Losses
|
433
|
260
|
90
|
||||||
|
Net Interest Income after Provision
|
|||||||||
|
for Loan Losses
|
21,557
|
18,202
|
13,995
|
||||||
|
Non-Interest Income
|
|
|
|
||||||
|
Fees and service charges
|
223
|
204
|
210
|
||||||
|
Bank owned life insurance
|
887
|
914
|
905
|
||||||
|
Other
|
26
|
32
|
23
|
||||||
|
Total Non-Interest Income
|
1,136
|
1,150
|
1,138
|
||||||
|
Non-Interest Expenses
|
|
|
|
||||||
|
Salaries and employee benefits
|
6,810
|
6,842
|
6,957
|
||||||
|
Occupancy expense of premises
|
1,249
|
1,052
|
1,032
|
||||||
|
Equipment
|
952
|
863
|
886
|
||||||
|
Directors' compensation
|
796
|
943
|
1,000
|
||||||
|
Advertising
|
253
|
269
|
316
|
||||||
|
Legal
|
254
|
85
|
307
|
||||||
|
Federal deposit insurance premium
|
1,183
|
328
|
68
|
||||||
|
Other
|
1,753
|
1,470
|
1,559
|
||||||
|
Total Non-Interest Expenses
|
13,250
|
11,852
|
12,125
|
||||||
|
Income before Income Taxes
|
9,443
|
7,500
|
3,008
|
||||||
|
Income Taxes
|
3,146
|
2,364
|
636
|
||||||
|
Net Income
|
$ 6,297
|
$ 5,136
|
$ 2,372
|
||||||
|
Net Income per Common Share
|
|||||||||
|
|
Basic
|
$ 0.24
|
$ 0.20
|
$ 0.09
|
|||||
|
Diluted
|
$ 0.24
|
$ 0.20
|
$ 0.09
|
||||||
|
Dividends per common share
|
$ 0.20
|
$ 0.20
|
$ 0.20
|
||||||
|
Weighted Average Number of Common Shares and Common
|
|||||||||
|
Stock Equivalents Outstanding:
|
|||||||||
|
Basic
|
25,947,037
|
26,134,756
|
27,104,113
|
||||||
|
Diluted
|
25,947,037
|
26,178,692
|
27,139,133
|
||||||
See notes to consolidated financial statements.
36
Clifton Savings Bancorp, Inc. and Subsidiaries
Consolidated Statements of Changes in Stockholders’ Equity
Years Ended March 31, 2010, 2009 and 2008
|
|
|
|
|||||||||||||||||||
|
Common
|
Paid-In
|
Deferred
Compensation
Obligation Under
|
Retained
|
Treasury
|
Common Stock
Acquired
|
Accumulated
Other
Comprehensive
|
Stock Held
by Rabbi
|
||||||||||||||
|
Stock
|
Capital
|
Rabbi Trust
|
Earnings
|
Stock
|
by ESOP
|
Income (Loss)
|
Trust
|
Total
|
|||||||||||||
|
(In Thousands, Except Share and Per Share Data)
|
|||||||||||||||||||||
|
Balance - March 31, 2007
|
$ 305
|
$ 132,071
|
$ 146
|
$ 81,363
|
$ (19,639)
|
$ (8,610)
|
$ (950)
|
$ (88)
|
$ 184,598
|
||||||||||||
|
Comprehensive income:
|
|||||||||||||||||||||
|
Net income
|
-
|
-
|
-
|
2,372
|
-
|
-
|
-
|
-
|
2,372
|
||||||||||||
|
Unrealized gain on securities available
|
|||||||||||||||||||||
|
for sale, net of income taxes of $937
|
-
|
-
|
-
|
-
|
-
|
-
|
1,409
|
-
|
1,409
|
||||||||||||
|
Pension benefits adjustment, net of income taxes
|
|||||||||||||||||||||
|
of $48
|
-
|
-
|
-
|
-
|
-
|
-
|
73
|
-
|
73
|
||||||||||||
|
Total Comprehensive Income
|
3,854
|
||||||||||||||||||||
|
ESOP shares committed to be released
|
-
|
60
|
-
|
-
|
-
|
733
|
-
|
-
|
793
|
||||||||||||
|
Purchase of treasury stock - 1,486,673 shares
|
-
|
-
|
-
|
-
|
(16,466)
|
-
|
-
|
-
|
(16,466)
|
||||||||||||
|
Stock option expense
|
-
|
500
|
-
|
-
|
-
|
-
|
-
|
-
|
500
|
||||||||||||
|
Vesting of Restricted Stock Awards
|
-
|
1,061
|
-
|
-
|
-
|
-
|
-
|
-
|
1,061
|
||||||||||||
|
Forfeiture of Restricted Stock Awards
|
-
|
8
|
-
|
-
|
(8)
|
-
|
-
|
-
|
-
|
||||||||||||
|
Funding of Supplemental Executive Retirement Plan
|
-
|
2
|
33
|
-
|
34
|
-
|
-
|
(36)
|
33
|
||||||||||||
|
Tax benefit from stock based compensation
|
-
|
45
|
-
|
-
|
-
|
-
|
-
|
-
|
45
|
||||||||||||
|
Cash dividends declared ($0.20 per share)
|
-
|
-
|
-
|
(2,063)
|
-
|
-
|
-
|
-
|
(2,063)
|
||||||||||||
|
Balance - March 31, 2008
|
305
|
133,747
|
179
|
81,672
|
(36,079)
|
(7,877)
|
532
|
(124)
|
172,355
|
||||||||||||
|
Comprehensive income:
|
|||||||||||||||||||||
|
Net income
|
-
|
-
|
-
|
5,136
|
-
|
-
|
-
|
-
|
5,136
|
||||||||||||
|
Unrealized gain on securities available
|
|||||||||||||||||||||
|
for sale, net of income taxes of $708
|
-
|
-
|
-
|
-
|
-
|
-
|
1,064
|
-
|
1,064
|
||||||||||||
|
Pension benefits adjustment, net of
|
|||||||||||||||||||||
|
income taxes of $134
|
-
|
-
|
-
|
-
|
-
|
-
|
201
|
-
|
201
|
||||||||||||
|
Total Comprehensive Income
|
6,401
|
||||||||||||||||||||
|
Pension benefits adjustment for change of
|
|||||||||||||||||||||
|
measurement date, net of income tax of $8
|
-
|
-
|
-
|
(47)
|
-
|
-
|
12
|
-
|
(35)
|
||||||||||||
|
ESOP shares committed to be released
|
-
|
44
|
-
|
-
|
-
|
733
|
-
|
-
|
777
|
||||||||||||
|
Purchase of treasury stock - 577,834 shares
|
-
|
-
|
-
|
-
|
(5,877)
|
-
|
-
|
-
|
(5,877)
|
||||||||||||
|
Stock option expense
|
-
|
246
|
-
|
-
|
-
|
-
|
-
|
-
|
246
|
||||||||||||
|
Vesting of Restricted Stock Awards
|
-
|
1,062
|
-
|
-
|
-
|
-
|
-
|
-
|
1,062
|
||||||||||||
|
Funding of Supplemental Executive Retirement Plan
|
-
|
3
|
30
|
-
|
31
|
-
|
-
|
(35)
|
29
|
||||||||||||
|
Tax benefit from stock based compensation
|
-
|
78
|
-
|
-
|
-
|
-
|
-
|
-
|
78
|
||||||||||||
|
Cash dividends declared ($0.20 per share)
|
-
|
-
|
-
|
(1,872)
|
-
|
-
|
-
|
-
|
(1,872)
|
||||||||||||
|
Balance - March 31, 2009
|
305
|
135,180
|
209
|
84,889
|
(41,925)
|
(7,144)
|
1,809
|
(159)
|
173,164
|
||||||||||||
|
Comprehensive income:
|
|||||||||||||||||||||
|
Net income
|
-
|
-
|
-
|
6,297
|
-
|
-
|
-
|
-
|
6,297
|
||||||||||||
|
Unrealized gain on securities available
|
|||||||||||||||||||||
|
for sale, net of income taxes of $39
|
-
|
-
|
-
|
-
|
-
|
-
|
58
|
-
|
58
|
||||||||||||
|
Pension benefits adjustment, net of
|
|||||||||||||||||||||
|
income tax (benefit) of ($32)
|
-
|
-
|
-
|
-
|
-
|
-
|
(47)
|
-
|
(47)
|
||||||||||||
|
Total Comprehensive Income
|
6,308
|
||||||||||||||||||||
|
ESOP shares committed to be released
|
-
|
(3)
|
-
|
-
|
-
|
733
|
-
|
-
|
730
|
||||||||||||
|
Purchase of treasury stock - 337,002 shares
|
-
|
-
|
-
|
-
|
(3,150)
|
-
|
-
|
-
|
(3,150)
|
||||||||||||
|
Stock option expense
|
-
|
66
|
-
|
-
|
-
|
-
|
-
|
-
|
66
|
||||||||||||
|
Vesting of Restricted Stock Awards
|
-
|
706
|
-
|
-
|
-
|
-
|
-
|
-
|
706
|
||||||||||||
|
Forfeiture of Restricted Stock Awards
|
-
|
3
|
-
|
-
|
(3)
|
-
|
-
|
-
|
-
|
||||||||||||
|
Funding of Supplemental Executive Retirement Plan
|
-
|
-
|
24
|
-
|
28
|
-
|
-
|
(28)
|
24
|
||||||||||||
|
Tax cost from stock based compensation
|
-
|
(31)
|
-
|
-
|
-
|
-
|
-
|
-
|
(31)
|
||||||||||||
|
Cash dividends declared ($0.20 per share)
|
-
|
-
|
-
|
(1,825)
|
-
|
-
|
-
|
-
|
(1,825)
|
||||||||||||
|
Balance - March 31, 2010
|
$ 305
|
$ 135,921
|
$ 233
|
$ 89,361
|
$ (45,050)
|
$ (6,411)
|
$ 1,820
|
$ (187)
|
$ 175,992
|
||||||||||||
See notes to consolidated financial statements.
37
Clifton Savings Bancorp, Inc. and Subsidiaries
Consolidated Statements of Cash Flows
|
Years Ended March 31,
|
||||||||||||
|
2010
|
2009
|
2008
|
||||||||||
|
(In Thousands)
|
||||||||||||
|
Cash Flows From Operating Activities
|
||||||||||||
|
Net income
|
$ | 6,297 | $ | 5,136 | $ | 2,372 | ||||||
|
Adjustments to reconcile net income to net cash provided by operating activities:
|
||||||||||||
|
Depreciation and amortization of premises and equipment
|
482 | 482 | 565 | |||||||||
|
Net (accretion) amortization of deferred fees and costs, premiums and discounts
|
(178 | ) | 40 | 392 | ||||||||
|
Amortization of component of net periodic pension (benefit) costs
|
(79 | ) | 307 | 121 | ||||||||
|
Provision for loan losses
|
433 | 260 | 90 | |||||||||
|
(Increase) decrease in interest receivable
|
(64 | ) | 265 | (138 | ) | |||||||
|
Deferred income tax benefit
|
(76 | ) | (468 | ) | (603 | ) | ||||||
|
(Increase) decrease in other assets
|
(2,304 | ) | 337 | (270 | ) | |||||||
|
(Decrease) increase in accrued interest payable
|
(83 | ) | (27 | ) | 385 | |||||||
|
Increase (decrease)in other liabilities
|
789 | 549 | (511 | ) | ||||||||
|
(Increase) in cash surrender value of bank owned life insurance
|
(887 | ) | (914 | ) | (905 | ) | ||||||
|
ESOP shares committed to be released
|
730 | 777 | 793 | |||||||||
|
Restricted stock expense
|
706 | 1,062 | 1,061 | |||||||||
|
Stock option expense
|
66 | 246 | 500 | |||||||||
|
Increase in deferred compensation obligation under Rabbi Trust
|
24 | 29 | 33 | |||||||||
|
Net Cash Provided by Operating Activities
|
5,856 | 8,081 | 3,885 | |||||||||
|
Cash Flows From Investing Activities
|
||||||||||||
|
Proceeds from calls, maturities and repayments of:
|
||||||||||||
|
Investment securities available for sale
|
- | - | 5,000 | |||||||||
|
Mortgage-backed securities available for sale
|
21,209 | 13,876 | 7,159 | |||||||||
|
Investment securities held to maturity
|
70,000 | 65,000 | 60,000 | |||||||||
|
Mortgage-backed securities held to maturity
|
72,484 | 37,006 | 29,963 | |||||||||
|
Redemptions of Federal Home Loan Bank of New York stock
|
1,239 | 1,051 | 864 | |||||||||
|
Purchases of:
|
||||||||||||
|
Investment securities available for sale
|
(5,000 | ) | (10,000 | ) | - | |||||||
|
Mortgage-backed securities available for sale
|
- | - | (49,269 | ) | ||||||||
|
Investment securities held to maturity
|
(154,967 | ) | (30,000 | ) | (5,000 | ) | ||||||
|
Mortgage-backed securities held to maturity
|
(116,834 | ) | (87,539 | ) | (120,850 | ) | ||||||
|
Loans receivable
|
(2,943 | ) | (4,636 | ) | (10,935 | ) | ||||||
|
Premises and equipment
|
(788 | ) | (787 | ) | (1,182 | ) | ||||||
|
Federal Home Loan Bank of New York stock
|
(656 | ) | (1,255 | ) | (5,184 | ) | ||||||
|
Net (increase) decrease in loans receivable
|
(6,662 | ) | (43,612 | ) | 8,776 | |||||||
|
Net Cash Used in Investing Activities
|
(122,918 | ) | (60,896 | ) | (80,658 | ) | ||||||
See notes to consolidated financial statements.
38
Clifton Savings Bancorp, Inc. and Subsidiaries
Consolidated Statements of Cash Flows
|
Years Ended March 31,
|
||||||||||||
|
2010
|
2009
|
2008
|
||||||||||
|
(In Thousands)
|
||||||||||||
|
Cash Flows From Financing Activities
|
||||||||||||
|
Net increase in deposits
|
$ | 124,570 | $ | 56,860 | $ | 9,263 | ||||||
|
Proceeds from long-term advances from Federal Home Loan Bank of New York
|
- | 25,000 | 116,194 | |||||||||
|
Principal payments on advances from Federal Home Loan Bank of New York
|
(20,535 | ) | (23,034 | ) | (19,234 | ) | ||||||
|
Net increase in payments by borrowers for taxes and insurance
|
368 | 555 | 160 | |||||||||
|
Minority dividends paid
|
(1,825 | ) | (1,872 | ) | (2,063 | ) | ||||||
|
Purchase of treasury stock
|
(3,150 | ) | (5,877 | ) | (16,466 | ) | ||||||
|
Income taxes (expense) benefit from stock based compensation
|
(31 | ) | 78 | 45 | ||||||||
|
Net Cash Provided by Financing Activities
|
99,397 | 51,710 | 87,899 | |||||||||
|
Net (Decrease) Increase in Cash and Cash Equivalents
|
(17,665 | ) | (1,105 | ) | 11,126 | |||||||
|
Cash and Cash Equivalents - Beginning
|
51,126 | 52,231 | 41,105 | |||||||||
|
Cash and Cash Equivalents - Ending
|
$ | 33,461 | $ | 51,126 | $ | 52,231 | ||||||
|
Supplementary Cash Flows Information:
|
||||||||||||
|
Cash Paid During the Period for:
|
||||||||||||
|
Interest on deposits and borrowings
|
$ | 23,049 | $ | 25,966 | $ | 24,100 | ||||||
|
Income taxes paid, net of refunds
|
$ | 2,715 | $ | 1,902 | $ | 1,674 | ||||||
See notes to consolidated financial statements.
39
Clifton Savings Bancorp, Inc. and Subsidiaries
Notes to Consolidated Financial Statements
Note 1 - Summary of Significant Accounting Policies
Basis of Consolidated Financial Statement Presentation
The consolidated financial statements include the accounts of the Clifton Savings Bancorp, Inc. (the “Company”), the Company’s wholly-owned subsidiary, Clifton Savings Bank (the “Savings Bank”) and the Savings Bank’s wholly-owned subsidiary, Botany Inc. (“Botany”). All significant intercompany accounts and transactions have been eliminated in consolidation.
The consolidated financial statements have been prepared in conformity with accounting principles generally accepted in the United States of America (“GAAP”). In preparing the consolidated financial statements, management is required to make estimates and assumptions that affect the reported amounts of assets and liabilities as of the consolidated statement of financial condition dates and revenues and expenses for the periods then ended. Actual results could differ significantly from those estimates.
Material estimates that are particularly susceptible to significant changes relate to the determination of the allowance for loan losses, the assessment of prepayment risks associated with mortgage-backed securities, the identification of other-than-temporary impairment of securities, the determination of the liability and expense on the defined benefit plans, and the determination of the amount of deferred tax assets which are more likely than not to be realized. Management believes that the allowance for loan losses is adequate, prepayment risks associated with mortgage-backed securities are properly recognized, the evaluation for other-than-temporary impairment of securities are done in accordance with GAAP; the liability and expense for the defined benefit plans are based upon actuarial assumptions of future events that are reasonable, and all deferred tax assets are more likely than not to be recognized. While management uses available information to recognize losses on loans, future additions to the allowance for loan losses may be necessary based on changes in economic conditions in the market area. Additionally, assessments of prepayment risks related to mortgage-backed securities are based upon current market conditions, which are subject to frequent change. Finally, the determination of the amount of deferred tax assets more likely than not to be realized is dependent on projections of future earnings, which are subject to frequent change.
In addition, various regulatory agencies, as an integral part of their examination process, periodically review the Savings Bank’s allowance for loan losses. Such agencies may require the Savings Bank to recognize additions to the allowance for loan losses based on their judgments about information available to them at the time of their examinations.
In accordance with Financial Accounting Standards Board (“FASB”) Accounting Standards Codification (“ASC”) Topic 855, “Subsequent Events”, the Company has evaluated events and transactions occurring subsequent to the Statement of Financial Condition date of March 31, 2010 for items that should potentially be recognized or disclosed in these consolidated financial statements. The evaluation was conducted through the date these consolidated financial statements were issued.
Business of the Company and Subsidiaries
The Company’s primary business is the ownership and operation of the Savings Bank. The Savings Bank is principally engaged in the business of attracting deposits from the general public at its ten locations in northern New Jersey and using these deposits, together with other funds, to invest in securities and to make loans collateralized by residential and commercial real estate and, to a lesser extent, consumer loans. The Savings Bank’s subsidiary, Botany, was organized in December 2004 under New Jersey law as a New Jersey Investment Company primarily to hold investment and mortgage-backed securities.
40
Clifton Savings Bancorp, Inc. and Subsidiaries
Notes to Consolidated Financial Statements
|
|
|
Note 1 - Summary of Significant Accounting Policies (Continued)
Cash and Cash Equivalents
Cash and cash equivalents include cash and amounts due from banks and interest-bearing deposits in other banks with original maturities of three months or less.
Securities
Investments in debt securities over which there exists a positive intent and ability to hold to maturity are classified as held to maturity securities and reported at amortized cost. Debt and equity securities that are bought and held principally for the purpose of selling them in the near term are classified as trading securities and reported at fair value, with unrealized holding gains or losses included in earnings. Debt and equity securities not classified as trading securities nor as held to maturity securities are classified as available for sale securities and reported at fair value, with unrealized holding gain or losses, net of applicable deferred income taxes, reported in the accumulated other comprehensive income (loss) component of stockholders’ equity. The Company had no trading securities at March 31, 2010 and 2009.
An individual security is considered impaired when the fair value of such security is less than its amortized cost. Management evaluates all securities with unrealized losses quarterly to determine if such impairments are temporary or “other-than-temporary” in accordance with applicable accounting guidance. The Company accounts for temporary impairments based upon security classification as either available for sale or held to maturity. Temporary impairments on available for sale securities are recognized on a tax-effected basis, through other comprehensive income (loss) with offsetting entries adjusting the carrying value of the securities and the balance of deferred income taxes. Temporary impairments of held to maturity securities are not recognized in the consolidated financial statements. Information concerning the amount and duration of impairments on securities is disclosed in the notes to the consolidated financial statements.
Other-than-temporary impairments on debt securities that the Company has decided to sell or will more likely than not be required to sell prior to the full recovery of their fair value to a level to, or exceeding, amortized cost are recognized in earnings. Otherwise, the other-than-temporary impairment is bifurcated into credit related and noncredit-related components. The credit related impairment generally represents the amount by which the present value of the cash flows expected to be collected on a debt security falls below its amortized cost. The noncredit-related component represents the remaining portion of the impairment not otherwise designated as credit-related. Credit related other-than-temporary impairments are recognized in earnings while noncredit-related other-than-temporary impairments are recognized, net of deferred income taxes, in other comprehensive income (loss).
Discounts and premiums on all securities are accreted or amortized to maturity by use of the level-yield method. Gain or loss on sales of securities is based on the specific identification method.
Concentration of Credit Risk
Financial instruments which potentially subject the Company, Savings Bank and Botany to concentrations of credit risk consist of cash and cash equivalents, investment and mortgage-backed securities and loans. Cash and cash equivalents include amounts placed with highly rated financial institutions. Investment securities include securities backed by the U.S. Government and other highly rated instruments. The Savings Bank’s lending
41
Clifton Savings Bancorp, Inc. and Subsidiaries
Notes to Consolidated Financial Statements
Note 1 - Summary of Significant Accounting Policies (Continued)
Concentration of Credit Risk (Continued)
activity is primarily concentrated in loans collateralized by real estate in the State of New Jersey. As a result, credit risk is broadly dependent on the real estate market and general economic conditions in the State.
Loans Receivable
Loans receivable which the Savings Bank has the intent and ability to hold until maturity or loan pay-off are stated at unpaid principal balances, plus purchase premiums and net deferred loan origination costs. Interest is calculated by use of the simple interest method.
Recognition of interest by the accrual method is generally discontinued when interest or principal payments are ninety days or more in arrears, or when other factors indicate that the collection of such amounts is doubtful. At the time a loan is placed on nonaccrual status, an allowance for uncollected interest is recorded in the current period for previously accrued and uncollected interest. Interest on such loans, if appropriate, is recognized as income when payments are received. A loan is returned to accrual status when interest or principal payments are no longer ninety days or more in arrears on a contractual basis and factors indicating doubtful collectability no longer exist.
Allowance for Loan Losses
An allowance for loan losses is maintained at a level considered necessary to provide for loan losses based upon an evaluation of known and inherent losses in the loan portfolio. Management of the Savings Bank, in determining the allowance for loan losses, considers the losses inherent in its loan portfolio and changes in the nature and volume of its loan activities, along with the local economic and real estate market conditions. The Savings Bank utilizes a two-tier approach: (1) identification of impaired loans and establishment of specific loss allowances on such loans; and (2) establishment of a general valuation allowance on the remainder of its loan portfolio. The Savings Bank maintains a loan review system which allows for a periodic review of its loan portfolio and the early identification of impaired loans. The Company considers one- to four-family mortgage loans and consumer installment loans to be homogeneous and, therefore, does not separately evaluate them for impairment, unless they are considered troubled debt restructurings. A loan is considered to be a troubled debt restructuring when, to maximize the recovery of the loan, the Company modifies the borrowers existing loan terms and conditions in response to financial difficulties experienced by the borrower.
Management takes into consideration, among other things, delinquency status, size of loans, types of collateral and financial condition of borrowers. A loan is deemed to be impaired when, based on current information and events, it is probable that the Savings Bank will be unable to collect all amounts when due according to the contractual terms of the loan agreement. All loans identified as impaired are evaluated individually. The Savings Bank does not aggregate such loans for evaluation purposes. Loan impairment is measured based on the present value of expected future cash flows discounted at the loan’s effective interest rate or, as a practical expedient, at the loan’s observable market price or the fair value of the collateral if the loan is collateral dependent. Payments received on impaired loans are recognized as interest income and then applied to principal.
General loan loss allowances are based upon a combination of factors including, but not limited to, actual loan loss experience, composition of the loan portfolio, current economic conditions and management’s judgment. Regardless of the extent of the analysis of customer performance, portfolio evaluations, trends or risk management processes established, certain inherent, but undetected losses are probable within the loan portfolio. This is due to several factors including inherent delays in obtaining information regarding a customer’s financial condition or changes in their financial condition, the judgmental nature of individual loan evaluations, collateral assessments and the interpretation of economic trends, and the sensitivity of assumptions utilized to establish
42
Clifton Savings Bancorp, Inc. and Subsidiaries
Notes to Consolidated Financial Statements
Note 1 - Summary of Significant Accounting Policies (Continued)
Allowance for Loan Losses (Continued)
allocated allowances for homogeneous groups of loans among other factors. These other risk factors are continuously reviewed and revised by management where conditions indicate that the estimates initially applied are different from actual results.
Loan Origination Fees and Costs
The Savings Bank defers loan origination fees and certain direct loan origination costs and initially amortizes such amounts, using the interest method, as an adjustment of yield over the contractual lives of the related loans. The Savings Bank anticipates prepayments within its loan portfolio and adjusts the amortization of origination fees and costs accordingly using an annually adjusted prepayment factor.
Federal Home Loan Bank of New York Stock
As a member of the Federal Home Loan Bank of New York (“FHLB”), we are required to acquire and hold shares of FHLB Class B stock. Our holding requirement varies based on our activities, primarily our outstanding borrowings, with the FHLB. Our investment in FHLB stock is carried at cost. We conduct a periodic review and evaluation of our FHLB stock to determine if any impairment exists. Management has determined that no other-than-temporary impairment existed during 2010, 2009, and 2008.
Bank Owned Life Insurance
Bank owned life insurance (“BOLI) is accounted for using the cash surrender value method and is recorded at its realizable value. The change in the net asset value is recorded as non-interest income.
Premises and Equipment
Premises and equipment are comprised of land, at cost, and land improvements, buildings and improvements, furnishings and equipment and leasehold improvements, at cost, less accumulated depreciation and amortization. Depreciation and amortization charges are computed on the straight-line method over the following estimated useful lives:
|
Years
|
|
Land improvements
|
5 - 20
|
||
|
Buildings and improvements
|
5 - 40
|
||
|
Furnishings and equipment
|
2 - 10
|
||
|
Leasehold improvements
|
Shorter of useful life or term of lease
(2 - 5)
|
Significant renovations and additions are capitalized as part of premises and equipment account. Maintenance and repairs are charged to operations as incurred.
43
Clifton Savings Bancorp, Inc. and Subsidiaries
Notes to Consolidated Financial Statements
Note 1 - Summary of Significant Accounting Policies (Continued)
Income Taxes
The Company, Savings Bank and Botany file a consolidated federal income tax return. Income taxes are allocated based on their respective contribution of income or loss to the consolidated federal income tax return. Separate state income tax returns are filed.
Federal and state income taxes have been provided on the basis of reported income. The amounts reflected on the Company’s and subsidiaries’ tax returns differ from these provisions due principally to temporary differences in the reporting of certain items for financial reporting and income tax reporting purposes.
Deferred income tax expense or benefit is determined by recognizing deferred tax assets and liabilities for the estimated future tax consequences attributable to differences between the financial statement carrying amounts of existing assets and liabilities and their respective tax basis. Deferred tax assets and liabilities are measured using enacted tax rates expected to apply to taxable income in the years in which those temporary differences are expected to be recovered or settled. The effect on deferred tax assets and liabilities of a change in tax rates is recognized in earnings in the period that includes the enactment date. The realization of deferred tax assets is assessed and a valuation allowance provided, when necessary, for the portion of any assets which are not likely to be realized. Management believes, based upon current facts, that it is more likely than not that there will be sufficient taxable income in future years to realize the deferred tax assets.
The Company accounts for uncertainty in income taxes recognized in the consolidated financial statements in accordance with ASC Topic 740, “Income Taxes,” which prescribes a recognition threshold and measurement attribute for the financial statement recognition and measurement of a tax position taken or expected to be taken in a tax return, and also provides guidance on derecognition, classification, interest and penalties, accounting in interim periods, disclosure and transition. As a result of the Company’s evaluation, no significant income tax uncertainties have been identified. Therefore, the Company recognized no adjustment for unrecognized income tax benefits for the years ended March 31, 2010, 2009 and 2008. Our policy is to recognize interest and penalties on unrecognized tax benefits in income taxes expense in the consolidated statement of income. The Company did not recognize any interest and penalties for the years ended March 31, 2010, 2009, and 2008. The tax years subject to examination by the taxing authorities are the years ended December 31, 2009, 2008, and 2007 for federal and the years ended December 31, 2009, 2008, 2007 and 2006 for New Jersey.
Interest Rate Risk
The potential for interest-rate risk exists as a result of the generally shorter duration of interest-sensitive liabilities compared to the generally longer duration of interest-sensitive assets. In a rising rate environment, liabilities will reprice faster than assets, thereby reducing net interest income. For this reason, management regularly monitors the maturity structure of assets and liabilities in order to measure its level of interest-rate risk and to plan for future volatility.
Earnings Per Share (EPS)
Basic EPS is based on the weighted average number of common shares actually outstanding, and is adjusted for Employee Stock Ownership Plan shares not yet committed to be released and deferred compensation obligations required to be settled in shares of Company stock. Unvested restricted stock awards, which contain rights to non-forfeitable dividends, are considered participating securities and the two-class method of computing basic and diluted EPS is applied. Diluted EPS reflects the potential dilution that could occur if securities or other contracts to issue common stock, such as outstanding stock options, were exercised or converted into common stock or resulted in the issuance of common stock that then shared in the earnings of the Company. Diluted EPS is calculated by adjusting the weighted average number of shares of common stock outstanding to include the effect
44
Clifton Savings Bancorp, Inc. and Subsidiaries
Notes to Consolidated Financial Statements
Note 1 - Summary of Significant Accounting Policies (Continued)
Earnings Per Share (EPS) (Continued)
of contracts or securities exercisable (such as stock options) or which could be converted into common stock, if dilutive, using the treasury stock method. The calculation of diluted EPS for year ended March 31, 2010 does not included incremental shares related to outstanding stock options due to their anti-dilutive impact. The calculation of diluted EPS for the years ended March 31, 2009, and 2008 includes incremental shares related to outstanding stock options of 43,936 and 35,020, respectively. Shares issued and reacquired during any period are weighted for the portion of the period they were outstanding.
Stock-Based Compensation
The Company expenses the fair value of all options and restricted stock granted over their requisite service periods.
Defined Benefit Plans
The Company maintains a nonqualified, unfunded pension plan for the directors of the Company. The Company also maintains a post-retirement healthcare plan for the formal president’s spouse. The expected costs of benefits provided for both plans are actuarially determined and accrued.
The accounting guidance related to retirement and post-retirement healthcare benefits requires an employer to: (a) recognize in its statement of financial position an asset for a plan’s overfunded status or a liability for a plan’s underfunded status; (b) measure a plan’s assets and its obligations that determine its funded status as
of the end of the employer’s fiscal year; and (c) recognize, in comprehensive income, changes in the funded status of a defined benefit post-retirement plan in the year in which the changes occur. The accounting guidance requires that plan assets and benefit obligations be measured as of the date of the employer’s fiscal
year-end statement of financial condition. The measurement date requirement became effective for the Company during the fiscal year ended March 31, 2009.
Reclassification
Certain amounts for prior periods have been restated to conform to the current year’s presentation.
Recent Accounting Pronouncements
In January 2010, the FASB issued ASU 2010-06, “Fair Value Measurements and Disclosures (Topic 820)”. The amendments with ASU 2010-06 require new disclosures as follows: (1) A reporting entity should disclose separately the amounts of significant transfers in and out of Level 1 and Level 2 fair value measurements and describe the reasons for the transfers.(2) In the reconciliation for fair value measurements using significant unobservable inputs (Level 3), a reporting entity should present separately information about purchases, sales, issuances, and settlements (that is, on a gross basis rather than as one net number). This update provides amendments to Subtopic 820-10 that clarify existing disclosures as follows: (1) A reporting entity should provide fair value measurement disclosures for each class of assets and liabilities. A class is often a subset of assets or liabilities within a line item in the statement of financial position. A reporting entity needs to use judgment in determining the appropriate classes of assets and liabilities. (2) Disclosures about inputs and valuation techniques. A reporting entity should provide disclosures about the valuation techniques and inputs used to measure fair value for both recurring and nonrecurring fair value measurements. Those disclosures are required for fair value measurements that fall in either Level 2 or Level 3. This update also includes conforming amendments to the guidance on employers' disclosures about postretirement benefit plan assets
45
Clifton Savings Bancorp, Inc. and Subsidiaries
Notes to Consolidated Financial Statements
Note 1 - Summary of Significant Accounting Policies (Continued)
Recent Accounting Pronouncements (Continued)
(Subtopic 715-20). The conforming amendments to Subtopic 715-20 change the terminology from major categories of assets to classes of assets and provide a cross reference to the guidance in Subtopic 820-10 on how to determine appropriate classes to present fair value disclosures. The new disclosures and clarifications of existing disclosures are effective for interim and annual reporting periods beginning after December 15, 2009, except for the disclosures about purchases, sales, issuances, and settlements in the roll forward of activity in Level 3 fair value measurements. Those disclosures are effective for fiscal years beginning after December 15, 2010, and for interim periods within those fiscal years. The Company does not expect this new standard will have a material impact on its consolidated financial statements.
In February 2010, the FASB issued ASU 2010-09, “Subsequent Events (Topic 855): Amendments to Certain Recognition and Disclosure Requirements”. These amendments remove the requirement for an SEC filer to disclose a date through which subsequent events have been evaluated in both issued and revised financial statements. Revised financial statements include financial statements revised as a result of either correction of an error or retrospective application of U.S. GAAP. The FASB also clarified that if the financial statements have been revised, then an entity that is not an SEC filer should disclose both the date that the financial statements were issued or available to be issued and the date the revised financial statements were issued or available to be issued. The FASB believes these amendments remove potential conflicts with the SEC’s literature.
In addition, the amendments in the ASU require an entity that is a conduit bond obligor for conduit debt securities that are traded in a public market to evaluate subsequent events through the date of issuance of its financial statements and must disclose such date. All of the amendments in the ASU were effective upon issuance (February 24, 2010) except for the use of the issued date for conduit debt obligors. That amendment is effective for interim or annual periods ending after June 15, 2010. The adoption of this the new standard did not have a material impact on its consolidated financial statement.
Note 2 – Stock Repurchase Program and Dividend Waiver
The Company has announced several stock repurchase programs. The repurchased shares are held as treasury stock for general corporate use. During the years ended March 31, 2010 and 2009, 318,165 and 558,835 shares were repurchased at an aggregate cost of approximately $3.0 million, or $9.35 per share, and $5.7 million, or $10.12 per share, respectively under these programs. Additionally, during the years ended March 31, 2010 and 2009, 18,837 and 18,999 shares were purchased at a total cost of $176,000 or $9.33 per share, and $223,000 or $11.74 per share, respectively, representing the withholding of shares subject to restricted stock awards under the Clifton Savings Bancorp, Inc. 2005 Equity Incentive Plan for payment of taxes due upon the vesting of restricted stock awards.
During each of the years ended March 31, 2010 and 2009, Clifton MHC (“MHC”), the federally chartered mutual holding company of the Company, waived its right, upon non-objection from the Office of Thrift Supervision (“OTS”) to receive cash dividends of approximately $3.4 million on the shares of Company common stock it owns. The cumulative amount of dividends waived by the MHC through March 31, 2010 was approximately $19.1 million. The dividends waived are considered as a restriction on the retained earnings of the Company.
46
Clifton Savings Bancorp, Inc. and Subsidiaries
Notes to Consolidated Financial Statements
Note 3 - Investment Securities
|
March 31, 2010
|
||||||||||||||||
|
Gross
|
Gross
|
|||||||||||||||
|
Amortized
|
Unrealized
|
Unrealized
|
Fair
|
|||||||||||||
|
Cost
|
Gains
|
Losses
|
Value
|
|||||||||||||
|
Available for sale:
|
(In Thousands)
|
|||||||||||||||
|
Debt securities:
|
||||||||||||||||
|
U.S. Government agencies maturing:
|
||||||||||||||||
|
After one but within five years
|
$ | 15,000 | $ | 62 | $ | - | $ | 15,062 | ||||||||
| $ | 15,000 | $ | 62 | $ | - | $ | 15,062 | |||||||||
|
Held to maturity:
|
||||||||||||||||
|
Debt securities:
|
||||||||||||||||
|
U.S. Government agencies maturing:
|
||||||||||||||||
|
After one but within five years
|
$ | 60,000 | $ | 336 | $ | 53 | $ | 60,283 | ||||||||
|
After five but within ten years
|
64,983 | 10 | 359 | 64,634 | ||||||||||||
|
After ten years
|
34,986 | - | 392 | 34,594 | ||||||||||||
| $ | 159,969 | $ | 346 | $ | 804 | $ | 159,511 | |||||||||
|
March 31, 2009
|
||||||||||||||||
|
Gross
|
Gross
|
|||||||||||||||
|
Amortized
|
Unrealized
|
Unrealized
|
Fair
|
|||||||||||||
|
Cost
|
Gains
|
Losses
|
Value
|
|||||||||||||
|
Available for sale:
|
(In Thousands)
|
|||||||||||||||
|
Debt securities:
|
||||||||||||||||
|
U.S. Government agencies maturing:
|
||||||||||||||||
|
After one but within five years
|
$ | 10,000 | $ | 37 | $ | - | $ | 10,037 | ||||||||
| $ | 10,000 | $ | 37 | $ | - | $ | 10,037 | |||||||||
|
Held to maturity:
|
||||||||||||||||
|
Debt securities:
|
||||||||||||||||
|
U.S. Government agencies maturing:
|
||||||||||||||||
|
Within one year
|
$ | 29,997 | $ | 593 | $ | - | $ | 30,590 | ||||||||
|
After one but within five years
|
45,000 | 237 | 73 | 45,164 | ||||||||||||
| $ | 74,997 | $ | 830 | $ | 73 | $ | 75,754 | |||||||||
47
Clifton Savings Bancorp, Inc. and Subsidiaries
Notes to Consolidated Financial Statements
Note 3 - Investment Securities (continued)
The age of gross unrealized losses and the fair value of related investment securities at March 31, 2010 and 2009 were as follows.
|
Less Than 12 Months
|
12 Months or More
|
Total
|
||||||||||||||||||||||
|
Gross
|
Gross
|
Gross
|
||||||||||||||||||||||
|
Unrealized
|
Unrealized
|
Unrealized
|
||||||||||||||||||||||
|
Fair Value
|
Losses
|
Fair Value
|
Losses
|
Fair Value
|
Losses
|
|||||||||||||||||||
|
(In Thousands)
|
||||||||||||||||||||||||
|
March 31, 2010:
|
||||||||||||||||||||||||
|
U.S. Government agencies:
|
||||||||||||||||||||||||
|
Held to maturity
|
$ | 99,176 | $ | 804 | $ | - | $ | - | $ | 99,176 | $ | 804 | ||||||||||||
|
March 31, 2009:
|
||||||||||||||||||||||||
|
U.S. Government agencies:
|
||||||||||||||||||||||||
|
Held to maturity
|
$ | 4,926 | $ | 73 | $ | - | $ | - | $ | 4,926 | $ | 73 | ||||||||||||
Management does not believe that any of the unrealized losses at March 31, 2010 (nineteen U.S. Government agencies) represent an other-than-temporary impairment as they are primarily related to market interest rates and not related to the underlying credit quality of the issuers of the securities. Additionally, the Company and subsidiaries have the ability, and management has the intent, to hold such securities for the time necessary to recover amortized cost and does not have the intent to sell the securities, and it is more likely than not that it will not have to sell the securities before recovery of its amortized cost.
There were no sales of investment securities available for sale or held to maturity during the years ended March 31, 2010, 2009, and 2008.
Note 4 - Mortgage-Backed Securities
|
March 31, 2010
|
||||||||||||||||
|
Gross
|
Gross
|
|||||||||||||||
|
Amortized
|
Unrealized
|
Unrealized
|
Fair
|
|||||||||||||
|
Cost
|
Gains
|
Losses
|
Value
|
|||||||||||||
|
(In Thousands)
|
||||||||||||||||
|
Available for sale:
|
||||||||||||||||
|
Federal Home Loan Mortgage Corporation
|
$ | 23,561 | $ | 1,399 | $ | - | $ | 24,960 | ||||||||
|
Federal National Mortgage Association
|
30,378 | 1,743 | - | 32,121 | ||||||||||||
| $ | 53,939 | $ | 3,142 | $ | - | $ | 57,081 | |||||||||
|
Held to maturity:
|
||||||||||||||||
|
Federal Home Loan Mortgage Corporation
|
$ | 112,501 | $ | 5,622 | $ | 69 | $ | 118,054 | ||||||||
|
Federal National Mortgage Association
|
104,023 | 3,375 | 169 | 107,229 | ||||||||||||
|
Governmental National Mortgage
|
||||||||||||||||
|
Association
|
59,277 | 980 | 4 | 60,253 | ||||||||||||
| $ | 275,801 | $ | 9,977 | $ | 242 | $ | 285,536 | |||||||||
48
Clifton Savings Bancorp, Inc. and Subsidiaries
Notes to Consolidated Financial Statements
Note 4 - Mortgage-Backed Securities (Continued)
|
March 31, 2009
|
||||||||||||||||
|
Gross
|
Gross
|
|||||||||||||||
|
Amortized
|
Unrealized
|
Unrealized
|
Fair
|
|||||||||||||
|
Cost
|
Gains
|
Losses
|
Value
|
|||||||||||||
|
(In Thousands)
|
||||||||||||||||
|
Available for sale:
|
||||||||||||||||
|
Federal Home Loan Mortgage Corporation
|
$ | 33,357 | $ | 1,466 | $ | - | $ | 34,823 | ||||||||
|
Federal National Mortgage Association
|
41,695 | 1,647 | 43 | 43,299 | ||||||||||||
| $ | 75,052 | $ | 3,113 | $ | 43 | $ | 78,122 | |||||||||
|
Held to maturity:
|
||||||||||||||||
|
Federal Home Loan Mortgage Corporation
|
$ | 136,570 | $ | 5,478 | $ | 79 | $ | 141,969 | ||||||||
|
Federal National Mortgage Association
|
59,317 | 2,492 | 35 | 61,774 | ||||||||||||
|
Governmental National Mortgage
|
||||||||||||||||
|
Association
|
35,331 | 1,231 | 132 | 36,430 | ||||||||||||
| $ | 231,218 | $ | 9,201 | $ | 246 | $ | 240,173 | |||||||||
Contractual maturity data for mortgage-backed securities is as follows:
|
March 31,
|
||||||||||||||||
|
2010
|
2009
|
|||||||||||||||
|
Amortized
|
Amortized
|
|||||||||||||||
|
Cost
|
Fair Value
|
Cost
|
Fair Value
|
|||||||||||||
|
Available for sale:
|
(In Thousands) | |||||||||||||||
|
Due after five through ten years
|
$ | 13,279 | $ | 14,083 | $ | 8,980 | $ | 9,378 | ||||||||
|
Due after ten years
|
40,660 | 42,998 | 66,072 | 68,744 | ||||||||||||
| $ | 53,939 | $ | 57,081 | $ | 75,052 | $ | 78,122 | |||||||||
|
Held to maturity:
|
||||||||||||||||
|
Due within one year
|
$ | 28 | $ | 28 | $ | 1,739 | $ | 1,728 | ||||||||
|
Due after one through five years
|
149 | 160 | 308 | 322 | ||||||||||||
|
Due after five through ten years
|
17,735 | 18,730 | 22,426 | 23,320 | ||||||||||||
|
Due after ten years
|
257,889 | 266,618 | 206,745 | 214,803 | ||||||||||||
| $ | 275,801 | $ | 285,536 | $ | 231,218 | $ | 240,173 | |||||||||
The amortized cost and carrying values shown above are by contractual final maturity. Actual maturities will differ from contractual final maturities due to scheduled monthly payments related to mortgage-backed securities and due to the borrowers having the right to prepay obligations with or without prepayment penalties.
The Company’s mortgage-backed securities are generally secured by residential mortgage loans with contractual maturities of 15 years or greater. However, the effective lives of those securities are generally shorter than their contractual maturities due to principal amortization and prepayment of the mortgage loans comprised within those securities. Investors in mortgage pass-though securities generally share in the receipt of principal repayments on a pro-rata basis as paid by the borrowers.
49
Clifton Savings Bancorp, Inc. and Subsidiaries
Notes to Consolidated Financial Statements
Note 4 - Mortgage-Backed Securities (Continued)
The age of gross unrealized losses and the fair value of related mortgage-backed securities were as follows:
|
Less Than 12 Months
|
12 Months or More
|
Total
|
|||||||||||
|
Gross
|
Gross
|
Gross
|
|||||||||||
|
Unrealized
|
Unrealized
|
Unrealized
|
|||||||||||
|
Fair Value
|
Losses
|
Fair Value
|
Losses
|
Fair Value
|
Losses
|
||||||||
|
(In Thousands)
|
|||||||||||||
|
March 31, 2010:
|
|||||||||||||
|
Held to maturity:
|
|||||||||||||
|
Federal Home Loan Mortgage Corporation
|
$ 9,950
|
$ 69
|
$ -
|
$ -
|
$ 9,950
|
$ 69
|
|||||||
|
Federal National Mortgage Association
|
24,460
|
168
|
90
|
1
|
24,550
|
169
|
|||||||
|
Governmental National Mortgage Association
|
10,556
|
4
|
-
|
-
|
10,556
|
4
|
|||||||
|
$ 44,966
|
$ 241
|
$ 90
|
$ 1
|
$ 45,056
|
$ 242
|
||||||||
|
March 31, 2009:
|
|||||||||||||
|
Available for sale:
|
|||||||||||||
|
Federal National Mortgage Association
|
$ 4,059
|
$ 43
|
$ -
|
$ -
|
$ 4,059
|
$ 43
|
|||||||
|
Held to maturity:
|
|||||||||||||
|
Federal Home Loan Mortgage Corporation
|
$ 6,358
|
$ 43
|
$ 2,287
|
$ 36
|
$ 8,645
|
$ 79
|
|||||||
|
Federal National Mortgage Association
|
1,847
|
22
|
1,369
|
13
|
3,216
|
35
|
|||||||
|
Governmental National Mortgage Association
|
472
|
3
|
5,850
|
129
|
6,322
|
132
|
|||||||
|
$ 8,677
|
$ 68
|
$ 9,506
|
$ 178
|
$ 18,183
|
$ 246
|
||||||||
|
$ 12,736
|
$ 111
|
$ 9,506
|
$ 178
|
$ 22,242
|
$ 289
|
||||||||
Management does not believe that any of the unrealized losses at March 31, 2010 (four FHLMC, eight FNMA, and three GNMA mortgage-backed securities) represent an other-than-temporary impairment as they are primarily related to market interest rates and not related to the underlying credit quality of the issuers of the securities. Additionally, the Company and Subsidiaries have the ability, and management has the intent, to hold such securities for the time necessary to recover amortized cost and does not have the intent to sell the securities, and it is more likely than not that it will not have to sell the securities before recovery of its amortized cost.
There were no sales of mortgage-backed securities available for sale or held to maturity during the years ended March 31, 2010, 2009 and 2008.
50
Clifton Savings Bancorp, Inc. and Subsidiaries
Notes to Consolidated Financial Statements
Note 5 - Loans Receivable
The following is a summary of loans by type:
|
March 31,
|
||||||||
|
2010
|
2009
|
|||||||
|
(In Thousands)
|
||||||||
|
Real estate mortgage:
|
||||||||
|
One- to four-family
|
$ | 441,018 | $ | 431,055 | ||||
|
Multi-family and commercial
|
24,575 | 21,886 | ||||||
| 465,593 | 452,941 | |||||||
|
Real estate construction
|
863 | 750 | ||||||
|
Consumer:
|
||||||||
|
Second mortgage
|
10,454 | 13,055 | ||||||
|
Passbook or certificate
|
1,004 | 1,149 | ||||||
|
Equity line of credit
|
1,684 | 1,259 | ||||||
|
Other
|
300 | 295 | ||||||
| 13,442 | 15,758 | |||||||
|
Total Loans
|
479,898 | 469,449 | ||||||
|
Less:
|
||||||||
|
Loans in process
|
(537 | ) | (143 | ) | ||||
|
Net purchase premiums, discounts, and deferred loan costs
|
205 | 894 | ||||||
| (332 | ) | 751 | ||||||
| $ | 479,566 | $ | 470,200 | |||||
At March 31, 2010, 2009, and 2008, nonaccrual loans for which interest has been discontinued totaled approximately $2.5 million, $870,000, and $265,000, respectively. During the years ended March 31, 2010, 2009, and 2008, interest income of approximately $58,000, $40,000, and $12,000, respectively, was recognized on these loans. Interest income that would have been recorded, had the loans been on accrual status and performing in accordance with the original terms of the contracts, amounted to approximately $148,000, $56,000, and $15,000, for the years ended March 31, 2010, 2009, and 2008, respectively. There were no loans greater than ninety days past due that are still accruing interest at March 31, 2010, 2009, or 2008.
A loan is defined as impaired when, based on current information and events, it is probable that a creditor will be unable to collect all amounts due under the contractual terms of the loan agreement. We consider one- to four-family mortgage loans and consumer installment loans to be homogeneous and, therefore, do not separately evaluate them for impairment, unless they are considered troubled debt restructurings. All other loans are evaluated for impairment on an individual basis.
51
Clifton Savings Bancorp, Inc. and Subsidiaries
Notes to Consolidated Financial Statements
Note 5 - Loans Receivable (Continued)
At March 31, 2010, 2009 and 2008, impaired loans, totaled approximately $2.2 million, $432,000 and $-0-, respectively. There is no specific allowance designated for impaired loans at March 31 2010, 2009 and 2008. The average balance of impaired loans was $1.7 million, $33,000 and $-0-, respectively, and interest income recognized during the period of impairment totaled approximately $62,000, $1,000 and $-0-, respectively.
The Savings Bank has granted loans to certain officers and directors of the Company and Savings Bank and to their associates. The activity with respect to loans to directors, officers and associates of such persons, is as follows:
|
Years Ended March 31,
|
||||||||
|
2010
|
2009
|
|||||||
|
(In Thousands)
|
||||||||
|
Balance, beginning
|
$ | 550 | $ | 666 | ||||
|
Loans originated
|
230 | - | ||||||
|
Collection of principal
|
(38 | ) | (116 | ) | ||||
|
Balance, ending
|
$ | 742 | $ | 550 | ||||
The following is an analysis of the allowance for loan losses:
|
Years Ended March 31,
|
||||||||||||
|
2010
|
2009
|
2008
|
||||||||||
|
(In Thousands)
|
||||||||||||
|
Balance - beginning
|
$ | 1,700 | $ | 1,440 | $ | 1,350 | ||||||
|
Losses charged to allowance
|
(83 | ) | - | - | ||||||||
|
Provision charged to operations
|
433 | 260 | 90 | |||||||||
|
Balance - ending
|
$ | 2,050 | $ | 1,700 | $ | 1,440 | ||||||
52
Clifton Savings Bancorp, Inc. and Subsidiaries
Notes to Consolidated Financial Statements
Note 6 - Premises and Equipment
|
March 31,
|
||||||||
|
2010
|
2009
|
|||||||
|
(In Thousands)
|
||||||||
|
Land and land improvements
|
$ | 4,577 | $ | 4,289 | ||||
|
Buildings and improvements
|
7,453 | 6,949 | ||||||
|
Furnishings and equipment
|
2,529 | 2,171 | ||||||
|
Leasehold improvements
|
398 | 271 | ||||||
|
Construction in process
|
119 | 744 | ||||||
| 15,076 | 14,424 | |||||||
|
Accumulated depreciation and amortization
|
(5,464 | ) | (5,118 | ) | ||||
| $ | 9,612 | $ | 9,306 | |||||
Included in land and land improvements at March 31, 2010 and 2009 is approximately $1.0 million of land which is being held for future branch expansion.
Rental expenses related to the occupancy of leased premises totaled approximately $141,000, $79,000 and $78,000 for the years ended March 31, 2010, 2009 and 2008, respectively. The minimum obligation under all non-cancellable lease agreements, which expire through May 31, 2020, for each of the years ended March 31 is as follows:
|
|
Amount
|
|||
|
(In Thousands)
|
||||
|
2011
|
$ | 332 | ||
|
2012
|
339 | |||
|
2013
|
336 | |||
|
2014
|
302 | |||
|
2015
|
224 | |||
|
2016 & After
|
530 | |||
| $ | 2,063 | |||
Note 7 - Interest Receivable
|
March 31,
|
||||||||
|
2010
|
2009
|
|||||||
|
(In Thousands)
|
||||||||
|
Loans
|
$ | 2,172 | $ | 2,109 | ||||
|
Mortgage-backed securities
|
1,360 | 1,387 | ||||||
|
Investment securities
|
950 | 840 | ||||||
| 4,482 | 4,336 | |||||||
|
Allowance for uncollected interest on loans
|
(105 | ) | (23 | ) | ||||
| $ | 4,377 | $ | 4,313 | |||||
53
Clifton Savings Bancorp, Inc. and Subsidiaries
Notes to Consolidated Financial Statements
Note 8 – Deposits
|
March 31,
|
||||||||||||||||||||||||
|
2010
|
2009
|
|||||||||||||||||||||||
|
Weighted
|
Weighted
|
|||||||||||||||||||||||
|
Average
|
Average
|
|||||||||||||||||||||||
|
Rate
|
Amount
|
Percent
|
Rate
|
Amount
|
Percent
|
|||||||||||||||||||
|
(Dollars In Thousands)
|
||||||||||||||||||||||||
|
Demand accounts:
|
||||||||||||||||||||||||
|
Non-interest bearing
|
0.00 | % | $ | 6,828 | 0.90 | % | 0.00 | % | $ | 5,263 | 0.83 | |||||||||||||
|
Crystal Checking
|
1.15 | 12,273 | 1.62 | 1.50 | 11,666 | 1.84 | ||||||||||||||||||
|
NOW
|
0.50 | 18,591 | 2.45 | 0.65 | 17,363 | 2.74 | ||||||||||||||||||
|
Super NOW
|
0.60 | 93 | 0.01 | 0.75 | 98 | 0.02 | ||||||||||||||||||
|
Money Market
|
1.05 | 21,755 | 2.87 | 1.34 | 20,541 | 3.24 | ||||||||||||||||||
| 0.78 | 59,540 | 7.85 | 1.03 | 54,931 | 8.67 | |||||||||||||||||||
|
Savings and club accounts
|
1.01 | 102,771 | 13.56 | 1.04 | 91,948 | 14.51 | ||||||||||||||||||
|
Certificates of deposit
|
2.31 | 595,841 | 78.59 | 3.77 | 486,703 | 76.82 | ||||||||||||||||||
|
Total Deposits
|
2.01 | % | $ | 758,152 | 100.00 | % | 3.14 | % | $ | 633,582 | 100.00 | |||||||||||||
Certificates of deposit with balances of $100,000 or more at March 31, 2010 and 2009 totaled approximately $187.5 million and $126.3 million, respectively. The Savings Bank’s deposits are insurable to applicable limits by the Federal Deposit Insurance Corporation. The maximum deposit insurance amount has been increased from $100,000 to $250,000 until December 31, 2013. (The expiration date does not apply to retirement accounts which are generally insured up to $250,000 per plan participant.)
The scheduled maturities of certificates of deposit are as follows:
|
March 31,
|
||||||||
|
2010
|
2009
|
|||||||
|
(In Thousands)
|
||||||||
|
One year or less
|
$ | 396,209 | $ | 393,589 | ||||
|
After one to two years
|
119,862 | 65,980 | ||||||
|
After two to three years
|
67,590 | 19,954 | ||||||
|
After three to four years
|
9,671 | 5,855 | ||||||
|
After four years to five years
|
2,509 | 1,325 | ||||||
| $ | 595,841 | $ | 486,703 | |||||
54
Clifton Savings Bancorp, Inc. and Subsidiaries
Notes to Consolidated Financial Statements
Note 8 – Deposits (Continued)
Interest expense on deposits consists of the following:
|
Years Ended March 31,
|
||||||||||||
|
2010
|
2009
|
2008
|
||||||||||
|
(In Thousands)
|
||||||||||||
|
Demand
|
$ | 481 | $ | 835 | $ | 1,199 | ||||||
|
Savings and club
|
1,009 | 995 | 1,077 | |||||||||
|
Certificates of deposits
|
16,188 | 18,261 | 19,790 | |||||||||
| $ | 17,678 | $ | 20,091 | $ | 22,066 | |||||||
Note 9 - Advances from Federal Home Loan Bank of New York (“FHLB”)
The maturities and weighted average fixed interest rates of FHLB advances were as follows:
| March 31, | ||||||||||||||||
|
2010
|
2009
|
|||||||||||||||
|
Weighted
|
Weighted
|
|||||||||||||||
|
Maturing During
|
Average
|
Average
|
||||||||||||||
|
Year Ending
|
Balance
|
Interest Rate
|
Balance
|
Interest Rate
|
||||||||||||
|
(Dollars In Thousands)
|
||||||||||||||||
|
2010
|
$ | - | - | % | $ | 20,535 | 3.80 | % | ||||||||
|
2011
|
28,070 | 4.03 | 28,070 | 4.03 | ||||||||||||
|
2012
|
16,988 | 3.80 | 16,988 | 3.80 | ||||||||||||
|
2013
|
21,471 | 3.92 | 21,471 | 3.92 | ||||||||||||
|
2014
|
12,308 | 3.43 | 12,308 | 3.43 | ||||||||||||
|
2015
|
2,400 | 3.88 | - | - | ||||||||||||
|
Thereafter
|
42,500 | 3.87 | 44,900 | 3.87 | ||||||||||||
| $ | 123,737 | 3.86 | % | $ | 144,272 | 3.85 | % | |||||||||
55
Clifton Savings Bancorp, Inc. and Subsidiaries
Notes to Consolidated Financial Statements
Note 9 - Advances from Federal Home Loan Bank of New York (“FHLB”) (Continued)
The carrying value of collateral pledged for the above advances was as follows:
|
March 31,
|
||||||||
|
2010
|
2009
|
|||||||
|
(In Thousands)
|
||||||||
|
U.S. Government Agency bonds:
|
||||||||
|
Available for sale
|
$ | 5,056 | $ | - | ||||
|
Held to maturity
|
5,000 | 5,000 | ||||||
| 10,056 | 5,000 | |||||||
|
Mortgage-backed securities:
|
||||||||
|
Available for sale
|
57,081 | 78,122 | ||||||
|
Held to maturity
|
63,324 | 67,701 | ||||||
| 120,405 | 145,823 | |||||||
| $ | 130,461 | $ | 150,823 | |||||
At March 31, 2010, the Company has available to it $94.9 million under an overnight line of credit, and $94.9 million under a one-month adjustable-rate line of credit agreement with the FHLB which expire on August 9, 2010. The Bank’s membership in FHLB also provides access to additional sources of borrowed funds based on the Bank’s ability to collateralize such borrowings. At March 31, 2009, the Company had available to it $88.9 million under a overnight line of credit, and $88.9 million under a one-month overnight repricing line of credit agreement with the FHLB which expired on July 31, 2009. There were no drawings on these lines at March 31, 2010 and 2009. Additionally, the Company has the ability to borrow funds up to $50.0 million at Bank of America and $38.0 million at PNC Capital Markets under unsecured overnight lines of credit at a daily adjustable rate.
Note 10 - Regulatory Capital
The Savings Bank is subject to various regulatory capital requirements administered by the federal banking agencies. Failure to meet minimum capital requirements can initiate certain mandatory, and possibly additional discretionary actions by regulators that, if undertaken, could have a direct material effect on the Savings Bank’s financial statements. Under capital adequacy guidelines and the regulatory framework for prompt corrective action, the Savings Bank must meet specific capital guidelines that involve quantitative measures of the Savings Bank’s assets, liabilities and certain off-balance sheet items as calculated under regulatory accounting principals. The Savings Bank’s capital amounts and classifications are also subject to qualitative judgments by the regulators about components, risk-weightings and other factors.
Quantitative measures established by regulation to ensure capital adequacy require the Savings Bank to maintain minimum amounts and ratios of Total and Tier 1 capital (as defined by regulations) to risk-weighted assets (as defined), and of Tier 1 and tangible capital to adjusted total assets (as defined). Management believes, as of March 31, 2010 and 2009, that the Savings Bank met all capital adequacy requirements to which it was subject.
56
Clifton Savings Bancorp, Inc. and Subsidiaries
Notes to Consolidated Financial Statements
Note 10 - Regulatory Capital (Continued)
The following table presents a reconciliation of the Savings Bank’s capital per GAAP to regulatory capital:
|
March 31,
|
||||||||
|
2010
|
2009
|
|||||||
|
(In Thousands)
|
||||||||
|
GAAP capital
|
$ | 155,760 | $ | 149,525 | ||||
|
Net unrealized (gain) on securities available for sale
|
(1,924 | ) | (1,867 | ) | ||||
|
Net benefit plan change
|
104 | 58 | ||||||
|
Tier 1 capital
|
153,940 | 147,716 | ||||||
|
Allowance for loan losses
|
2,050 | 1,700 | ||||||
|
Total Risk-based Capital
|
$ | 155,990 | $ | 149,416 | ||||
The following table sets forth the Savings Bank’s capital position at March 31, 2010 and 2009 as compared to minimum regulatory capital requirements:
|
OTS Requirements
|
||||||||||||||||||||||||
|
Minimum Capital
|
For Classification as
|
|||||||||||||||||||||||
|
Actual
|
Adequacy
|
Well-Capitalized
|
||||||||||||||||||||||
|
Amount
|
Ratio
|
Amount
|
Ratio
|
Amount
|
Ratio
|
|||||||||||||||||||
|
(Dollars In Thousands)
|
||||||||||||||||||||||||
|
As of March 31, 2010:
|
||||||||||||||||||||||||
|
Total capital (to risk-weighted assets)
|
$ | 155,990 | 41.45 | % | $ | 30,103 | 8.00 | % | $ | 37,629 | 10.00 | % | ||||||||||||
|
Tier 1 capital (to risk-weighted assets)
|
153,940 | 40.91 | 15,052 | 4.00 | 22,577 | 6.00 | ||||||||||||||||||
|
Core (tier 1) capital (to adjusted total assets)
|
153,940 | 14.52 | 42,411 | 4.00 | 53,014 | 5.00 | ||||||||||||||||||
|
Tangible capital (to adjusted tangible assets)
|
153,940 | 14.52 | 15,904 | 1.50 | - | - | ||||||||||||||||||
|
As of March 31, 2009:
|
||||||||||||||||||||||||
|
Total capital (to risk-weighted assets)
|
$ | 149,416 | 42.04 | % | $ | 28,434 | 8.00 | % | $ | 35,543 | 10.00 | % | ||||||||||||
|
Tier 1 capital (to risk-weighted assets)
|
147,716 | 41.56 | 14,217 | 4.00 | 21,326 | 6.00 | ||||||||||||||||||
|
Core (tier 1) capital (to adjusted total assets)
|
147,716 | 15.61 | 37,853 | 4.00 | 47,317 | 5.00 | ||||||||||||||||||
|
Tangible capital (to adjusted tangible assets)
|
147,716 | 15.61 | 14,195 | 1.50 | - | - | ||||||||||||||||||
On July 9, 2009, the most recent notification from the OTS, the Savings Bank was categorized as well capitalized as of March 31, 2009, under the regulatory framework for prompt corrective action. There are no conditions existing or events which have occurred since notification that management believes have changed the Savings Bank’s category.
57
Clifton Savings Bancorp, Inc. and Subsidiaries
Notes to Consolidated Financial Statements
Note 11 - Income Taxes
The components of income taxes are summarized as follows:
|
Years Ended March 31,
|
||||||||||||
|
2010
|
2009
|
2008
|
||||||||||
|
(In Thousands)
|
||||||||||||
|
Current tax expense:
|
||||||||||||
|
Federal income
|
$ | 2,918 | $ | 2,486 | $ | 912 | ||||||
|
State income
|
304 | 346 | 327 | |||||||||
|
Total Current Income Taxes
|
3,222 | 2,832 | 1,239 | |||||||||
|
Deferred tax benefit:
|
||||||||||||
|
Federal income
|
(160 | ) | (272 | ) | (68 | ) | ||||||
|
State income
|
84 | (196 | ) | (535 | ) | |||||||
|
Total Deferred Income Tax Benefit
|
(76 | ) | (468 | ) | (603 | ) | ||||||
| $ | 3,146 | $ | 2,364 | $ | 636 | |||||||
The following table presents a reconciliation between the reported income tax expense and the income tax expense which would be computed by applying the normal federal income tax rate of 34% to income before income taxes:
|
Years Ended March 31,
|
||||||||||||
|
2010
|
2009
|
2008
|
||||||||||
|
(Dollars In Thousands)
|
||||||||||||
|
Federal income tax at the statutory rate
|
$ | 3,211 | $ | 2,550 | $ | 1,023 | ||||||
|
Increase (decrease) in income taxes resulting from:
|
||||||||||||
|
New Jersey income tax, net
|
||||||||||||
|
of federal income tax effect
|
256 | 99 | (137 | ) | ||||||||
|
Bank owned life insurance income
|
(302 | ) | (311 | ) | (308 | ) | ||||||
|
Incentive stock option expense
|
7 | 26 | 52 | |||||||||
|
Other, net
|
(26 | ) | - | 6 | ||||||||
|
Total Income Tax Expense
|
$ | 3,146 | $ | 2,364 | $ | 636 | ||||||
|
Effective income tax rate
|
33.3 | % | 31.5 | % | 21.2 | % | ||||||
58
Clifton Savings Bancorp, Inc. and Subsidiaries
Notes to Consolidated Financial Statements
Note 11 - Income Taxes (Continued)
Deferred tax assets and liabilities consisted of the following:
|
March 31,
|
||||||||
|
2010
|
2009
|
|||||||
|
(In Thousands)
|
||||||||
|
Deferred income tax assets:
|
||||||||
|
Pension costs
|
$ | 898 | $ | 826 | ||||
|
Allowance for loan losses
|
819 | 679 | ||||||
|
Benefit plans
|
- | 141 | ||||||
|
Depreciation
|
183 | 247 | ||||||
|
Post-retirement benefits and healthcare obligations
|
70 | 38 | ||||||
|
Non-qualified benefit plans
|
455 | 437 | ||||||
|
Loan fees
|
1 | 2 | ||||||
|
Employee Stock Ownership Plan
|
308 | 282 | ||||||
|
Supplemental Executive Retirement Plan
|
108 | 96 | ||||||
|
NJ net operating loss carryforwards
|
422 | 501 | ||||||
|
NJ AMA carryover
|
33 | 33 | ||||||
|
Other
|
100 | 26 | ||||||
|
Total Deferred Tax Assets
|
3,397 | 3,308 | ||||||
|
Deferred income tax liabilities:
|
||||||||
|
Net unrealized gain on securities available for sale
|
(1,280 | ) | (1,241 | ) | ||||
|
Other
|
- | (19 | ) | |||||
|
Total Deferred Tax Liabilities
|
(1,280 | ) | (1,260 | ) | ||||
|
Net Deferred Tax Asset Included in Other Assets
|
$ | 2,117 | $ | 2,048 | ||||
At March 31, 2010 the Savings Bank has New Jersey net operating loss carryforwards in the amount of approximately $7.1 million, which expire through 2016.
Retained earnings at March 31, 2010 and 2009, includes approximately $6.4 million of tax bad debt deductions for which deferred taxes have been provided. Reduction of such amount for purposes other than bad debt losses, including non-dividend distributions, will result in income for tax purposes only, and will be subject to income tax at the then current rate. The Company does not intend to make non-dividend distributions that would result in a recapture of any portion of its bad debt reserves.
Note 12 - Employee Benefit Plans
ESOP
Effective upon the consummation of the Savings Bank’s reorganization in March 2004, an ESOP was established for all eligible employees who had completed a twelve-month period of employment with the Savings Bank and at least 1,000 hours of service and had attained the age of 21. The ESOP used $11.0 million in proceeds from a term loan obtained from the Company to purchase 1,099,097 shares of Company common stock. The term loan principal is payable over fifteen equal annual installments through December 31, 2018. Interest on the term loan is fixed at a rate of 4.00%. Each year, the Savings Bank intends to make discretionary contributions to the ESOP
59
Clifton Savings Bancorp, Inc. and Subsidiaries
Notes to Consolidated Financial Statements
Note 12 - Employee Benefit Plans (Continued)
ESOP (Continued)
which will be equal to principal and interest payments required on the term loan. The loan is further paid down by the amount of dividends paid, if any, on the common stock owned by the ESOP.
Shares purchased with the loan proceeds are initially pledged as collateral for the term loan and are held in a suspense account for future allocation among participants. Contributions to the ESOP and shares released from the suspense account will be allocated among the participants on the basis of compensation, as described by the Plan, in the year of allocation.
The ESOP shares pledged as collateral are reported as unearned ESOP shares in the consolidated statements of financial condition. As shares are committed to be released from collateral, the Savings Bank reports compensation expense equal to the current market price of the shares, and the shares become outstanding for basic net income per common share computations. ESOP compensation expense was approximately $661,000, $722,000 and $750,000 for the years ended March 31, 2010, 2009 and 2008, respectively.
The ESOP shares were as follows:
|
March 31,
|
||||||||
|
2010
|
2009
|
|||||||
|
(Dollars In Thousands)
|
||||||||
|
Allocated shares
|
417 | 349 | ||||||
|
Shares committed to be released
|
9 | 9 | ||||||
|
Unearned shares
|
641 | 714 | ||||||
|
Total ESOP Shares
|
1,067 | 1,072 | ||||||
|
Fair value of unearned shares
|
$ | 5,943 | $ | 7,144 | ||||
Section 401(k) Plan (“Plan”)
The Savings Bank sponsors a Plan pursuant to Section 401(k) of the Internal Revenue Code (“IRC”), for all eligible (attainment of age 21 and one year of service) employees. Employees may elect to save up to 25% of their compensation, subject to IRC limits. For each dollar up to 4.5% of compensation, the Savings Bank will match 50% of the employee’s contribution. The Plan expense for the years ended March 31, 2010, 2009, and 2008, was approximately $72,000, $69,000 and $66,000, respectively.
Supplemental Executive Retirement Plan (“SERP”)
Effective upon the consummation of the Savings Bank’s reorganization in March 2004, a SERP was established. The plan provides participating executives with benefits otherwise limited by certain provisions of the Internal Revenue Code or the terms of the employee stock ownership plan loan. Specifically, the plan provides benefits to eligible officers (those designated by the Board of Directors of the Savings Bank) that cannot be provided under the Section 401(k) plan or the ESOP as a result of limitations imposed by the Internal Revenue Code, but that would have been provided under the plans, but for these Internal Revenue Code limitations. In addition to providing for benefits lost under tax-qualified plans as a result of the Internal Revenue Code limitations, the new
60
Clifton Savings Bancorp, Inc. and Subsidiaries
Notes to Consolidated Financial Statements
Note 12 - Employee Benefit Plans (Continued)
Supplemental Executive Retirement Plan (“SERP”) (Continued)
plan also provides supplemental benefits upon a change of control prior to the scheduled repayment of the ESOP loan. Generally, upon a change in control, the SERP provides participants with a benefit equal to what they would have received under the ESOP, had they remained employed throughout the term of the loan, less the benefits actually provided under the plan on the participant’s behalf. A participant’s benefits generally become payable upon a change in control of the Savings Bank and the Company. The SERP expense for the years ended March 31, 2010, 2009, and 2008, was approximately $31,000, $37,000 and $40,000, respectively. At March 31, 2010 and 2009, the accrued SERP liability was $271,000 and $241,000, respectively.
Note 13 - Stock-Based Compensation
At the Company's annual stockholders' meeting held on July 14, 2005, stockholders of the Company approved the Clifton Savings Bancorp, Inc. 2005 Equity Incentive Plan. Under this plan, the Company may grant options to purchase up to 1,495,993 shares of Company common stock and may grant up to 598,397 shares of common stock as restricted stock awards. At March 31, 2010, there were 165,661 shares remaining for future option grants, and 35,191 shares remaining available for future restricted stock awards under the plan.
On December 7, 2005, 585,231 shares of restricted stock were awarded. The restricted shares awarded had a grant date fair value of $10.22 per share. 20% of the shares awarded were immediately vested, with an additional 20% becoming vested annually thereafter. Management recognizes expense for the fair value of these awards on a straight line basis over the requisite service period. During the years ended March 31, 2010, 2009 and 2008, approximately $706,000, $1.1 million and $1.1 million, respectively in expense, was recognized in regard to these restricted stock awards. The Company recognized approximately $282,000, $424,000 and $424,000 of income tax benefits resulting from this expense for the years ended March 31, 2010, 2009 and 2008, respectively. The total fair value of stock awards vested during the years ended March 31, 2010, 2009 and 2008 were approximately $967,000, $1.2 million, and $1.1 million, respectively.
The following is a summary of the status of the Company’s restricted shares:
|
Weighted Average
|
||||||||
|
Restricted
|
Grant Date
|
|||||||
|
Shares
|
Fair Value
|
|||||||
|
Non-vested at March 31, 2008
|
207,880 | $ | 10.22 | |||||
|
Vesting
|
(103,942 | ) | 10.22 | |||||
|
Non-vested at March 31, 2009
|
103,938 | 10.22 | ||||||
|
Forfeited
|
(241 | ) | 10.22 | |||||
|
Vesting
|
(103,697 | ) | 10.22 | |||||
|
Non-vested at March 31, 2010
|
- | |||||||
On August 31, 2005, options to purchase 1,483,510 shares of common stock at $10.24 per share were awarded and will expire no later than ten years following the grant date. Immediately upon grant, 20% of the options awarded were vested, with an additional 20% becoming vested annually thereafter. In February 2006, the Company's Board of Directors approved the acceleration of the second 20% of the option grants so that those options became fully vested as of March 31, 2006. Management recognized expense for the fair value of these
61
Clifton Savings Bancorp, Inc. and Subsidiaries
Notes to Consolidated Financial Statements
Note 13 - Stock-Based Compensation (Continued)
awards on an accelerated attribution basis over the requisite service period. During the years ended March 31, 2010, 2009 and 2008, approximately $66,000, $246,000 and $500,000, respectively, in stock option expense, was recorded net of income tax benefits of $18,000, $68,000 and $139,000, respectively.
A summary of stock option activity follows:
|
Weighted
|
Weighted Average
|
Aggregate
|
|||||||||||
|
Number of
|
Average
|
Remaining
|
Intrinsic
|
||||||||||
|
Stock Options
|
Exercise Price
|
Contractual Term
|
Value
|
||||||||||
|
Outstanding at March 31, 2008
|
1,327,940 | $ | 10.24 | ||||||||||
|
Outstanding at March 31, 2009
|
1,327,940 | $ | 10.24 | - | |||||||||
|
Outstanding at March 31, 2010
|
1,327,940 | $ | 10.24 |
5.42 Years
|
|||||||||
|
Exercisable at March 31, 2010
|
1,327,940 | $ | 10.24 |
5.42 Years
|
- | ||||||||
Shares issued upon the exercise of stock options are issued from treasury stock. The Company has an adequate number of treasury shares available for future stock option exercises.
The fair value of the options granted on August 31, 2005, as computed using the Black-Scholes option-pricing model, was determined to be $2.38 per option based upon the following underlying assumptions: a risk-free interest rate, expected option life, expected stock price volatility, and dividend yield of 4.11%, 6.0 years, 21.56%, and 1.95%, respectively.
Note 14 – Defined benefit plans
Directors’ Retirement Plan
The Directors’ Retirement Plan is a nonqualified, unfunded pension plan with benefits based on fees paid to directors while still active. The funding policy is to pay directors on a pay-as-you-go basis.
The following table sets forth the funded status for the Directors’ Retirement Plan and amounts recognized in the consolidated statements of financial condition.
62
Clifton Savings Bancorp, Inc. and Subsidiaries
Notes to Consolidated Financial Statements
Note 14 - Defined benefit plans (Continued)
Directors’ Retirement Plan (Continued)
|
March 31,
|
||||||||
|
2010
|
2009
|
|||||||
|
(Dollars In Thousands)
|
||||||||
|
Change in projected benefit obligations:
|
||||||||
|
Benefit obligation - beginning
|
$ | 2,090 | $ | 2,152 | ||||
|
Service cost
|
81 | 88 | ||||||
|
Interest cost
|
148 | 138 | ||||||
|
Actuarial loss (gain)
|
139 | (256 | ) | |||||
|
Benefits paid
|
(89 | ) | (89 | ) | ||||
|
Adjustment for measurement date change
|
- | 57 | ||||||
|
Benefit obligation - ending
|
2,369 | 2,090 | ||||||
|
Change in plan assets:
|
||||||||
|
Fair value of plan assets - beginning
|
- | - | ||||||
|
Employer contribution
|
89 | 89 | ||||||
|
Benefits paid
|
(89 | ) | (89 | ) | ||||
|
Fair value of plan assets - ending
|
- | - | ||||||
|
Funded status and accrued pension cost included in other liabilities
|
$ | (2,369 | ) | $ | (2,090 | ) | ||
|
Assumptions:
|
||||||||
|
Discount rate
|
6.25 | % | 7.25 | % | ||||
|
Rate of increase in compensation
|
4.50 | % | 4.50 | % | ||||
The Savings Bank expects to make contributions to the plan during the year ending March 31, 2011, totaling approximately $99,000. At March 31, 2010, benefit payments expected to be paid under the plan are as follows:
|
Amount
|
||||||
|
Years ending March 31:
|
(In Thousands)
|
|||||
|
2011
|
$ 99
|
|||||
|
2012
|
124
|
|||||
|
2013
|
138
|
|||||
|
2014
|
164
|
|||||
|
2015
|
180
|
|||||
|
2016-2020
|
961
|
|||||
|
$ 1,666
|
||||||
63
Clifton Savings Bancorp, Inc. and Subsidiaries
Notes to Consolidated Financial Statements
Note 14 - Defined benefit plans (Continued)
Directors’ Retirement Plan (Continued)
Net periodic pension cost for the plan included the following components:
|
Years Ended March 31,
|
||||||||||||
|
2010
|
2009
|
2008
|
||||||||||
|
(Dollars In Thousands)
|
||||||||||||
|
Service cost
|
$ | 81 | $ | 88 | $ | 81 | ||||||
|
Interest cost
|
148 | 138 | 127 | |||||||||
|
Net amortization and deferral
|
50 | 86 | 86 | |||||||||
|
Net Periodic Pension Cost Included in
|
||||||||||||
|
Directors' Compensation
|
$ | 279 | $ | 312 | $ | 294 | ||||||
|
Assumptions:
|
||||||||||||
|
Discount rate
|
7.250 | % | 6.500 | % | 6.250 | % | ||||||
|
Rate of increase in compensation
|
4.500 | % | 4.500 | % | 4.000 | % | ||||||
At March 31, 2010 and 2009 unrecognized net loss (gain) of $24,000 and ($115,000) and unrecognized prior service cost of $250,000 and $300,000, respectively, were included in accumulated other comprehensive income. For the fiscal year ending March 31, 2011, $40,000 of prior service cost is expected to be recognized as a component of net periodic pension cost.
Former President’s Post-retirement Healthcare Plan
The Former President’s post-retirement healthcare plan is a nonqualified, unfunded plan with the only participant being the former president’s spouse, since his death in February 2005. This healthcare plan provides coverage for the spouse’s life. The annual costs associated with these benefits are accrued on the basis of actuarial assumptions and included in salaries and employee benefits.
64
Clifton Savings Bancorp, Inc. and Subsidiaries
Notes to Consolidated Financial Statements
Note 14 - Defined benefit plans (Continued)
Former President’s Post-retirement Healthcare Plan (Continued)
The following table sets forth the funded status for the Former President’s post-retirement healthcare plan and amounts recognized in the consolidated statements of financial condition:
|
March 31,
|
||||||||
|
2010
|
2009
|
|||||||
|
(Dollars In Thousands)
|
||||||||
|
Change in projected benefit obligations:
|
||||||||
|
Benefit obligation - beginning
|
$ | 72 | $ | 98 | ||||
|
Interest cost
|
5 | 6 | ||||||
|
Actuarial (gain)
|
(16 | ) | (1 | ) | ||||
|
Benefits paid
|
(6 | ) | (32 | ) | ||||
|
Adjustment for measurement date change
|
- | 1 | ||||||
|
Benefit obligation - ending
|
55 | 72 | ||||||
|
Change in plan assets:
|
||||||||
|
Fair value of plan assets - beginning
|
- | - | ||||||
|
Employer contribution
|
6 | 32 | ||||||
|
Benefits paid
|
(6 | ) | (32 | ) | ||||
|
Fair value of plan assets - ending
|
- | - | ||||||
|
Funded status and accrued pension cost included in other liabilities
|
$ | (55 | ) | $ | (72 | ) | ||
|
Assumed discount rate
|
6.25 | % | 7.25 | % | ||||
The Savings Bank expects to make contributions to the Plan during the year ending March 31, 2011, totaling approximately $4,000. At March 31, 2010, benefit payments expected to be paid under the Plan are as follows:
|
Amount
|
|||||||
|
Years ending March 31:
|
(In Thousands)
|
||||||
|
2011
|
$ 4
|
||||||
|
2012
|
5
|
||||||
|
2013
|
5
|
||||||
|
2014
|
5
|
||||||
|
2015
|
5
|
||||||
|
2016-2020
|
24
|
||||||
|
$ 48
|
|||||||
65
Clifton Savings Bancorp, Inc. and Subsidiaries
Notes to Consolidated Financial Statements
Note 14 - Defined benefit plans (Continued)
Former President’s Post-retirement Healthcare Plan (Continued)
Net periodic pension cost (benefit) for the Plan included the following components:
|
Years Ended March 31,
|
||||||||||||
|
2010
|
2009
|
2008
|
||||||||||
|
(Dollars In Thousands)
|
||||||||||||
|
Interest cost
|
$ | 5 | $ | 6 | $ | 7 | ||||||
|
Net amortization and deferral
|
(6 | ) | (8 | ) | (10 | ) | ||||||
|
Net Periodic (Benefit)
|
$ | (1 | ) | $ | (2 | ) | $ | (3 | ) | |||
|
Assumed discount rate
|
7.250 | % | 6.500 | % | 6.250 | % | ||||||
|
Current medical trend
|
5.250 | % | 5.250 | % | N/A | |||||||
|
Ultimate medical trend
|
5.250 | % | 5.250 | % | N/A | |||||||
At March 31, 2010 and 2009, unrecognized net (gain) of ($100,000) and ($90,000) was included in accumulated other comprehensive income. For the fiscal year ending March 31, 2011, ($7,000) of the net (gain) is expected to be recognized as a component of net periodic pension benefit.
Assumed healthcare cost trend rates have a significant effect on the amounts reported for healthcare plans. A 1% change in the assumed health cost trend rate would have had the following effects on post-retirement benefits under this plan at March 31, 2010:
| 1% | ||||||||
|
Increase
|
Decrease
|
|||||||
|
(In Thousands)
|
||||||||
|
Effect on total service and interest costs
|
$ | 5 | $ | 5 | ||||
|
Effect on post-retirement benefit obligation
|
$ | 59 | $ | 51 | ||||
Note 15 - Fair Value of Financial Instruments
ASC Topic 820 “Fair Value Measurements and Disclosures” establishes a fair value hierarchy that prioritizes the inputs to valuation techniques used to measure fair value. The hierarchy gives the highest priority to unadjusted quoted prices in active markets for identical assets or liabilities (level 1 measurements) and the lowest priority to unobservable inputs (level 3 measurements). The three levels of the fair value hierarchy are described below:
Basis of Fair Value Measurement:
Level 1: Unadjusted quoted prices in active markets that are accessible at the measurement date for identical unrestricted assets or liabilities;
Level 2: Quoted prices in markets that are not active, or inputs that are observable either directly or indirectly, for substantially the full term of the asset or liability;
66
Clifton Savings Bancorp, Inc. and Subsidiaries
Notes to Consolidated Financial Statements
Note 15 - Fair Value of Financial Instruments (continued)
Level 3: Price or valuation techniques that require inputs that are both significant to the fair value measurement and unobservable (i.e. supported with little or no market activity).
An asset’s or liability’s level within the fair value hierarchy is based on the lowest level of input that is significant to the fair value measurement.
For assets measured at fair value on a recurring basis, the fair value measurements by level within the fair value hierarchy used at March 31, 2010 and March 31, 2009 are as follows:
|
(Level 1)
|
(Level 2)
|
|||||||||||||||
|
Quoted Prices
|
Significant
|
(Level 3)
|
||||||||||||||
|
in Active
|
Other
|
Significant
|
||||||||||||||
|
Carrying
|
Markets for
|
Observable
|
Unobservable
|
|||||||||||||
|
Description
|
Value
|
Identical Assets
|
Inputs
|
Inputs
|
||||||||||||
|
March 31, 2010:
|
(In Thousands)
|
|||||||||||||||
|
Securities available for sale:
|
||||||||||||||||
|
Mortgage-backed securities:
|
||||||||||||||||
|
Federal Home Loan Mortgage Corporation
|
$ | 24,960 | $ | - | $ | 24,960 | $ | - | ||||||||
|
Federal National Mortgage Association
|
32,121 | - | 32,121 | - | ||||||||||||
|
U.S. Government agencies
|
15,062 | - | 15,062 | - | ||||||||||||
|
Total securities available for sale
|
$ | 72,143 | $ | - | $ | 72,143 | $ | - | ||||||||
|
March 31, 2009:
|
||||||||||||||||
|
Securities available for sale:
|
||||||||||||||||
|
Mortgage-backed securities:
|
||||||||||||||||
|
Federal Home Loan Mortgage Corporation
|
$ | 34,823 | $ | - | $ | 34,823 | $ | - | ||||||||
|
Federal National Mortgage Association
|
43,299 | - | 43,299 | - | ||||||||||||
|
U.S. Government agencies
|
10,037 | - | 10,037 | - | ||||||||||||
|
Total securities available for sale
|
$ | 88,159 | $ | - | $ | 88,159 | $ | - | ||||||||
For assets measured at fair value on a non-recurring basis, the fair value measurements by level within the fair value hierarchy used at March 31, 2010 and March 31, 2009 are as follows:
|
(Level 1)
|
(Level 2)
|
|||||||||||||||
|
Quoted Prices
|
Significant
|
(Level 3)
|
||||||||||||||
|
in Active
|
Other
|
Significant
|
||||||||||||||
|
Carrying
|
Markets for
|
Observable
|
Unobservable
|
|||||||||||||
|
Description
|
Value
|
Identical Assets
|
Inputs
|
Inputs
|
||||||||||||
|
(In Thousands)
|
||||||||||||||||
|
March 31, 2010:
|
||||||||||||||||
|
Impaired Loans
|
$ | 436 | $ | - | $ | 436 | $ | - | ||||||||
|
March 31, 2009:
|
||||||||||||||||
|
Impaired Loans
|
$ | - | $ | - | $ | - | $ | - | ||||||||
There are no liabilities measured at fair value on a recurring and non-recurring basis at March 31, 2010 and March 31, 2009.
67
Clifton Savings Bancorp, Inc. and Subsidiaries
Notes to Consolidated Financial Statements
Note 15 - Fair Value of Financial Instruments (Continued)
The following information should not be interpreted as an estimate of the fair value of the Company since a fair value calculation is only provided for a limited portion of the Company’s assets and liabilities. Due to a wide range of valuation techniques and the degree of subjectivity used in making the estimates, comparisons between the Company’s disclosures and those of other companies may not be meaningful. The following methods and assumptions were used to estimate the fair values of the Company’s financial instruments.
Cash and Cash Equivalents, Interest Receivable and Interest Payable (Carried at Cost)
The carrying amounts reported in the consolidated statements of financial condition for cash and cash equivalents, interest receivable and interest payable approximate their fair values.
Securities
The fair value of all securities, whether classified as available for sale (carried at fair value) or held to maturity (carried at cost), is determined by reference to quoted market prices, where available. If quoted market prices are not available, fair values are based on quoted market prices of comparable instruments. Securities that we measure on a recurring basis are limited to our available-for-sale portfolio. The fair values of these securities are obtained from quotes received from an independent broker. The Company’s broker provides it with prices which are categorized as Level 2 since quoted prices in active markets for identical assets are generally not available.
Loans Receivable (Carried at Cost)
Fair value is estimated by discounting the future cash flows, using the current rates at which similar loans would be made to borrowers with similar credit ratings and for the same remaining maturities, of such loans.
Impaired Loans (Carried based on Discounted Cash Flows)
Impaired loans are those accounted for under ASC Topic 310 “Accounting by Creditors for Impairment of a Loan” in which the Company has measured impairment generally based on either the fair value of the loan’s collateral or discounted cash flows. These assets are included as Level 2 fair values since they are based on observable inputs that are significant to the discounted cash flow measurement. The carrying value at March 31, 2010 consists of one residential real estate loan with a balance of $517,000 less a partial charge-off of $81,000 which represented a loss due to the troubled debt restructuring of this loan.
Federal Home Loan Bank of New York Stock (Carried at Cost)
Fair value approximates cost basis as these instruments are redeemable only with the issuing agency at face value.
Deposits (Carried at Cost)
The fair value of non-interest-bearing demand, Crystal Checking, NOW, Super NOW, Money Market and Savings and Club accounts is the amount payable on demand at the reporting date. For fixed-maturity certificates of deposit, fair value is estimated by discounting future cash flows using the rates currently offered for deposits of similar remaining maturities.
Advances from Federal Home Loan Bank of New York (Carried at Cost)
The fair value is estimated by discounting future cash flows using rates currently offered for liabilities of similar remaining maturities, or when available, quoted market prices.
68
Clifton Savings Bancorp, Inc. and Subsidiaries
Notes to Consolidated Financial Statements
Note 15 - Fair Value of Financial Instruments (continued)
Commitments to Extend Credit
The fair value of commitments is estimated using the fees currently charged to enter into similar agreements, taking into account the remaining terms of the agreements and the present creditworthiness of the counterparties. For fixed-rate loan commitments, fair value also considers the difference between current levels of interest rates and the committed rates.
As of March 31, 2010 and March 31, 2009, the fair value of the commitments to extend credit were not considered to be material.
The carrying amounts and fair values of financial instruments are as follows:
|
March 31,
|
||||||||||||||||
|
2010
|
2009
|
|||||||||||||||
|
Carrying
|
Estimated
|
Carrying
|
Estimated
|
|||||||||||||
|
Value
|
Fair Value
|
Value
|
Fair Value
|
|||||||||||||
|
Financial assets:
|
(In Thousands)
|
|||||||||||||||
|
Cash and cash equivalents
|
$ | 33,461 | $ | 33,461 | $ | 51,126 | $ | 51,126 | ||||||||
|
Securities available for sale:
|
||||||||||||||||
|
Investment
|
15,062 | 15,062 | 10,037 | 10,037 | ||||||||||||
|
Mortgage-backed
|
57,081 | 57,081 | 78,122 | 78,122 | ||||||||||||
|
Securities held to maturity:
|
||||||||||||||||
|
Investment
|
159,969 | 159,511 | 74,997 | 75,754 | ||||||||||||
|
Mortgage-backed
|
275,801 | 285,536 | 231,218 | 240,173 | ||||||||||||
|
Net loans receivable
|
477,516 | 485,068 | 468,500 | 475,209 | ||||||||||||
|
Federal Home Loan Bank of New York stock
|
7,157 | 7,157 | 7,740 | 7,740 | ||||||||||||
|
Interest receivable
|
4,377 | 4,377 | 4,313 | 4,313 | ||||||||||||
|
Financial liabilities:
|
||||||||||||||||
|
Deposits
|
758,152 | 762,521 | 633,582 | 639,086 | ||||||||||||
|
FHLB advances
|
123,737 | 132,070 | 144,272 | 148,256 | ||||||||||||
|
Interest payable
|
471 | 471 | 554 | 554 | ||||||||||||
Note 16 - Commitments and Contingencies
The Company, Savings Bank and Botany are parties to financial instruments with off-balance-sheet risk in the normal course of business to meet investment needs and the financing needs of the Savings Bank’s customers. These financial instruments primarily include commitments to originate and purchase loans. Those instruments involve, to varying degrees, elements of credit and interest rate risk in excess of the amount recognized in the consolidated statements of financial condition. The contract or notional amounts of those instruments reflect the extent of involvement in particular classes of financial instruments.
Commitments to originate loans are agreements to lend to a customer as long as there is no violation of any condition established in the contract. Commitments generally have fixed expiration dates or other termination
69
Clifton Savings Bancorp, Inc. and Subsidiaries
Notes to Consolidated Financial Statements
Note 16 - Commitments and Contingencies (Continued)
clauses and may require payment of a fee. Since many of the commitments are expected to expire without being drawn upon, the total commitment amounts do not necessarily represent future cash requirements. The Savings Bank evaluates each customer’s creditworthiness on a case-by-case basis. The amount of collateral obtained, if deemed necessary by the Savings Bank, upon extension of credit, is based on management’s credit evaluation of the counterparty.
The Savings Bank, at March 31, 2010, had outstanding commitments to originate loans totaling approximately $3.7 million which included $3.0 million for fixed-rate mortgage loans with interest rates ranging from 4.375% to 5.750%, a $550,000 fixed-rate commercial mortgage loan with a rate of 6.625%, and $48,000 for a fixed-rate second mortgage loan with an interest rate of 6.250%. In addition, there was a commitment outstanding for a $150,000 home equity line of credit with an initial rate of 4.50%. Outstanding loan commitments at March 31, 2009 totaled $15.6 million. These commitments generally expire in three months or less.
At March 31, 2010, The Savings Bank had outstanding commitments to purchase a $500,000 participation in a $6.5 million construction loan, and a $560,000 participation in a $5.6 million construction loan with adjustable interest rates of 2.50% over the one month London Interbank Offering Rate and floors of 6.25%. Also, the Bank has a commitment to purchase a $500,000 participation in a $1.7 million construction loan with an adjustable interest rate at the Prime Rate with a floor of 5.25%.
At March 31, 2010, The Savings Bank also had a commitment outstanding to purchase a $5.0 million Federal National Mortgage Association bond with a fixed interest rate of 3.10%. In addition, at March 31, 2010, the Savings Bank had commitments outstanding related to the renovation of new branch offices as well as repairs at existing branches totaling approximately $216,000.
At March 31, 2010 and 2009, undisbursed funds from customer approved unused lines of credit under a homeowners’ equity lending program amounted to approximately $3.9 million and $2.4 million, respectively. Unless they are specifically cancelled by notice from the Savings Bank, these funds represent firm commitments available to the respective borrowers on demand.
Management does not anticipate losses on any of the foregoing transactions.
Periodically, there have been various claims and lawsuits against the Company and Savings Bank, such as claims to enforce liens, condemnation proceedings on properties in which we hold security interests, claims involving the making and servicing of real property loans and other issues incident to our business. We are not a party to any pending legal proceedings that we believe would have a material adverse effect on our consolidated financial condition, results of operations or cash flows.
70
Clifton Savings Bancorp, Inc. and Subsidiaries
Notes to Consolidated Financial Statements
Note 17 – Comprehensive Income
The components of accumulated other comprehensive gain included in stockholders’ equity are as follows:
|
March 31,
|
||||||||
|
2010
|
2009
|
|||||||
|
(In Thousands)
|
||||||||
|
Net unrealized gain on securities available for sale
|
$ | 3,204 | $ | 3,107 | ||||
|
Tax effect
|
(1,280 | ) | (1,241 | ) | ||||
|
Net of tax amount
|
1,924 | 1,866 | ||||||
|
Benefit plan adjustments
|
(174 | ) | (95 | ) | ||||
|
Tax effect
|
70 | 38 | ||||||
|
Net of tax amount
|
(104 | ) | (57 | ) | ||||
|
Accumulated other comprehensive income
|
$ | 1,820 | $ | 1,809 | ||||
The components of other comprehensive income and related tax effects are presented in the following table:
|
Years Ended March 31,
|
||||||||||||
|
2010
|
2009
|
2008
|
||||||||||
|
(In Thousands)
|
||||||||||||
|
Unrealized holding gain on securities available for sale:
|
||||||||||||
|
Unrealized holding gain arising during the year
|
$ | 97 | $ | 1,771 | $ | 2,346 | ||||||
|
Defined benefit pension plan:
|
||||||||||||
|
Pension (gain) loss
|
(129 | ) | 249 | 35 | ||||||||
|
Prior service cost
|
50 | 86 | 86 | |||||||||
|
Net change in defined benefit pension plan accrued expense
|
(79 | ) | 335 | 121 | ||||||||
|
Other comprehensive income before taxes
|
18 | 2,106 | 2,467 | |||||||||
|
Tax effect
|
(7 | ) | (841 | ) | (985 | ) | ||||||
|
Other comprehensive income
|
$ | 11 | $ | 1,265 | $ | 1,482 | ||||||
71
Clifton Savings Bancorp, Inc. and Subsidiaries
Notes to Consolidated Financial Statements
Note 18 - Parent Only Financial Information
The following are the condensed financial statements for Clifton Savings Bancorp, Inc. (Parent company only) as of March 31, 2010 and 2009 and for the three years ended March 31, 2010.
|
STATEMENTS OF CONDITION
|
||||||||
|
March 31,
|
||||||||
|
2010
|
2009
|
|||||||
|
(In Thousands)
|
||||||||
|
ASSETS
|
||||||||
|
Cash and due from banks
|
$ | 8,814 | $ | 5,336 | ||||
|
Securities held to maturity, at cost:
|
||||||||
|
Investment
|
- | 9,997 | ||||||
|
Mortgage-backed
|
3,923 | - | ||||||
|
Loan receivable from Savings Bank
|
7,432 | 8,100 | ||||||
|
Investment in subsidiary
|
155,760 | 149,525 | ||||||
|
Interest receivable
|
84 | 242 | ||||||
|
Other assets
|
63 | 64 | ||||||
|
Total Assets
|
$ | 176,076 | $ | 173,264 | ||||
|
LIABILITIES AND STOCKHOLDERS' EQUITY
|
||||||||
|
Other liabilities
|
$ | 84 | $ | 100 | ||||
|
Stockholders' equity
|
175,992 | 173,164 | ||||||
|
Total Liabilities and Stockholders' Equity
|
$ | 176,076 | $ | 173,264 | ||||
72
Clifton Savings Bancorp, Inc. and Subsidiaries
Notes to Consolidated Financial Statements
Note 18 - Parent Only Financial Information (Continued)
|
STATEMENTS OF INCOME
|
||||||||||||
|
Years Ended March 31,
|
||||||||||||
|
2010
|
2009
|
2008
|
||||||||||
|
(In Thousands)
|
||||||||||||
|
Income:
|
||||||||||||
|
Dividends from subsidiary
|
$ | 1,700 | $ | 7,950 | $ | - | ||||||
|
Interest on loans
|
307 | 333 | 359 | |||||||||
|
Interest on securities
|
269 | 429 | 445 | |||||||||
|
Total Income
|
2,276 | 8,712 | 804 | |||||||||
|
Non-interest expenses
|
589 | 560 | 589 | |||||||||
|
Income before Income Taxes and
|
||||||||||||
|
Equity in Undistributed Earnings of Subsidiary
|
1,687 | 8,152 | 215 | |||||||||
|
Income taxes
|
1 | 81 | 87 | |||||||||
|
Income before Equity in Undistributed (Overdistributed)
|
||||||||||||
|
Earnings of Subsidiary
|
1,686 | 8,071 | 128 | |||||||||
|
Equity in undistributed (overdistributed) earnings of subsidiary
|
4,611 | (2,935 | ) | 2,244 | ||||||||
|
Net Income
|
$ | 6,297 | $ | 5,136 | $ | 2,372 | ||||||
73
Clifton Savings Bancorp, Inc. and Subsidiaries
Notes to Consolidated Financial Statements
Note 18 - Parent Only Financial Information (Continued)
|
STATEMENTS OF CASH FLOW
|
||||||||||||
|
Years Ended March 31,
|
||||||||||||
|
2010
|
2009
|
2008
|
||||||||||
|
(In Thousands)
|
||||||||||||
|
Cash Flows From Operating Activities
|
||||||||||||
|
Net income
|
$ | 6,297 | $ | 5,136 | $ | 2,372 | ||||||
|
Adjustments to reconcile net income to net cash provided by
|
||||||||||||
|
operating activities:
|
||||||||||||
|
Accretion of discounts
|
(3 | ) | (4 | ) | (4 | ) | ||||||
|
Decrease in interest receivable
|
158 | 7 | 123 | |||||||||
|
Decrease in other assets
|
1 | 5 | 4 | |||||||||
|
(Decrease) increase in other liabilities
|
(16 | ) | 24 | (450 | ) | |||||||
|
Increase in deferred compensation obligation under Rabbi Trust
|
28 | 31 | 34 | |||||||||
|
Equity in (undistributed) overdistributed earnings of subsidiary
|
(4,611 | ) | 2,935 | (2,244 | ) | |||||||
|
Net Cash Provided by (Used in) Operating Activities
|
1,854 | 8,134 | (165 | ) | ||||||||
|
Cash Flows From Investing Activities
|
||||||||||||
|
Proceeds from maturities of investment securities held to maturity
|
10,000 | - | 10,000 | |||||||||
|
Purchase of mortgage-backed securities held to maturity
|
(3,923 | ) | - | - | ||||||||
|
Repayment of loan receivable from Savings Bank
|
668 | 642 | 617 | |||||||||
|
Cash dividends paid on unallocated ESOP shares used to repay
|
||||||||||||
|
loan receivable from Savings Bank
|
(143 | ) | (160 | ) | (174 | ) | ||||||
|
Net Cash Provided by Investing Activities
|
6,602 | 482 | 10,443 | |||||||||
|
Cash Flows From Financing Activities
|
||||||||||||
|
Minority dividends paid
|
(1,825 | ) | (1,872 | ) | (2,063 | ) | ||||||
|
Purchase of treasury stock
|
(3,150 | ) | (5,877 | ) | (16,466 | ) | ||||||
|
Purchase of forfeited restricted stock awards
|
(3 | ) | - | (8 | ) | |||||||
|
Net Cash (Used in) Financing Activities
|
(4,978 | ) | (7,749 | ) | (18,537 | ) | ||||||
|
Net Increase (Decrease) in Cash and Cash Equivalents
|
3,478 | 867 | (8,259 | ) | ||||||||
|
Cash and Cash Equivalents - Beginning
|
5,336 | 4,469 | 12,728 | |||||||||
|
Cash and Cash Equivalents - Ending
|
$ | 8,814 | $ | 5,336 | $ | 4,469 | ||||||
74
Clifton Savings Bancorp, Inc. and Subsidiaries
Notes to Consolidated Financial Statements
Note 19 - Quarterly Financial Data (Unaudited)
|
Quarter Ended
|
||||||||||||||||
|
June 30,
|
September 30,
|
December 31,
|
March 31,
|
|||||||||||||
|
2009
|
2009
|
2009
|
2010
|
|||||||||||||
|
(In Thousands, Except Share and Per Share Data)
|
||||||||||||||||
|
Interest income
|
$ | 10,919 | $ | 11,244 | $ | 11,355 | $ | 11,438 | ||||||||
|
Interest expense
|
6,334 | 6,020 | 5,484 | 5,128 | ||||||||||||
|
Net Interest Income
|
4,585 | 5,224 | 5,871 | 6,310 | ||||||||||||
|
Provision for loan losses
|
100 | 333 | - | - | ||||||||||||
|
Non-interest income
|
290 | 292 | 289 | 265 | ||||||||||||
|
Non-interest expenses
|
3,624 | 3,238 | 3,166 | 3,222 | ||||||||||||
|
Income taxes
|
307 | 624 | 1,012 | 1,203 | ||||||||||||
|
Net Income
|
$ | 844 | $ | 1,321 | $ | 1,982 | $ | 2,150 | ||||||||
|
Net income per common share - basic and diluted
|
$ | 0.03 | $ | 0.05 | $ | 0.08 | $ | 0.08 | ||||||||
|
Dividends per common share
|
$ | 0.05 | $ | 0.05 | $ | 0.05 | $ | 0.05 | ||||||||
|
Weighted average number of common shares
|
||||||||||||||||
|
and common stock equivalents outstanding:
|
||||||||||||||||
|
Basic
|
26,020 | 26,021 | 25,940 | 25,808 | ||||||||||||
|
Diluted
|
26,084 | 26,087 | 25,940 | 25,808 | ||||||||||||
75
Clifton Savings Bancorp, Inc. and Subsidiaries
Notes to Consolidated Financial Statements
Note 19 - Quarterly Financial Data (Unaudited) (Continued)
|
Quarter Ended
|
||||||||||||||||
|
June 30,
|
September 30,
|
December 31,
|
March 31,
|
|||||||||||||
|
2008
|
2008
|
2008
|
2009
|
|||||||||||||
|
(In Thousands, Except Share and Per Share Data)
|
||||||||||||||||
|
Interest income
|
$ | 10,767 | $ | 11,157 | $ | 11,382 | $ | 11,095 | ||||||||
|
Interest expense
|
6,571 | 6,488 | 6,506 | 6,374 | ||||||||||||
|
Net Interest Income
|
4,196 | 4,669 | 4,876 | 4,721 | ||||||||||||
|
Provision for loan losses
|
- | 115 | - | 145 | ||||||||||||
|
Non-interest income
|
290 | 285 | 288 | 287 | ||||||||||||
|
Non-interest expenses
|
2,854 | 2,818 | 2,895 | 3,285 | ||||||||||||
|
Income taxes
|
500 | 657 | 724 | 483 | ||||||||||||
|
Net Income
|
$ | 1,132 | $ | 1,364 | $ | 1,545 | $ | 1,095 | ||||||||
|
Net income per common share - basic and diluted
|
$ | 0.04 | $ | 0.05 | $ | 0.06 | $ | 0.04 | ||||||||
|
Dividends per common share
|
$ | 0.05 | $ | 0.05 | $ | 0.05 | $ | 0.05 | ||||||||
|
Weighted average number of common shares
|
||||||||||||||||
|
and common stock equivalents outstanding:
|
||||||||||||||||
|
Basic
|
26,345 | 26,106 | 26,054 | 26,034 | ||||||||||||
|
Diluted
|
26,346 | 26,180 | 26,136 | 26,079 | ||||||||||||
76
Stock Performance Graph
The following graph compares the cumulative total stockholder return on the Company's common stock with the cumulative total return on the Nasdaq Composite Index (U.S. Companies) and the SNL All Thrifts Index. Total return assumes the reinvestment of all dividends. The graph assumes $100 was invested at the close of business on March 31, 2005.
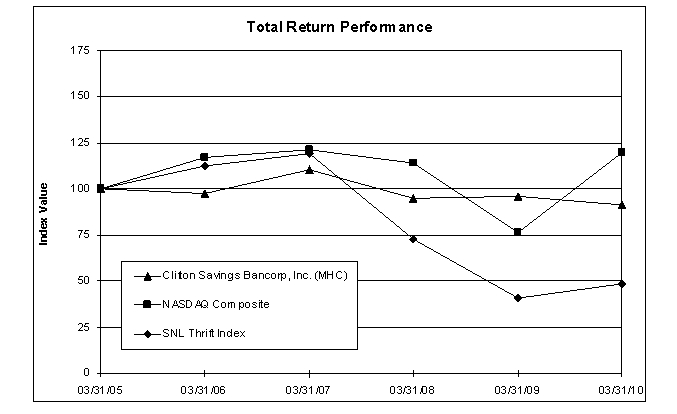
|
Period Ending
|
||||||
|
Index
|
03/31/05
|
03/31/06
|
03/31/07
|
03/31/08
|
03/31/09
|
03/31/10
|
|
Clifton Savings Bancorp, Inc. (MHC)
|
100.00
|
97.32
|
110.61
|
95.13
|
96.24
|
91.12
|
|
NASDAQ Composite
|
100.00
|
117.03
|
121.13
|
114.00
|
76.46
|
119.94
|
|
SNL Thrift Index
|
100.00
|
112.64
|
119.10
|
72.59
|
40.59
|
48.64
|
77
Investor and Corporate Information
Annual Meeting
The annual meeting of stockholders will be held at 9:00 a.m., on August 12, 2010 at the Valley Regency located at 1129 Valley Road, Clifton, NJ 07013.
Stock Listing
Clifton Savings Bancorp, Inc.’s common stock is listed on the Nasdaq Global Select Market under the symbol “CSBK.”
Price Range of Common Stock
The following table sets forth the high and low sales prices of Clifton Savings Bancorp, Inc.’s common stock, as reported on the Nasdaq Global Select Market, and the per share dividend declared during each quarter. Clifton MHC, our majority stockholder, has waived its right to receive these dividends.
|
2010
|
2009
|
||||||
|
Quarter Ended
|
High
|
Low
|
Dividend Declared
|
High
|
Low
|
Dividend Declared
|
|
|
June 30
|
$11.65
|
$9.57
|
$0.05
|
$10.62
|
$9.74
|
$0.05
|
|
|
September 30
|
$11.21
|
$9.80
|
$0.05
|
$11.99
|
$9.76
|
$0.05
|
|
|
December 31
|
$10.30
|
$8.61
|
$0.05
|
$11.86
|
$9.56
|
$0.05
|
|
|
March 31
|
$9.82
|
$8.52
|
$0.05
|
$11.92
|
$8.05
|
$0.05
|
|
At May 28, 2010 there were 1,368 holders of record of Clifton Savings Bancorp common stock.
Stockholders and General Inquiries
Bart D’Ambra
Clifton Savings Bancorp, Inc.
1433 Van Houten Avenue
Clifton, New Jersey 07013
(973) 473-2200
Annual and Other Reports
A copy of the Clifton Savings Bancorp Annual Report on Form 10-K without exhibits for the year ended March 31, 2010, as filed with the Securities and Exchange Commission, may be obtained without charge by contacting Bart D’Ambra, Clifton Savings Bancorp, Inc., 1433 Van Houten Avenue, Clifton, New Jersey 07013.
Independent Auditors
ParenteBeard LLC
100 Walnut Avenue, Suite 200
Clark, New Jersey 07066
Corporate Counsel
Kilpatrick Stockton LLP
Suite 900
607 14th Street, NW
Washington, DC 20005
Transfer Agent
Registrar and Transfer Company
10 Commerce Drive
Cranford, New Jersey 07016
78